Full Length Research Paper

ABSTRACT
A solar photovoltaic (SPV) system generating power to run a 53-m3 storage for indirect air-cooling combined with evaporating cooling (IAC+EC) for providing a cool environment for storage of tomatoes under small-scale farming was evaluated. The experiment consisted of nine 330 W solar modules, twelve 230 AH Gel batteries, 145 VDC solar charge controller, 5 kW inverter, 290 W ventilation fan, 260 W water pump, psychrometric unit, and a 3.8-ton tomato storage chamber constructed and assembled on site. The psychrometric unit consisted of three-cooling pad layers and a 1760 W indirect heat exchanger. The solar modules were arranged in three series-three strings and were used in conjunction with a three string-48V bank facility. The performance evaluation of the system was conducted with full recirculation of air inside the storage chamber using solar module yield and efficiencies of inverter, battery and charge controller. Based on the experiment data the SPV system produced 2873.5 W that is 98% of the design power output at 80% probability of exceedance. The power yield of 2873.5 W was 24% higher than the power required in running the electrical appliances for IAC+EC system. Tracking the SPV system under ambient conditions with an average daily generation during the period of the experiment, the electrical power efficiency was 14.9%. The power output of modules increased with temperature of the module to 24°C and declined thereafter. The power generated by the SPV system depended on the solar irradiance availability, ambient temperature at the site and the time of the day. It was found that the SPV system could power the IAC+EC during daytime for the summer season, and the excess power stored in the battery could run the system until 22.00 h at night when temperatures were low enough for storage of tomatoes and SPV system was then switched off.
Key words: Small-scale farming, design power, theoretical power, efficiencies, actual power.
INTRODUCTION
Most of the industrial energy requirements that include the cold chain for fruit and vegetables (FV) use non-renewable energy sources for power generation resulting in greenhouse gas emissions (Charf et al., 2018). Grid electrical energy is a convenient form of energy source but is expensive and in some instances impractical especially for remote, dispersed populations with low and scattered energy demands (Cecelski, 2000). Cooling for FV is required in such areas and technologies like mechanical refrigeration, hydro-cooling, forced air-cooling and vacuum cooling exists and are potentially viable options (Prusky, 2011). However, such methods are expensive to small-scale farmers (SSF) because of high initial capital investments, high-energy input, and higher production volumes for economies of scale (Yahaya and Akande, 2018). It is therefore, necessary for SSF in remote areas to access appropriate low cost, low energy cooling technology for FV with better eco-sustainable characteristics. This study then considers adoption of an indirect air-cooling system combined with evaporative cooling (IAC+EC) which can work both in hot and dry climates and hot and humid areas through incorporation of an indirect heat exchanger (IHE).
Tolesa and Workneh (2017) investigated the effect of IAC+EC on the quality of stored tomato fruit over a 30-day period compared to ambient conditions. The tomatoes stored under IAC+EC showed higher firmness and hue angle, maintained lower concentration of sugars, had lower physiological weight loss and improved shelf-life and marketability as compared to ambient conditions. Sibanda and Workneh (2020) tested the performance of such a system and it provided storage conditions of temperature of 15.7 to 16.4°C and relative humidity of 89.6 to 93.8%. Both studies provided the efficacy of the system except the energy requirements. Incorporation of an IHE requires energy input that grid electricity could provide. However, in remote off-grid areas, renewable energy sources like solar can be utilised through use of stand-alone or hybrid solar photovoltaic (SPV) systems as they generate power with less maintenance and operational costs (Khatib et al., 2016). The integration of IAC+EC with solar energy in sub-Saharan Africa (SSA) where the average solar radiation is 4.5 to 6.5 kWh.m-2 for 6 to 7 h a day can provide a cooling facility to SSF in areas with no access to grid electricity (Saxena et al., 2013). There is no information on energy requirements for such a system derived from actual performance data.
The sizing of stand-alone SPV systems depends on the efficiency of modules and other factors, such as ambient temperature, the quality and quantity of solar irradiance available in the location (Almarshoud, 2016). The efficiency of solar energy conversion depends on whether the module is monocrystalline, polycrystalline or thin-films type (Huang et al., 2013). Monocrystalline modules have the highest energy conversion efficiency; polycrystalline is in between, whilst thin-films are both least expensive and efficient in comparison (Bai et al., 2016). For solar arrays to produce maximum power output, they must be at an optimal tilt angle to trap maximum radiation (Tripathy et al., 2017). The optimal tilt angle depends on the season and the latitude of the area (Kaddoura et al., 2016). For higher power output, incorporation of solar trackers allows automatic adjusting of the collector tilt angle to follow the sun’s change in elevation during the day (Pedro et al., 2016). In this study for cost reduction purposes, the optimum tilt angle was determined from historical data as provided by Schulze et al. (1999). The aggregate sun-oriented radiation received at a given geographical location varies depending on the length of the insolation on a specific day, the power of sunlight-based vitality, and the day or time of the year (Safa et al., 2016; Tripathy et al., 2017).
There is limited literature on sizing SPV systems for cooling; however, there are several published papers on utilisation of solar energy for water pumping applications for irrigation. There are various methods for sizing the SPV array for water pumping, some are simple, others in between while others are complex. One such simple method considers the monthly average of daily solar insolation to determine the associated peak sun hours (Hankins, 2010). Almarshoud (2016) summarized other simpler methods from literature on practical methods for SPV array sizing based on the peak sun hours. Other research work used the monthly average of daily global solar radiation and sunshine hours to size the SPV array for each month of the year, and then selected the highest values to increase the reliability in low radiation months. There are methods that are not simple but in between in sizing the SPV system required to operate a water pump like use of monthly average solar radiation on tilted surfaces of the worst month of the year (Munzer et al., 2013). Some authors have used the worst monthly average of solar radiation in addition to the maximum monthly water demand for sizing (Abidin and Yesilata, 2004). In other instances, the worst daily collectable solar energy in addition to the system efficiency has been applied (Campana et al., 2013). Complex methods include development of simple algorithms based on the monthly average of global horizontal irradiance only, while more complex approaches use dynamic programming to size the SPV array based on the average of solar energy available per day, taking into account all relevant elements of SPV pumping system (Zvonimir and Margeta, 2007; Kaldellis et al., 2007). Eltawil and Samuel (2007) sized a vapour-compression refrigeration system for storage of potatoes by estimating the battery capacity, the average load energy and the ampere-hour required per day, from the load profile. Instead of using the peak rated power of the modules at standard operating conditions they used several complex multiple regression equations to predict the SPV panel power output and its temperature in addition to energy consumption.
This paper proposes a simple and accurate approach for sizing the SPV array using the actual power requirements of the electrical accessories. When an IAC+EC system starts operating accessories like the water pump and heat exchanger will draw high current so, the SPV array must be able to provide the required current. The proposed approach will, integrate the simple approaches mentioned earlier; use the solar radiation data measured in Pietermaritzburg (PMB) over 50 years by Schulze et al. (1999) and the actual solar radiation measured in this experiment for the month of June and September. The accurate sizing of the SPV array is essential, because under sizing will make the IAC+EC system unable to power the electrical accessories resulting in failure to provide optimum storage conditions for fresh produce. On the other hand, over sizing of SPV array leads to unnecessary cost incurred in acquisition of additional modules and batteries (Almarshoud, 2016). Specifically, this study will provide actual data on the performance of SPV in powering a 3.8-ton (53 m3) sized storage chamber for tomatoes. The main objective of this study is to design, assemble and evaluate the performance of SPV-battery based IAC+EC system.
MATERIALS AND METHODS
Experimental study
To determine the actual power requirements to operate an IAC+EC system, a case study for Pietermaritzburg, in South Africa was chosen. The IAC+EC system was used for cold storage of tomatoes over a period of 28 days in the summer month of September. The SPV system to power the IAC+EC system consisted of solar panels, solar charge controller and inverter, as well as a battery bank facility. This system was constructed and assembled on site at Ukulinga research station at the University of KwaZulu Natal, in PMB. The site is located at 30°24’S, 29°24’E at an altitude of 721 m. The SPV system and a battery bank facility provided electrical energy to the IHE, centrifugal pump and fans to facilitate airflow across the storage chamber of the IAC+EC.
Indirect air-cooling combined with evaporative cooling system set up
The IAC+EC consisted of a storage chamber, IHE, multiple charcoal cooling pads, buried water tank, a pump and two fans as shown in schematic diagram of Figure 1. The storage chamber had white double-jacket walls and a roof of 1 mm zintec (mild steel) both on the outside and inside. The floor was made of concrete mortar. The inner dimensions of the unit were 2340 mm high × 5880 mm long × 3880 mm wide giving a storage chamber volume of about 53-m3 with a holding capacity of 3.8 tonnes of tomatoes. The cooler had a 60 mm zinc wall thickness with 58 mm polyurethane insulation in between the zintec layers. The IAC+EC system design specifications provided environmental conditions of dry bulb temperature of 14 to 20°C, relative humidity of 89 to 94% and cooling efficiency of 88 to 96% depending on the time of the day.

Solar photovoltaic system set up
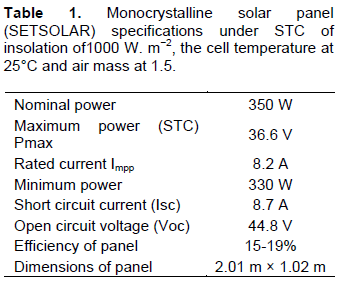
Nine solar panels were connected in three series-three strings arrangement in conjunction with a with a three-string series 48 V battery bank facility (batteries of 230 AH) were used to power the electrical appliances. The characteristics and dimensions of the modules are shown in Table 1 while Figure 2 shows the solar panels and battery connections.

The solar array system was designed to provide enough power to operate electrical appliances of the IAC+EC system. These included a 1730 W Lytron indirect heat exchanger (M14-120) with 33 W fan (OW354) to facilitate airflow across, a 290 W second fan (6/P3HL/25/PA) ventilating the storage chamber and 260 W centrifugal water pump (Pedrollo SPVm 55) to reticulate water through the cooling pads. From 08.00 to 17.00 h, the SPV system powered the electrical appliances and thereafter the system was powered by battery bank facility. The hybrid SPV system was optimized by considering the number and sizes of modules as well as batteries required and balancing that with the system voltage and current. A number of combinations were considered as recommended by Goel and Sharma (2017). From these permutations, a three-series-three-string connection was chosen as it gave the highest output of 3503.8 W and did not overload the available solar charge controller.
The battery capacity was determined with reference to the electrical appliances specifications for the daily watt-hours at 50% discharge using a 48-V system and the available battery in the market, which was a 230 AH with a 90% efficiency. The number of batteries required to operate the IAC+EC system with 3.8 tons of tomatoes was determined as twelve. The total load from the electrical appliances was determined as 2343 W and the allowable battery discharge was 28116 W and such a system would produce 4196.4 W. h-1 if the sunshine hours are 6.7 to cool 3.8 tons of tomatoes.
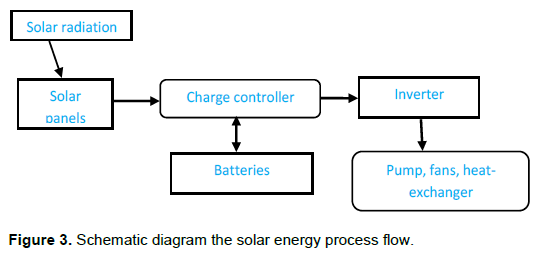
The solar modules were dusted and dirt removed from the surface following which they were installed away from trees and buildings on a fixed rectangular metal manual tilt-frame and mounted facing south on an inclined angle of tilt = -15° (Sun et al., 2016; Ronoh, 2017). In order to optimize solar radiation, the tilt angle varied at ±15° to the latitude of the area. In the design four different tilts: horizontal (0°) and tilt angle -14.6006, -29.6006 and 44.6006° were considered and from calculations the highest insolation was obtained at tilt angle of -14.60°. Therefore, a tilt angle of tilt = -15° was chosen to determine the optimal power and energy output. The DC power generated from the SPV modules was transmitted to the solar charge controller prior to charging the solar batteries and thereafter the inverter converted the generated DC power to AC power. Figure 3 is a schematic layout of the solar system and shows how the rest of the components were connected. The solar charge controller (60A, 145 VDC, SANTAKUPS PC16-6015F) ensured constant voltage and current to the load from the batteries according to Deveci et al. (2015). The chosen sinewave inverter (125A, 5 kW) matched the system in terms of voltage input, AC power output, frequency and voltage regulation (Chandel et al., 2015). Twelve fully charged 230 AH batteries, which were arranged as a three-string series 48V system, were used to start up the SPV system. These batteries also temporarily stored energy generated by solar panels for overnight use.
Determination of theoretical design power and energy
Monitoring solar radiation data for PMB took place during the year 2018. However, for this study, only data for June and September was used since PMB receives the least amount of solar radiation in June while September was the month of the experiment. Data recording occurred at the research site using South African Weather Services – Agricultural Research Council (SAWS-ARC) weather station based at the research site. The solar radiation data was used to determine the actual performance of the SPV system. The solar radiation values recorded by Schulze et al. (1999) over 50 years’ for PMB were extracted to obtain values for solar radiation received at 80% probability of exceedance at different tilt angles. These values were used to determine the theoretical power. The theoretical power represents the power available to run the electrical components of the IAC+EC system at the design stage. Equations 1 and 2 were used to determine the output power and energy based on the average theoretical design solar radiation for the two months at different tilt angles. The power output from Equation 1 was used to size the solar modules.

where Pout = average monthly power output (W), ηpanel = overall SPV module efficiency (=0.1522); Npanels = number of SPV modules, Apanel = area of the module, G = solar radiation (W.m-2).

where Eproduced = energy produce on a day length D1 (Wh. m−2) and D1 = average monthly day length (h).
The theoretical power out of the SPV is the input power of the solar charge controller. Equation 3 determines this power by incorporating the efficiency of the charge controller.

where Pout = power output from controller (W), Æžc = efficiency of the charge controller from the supplier (90%) and Pin = power input to the charge controller.
The output power from the charge controller is the input power to the inverter. The output power of the inverter was calculated by incorporating the efficiency of the inverter. The power output from Equation 4 should be higher than the power requirements of electrical appliances.

where Pout = power output from inverter (W); È I = efficiency of the inverter from the supplier (90%) and Pin = power input to the inverter.
Performance evaluation
Measurement of parameters
On the days of the experiment (1 to 30 September 2018), the solar modules supplied the energy requirements during the day from 08.00 to 17.00 h. Thereafter, the battery bank supplied energy until 22.00 h when the system was switched off until 08.00 h of the following day as ambient temperature had fallen between 18 and 20°C. Fresh produce like tomatoes can tolerate such ambient temperatures for a short time. Therefore, there was no need for further cooling overnight time as recommended by Punja et al. (2016). The solar irradiance and ambient temperature for the period of the experiment was obtained at SAWS-ARC weather station located at the Ukulinga Research Station in PMB. The values were used to determine solar irradiance power using equation 4. The other meteorological parameter data like the temperature of the solar panels was measured using an infrared thermometer with K thermocouple (Fluke 63). Thermocouples connected to data loggers measured the SPV module temperatures at hour intervals to determine the influence of module temperature on the performance of solar systems (Sun et al., 2016).
Measurement of module current and voltage at different points
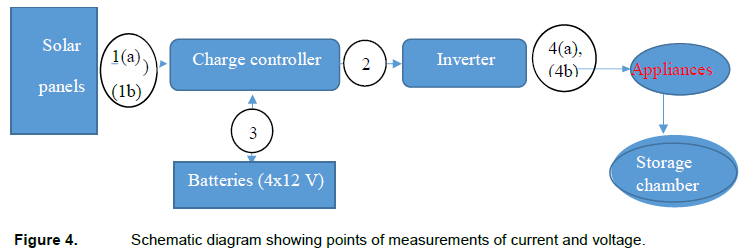
For the SPV electrical system, there were four positions (Figure 4) identified to evaluate the performance of the solar array system. A digital multi-meter (Fluke 381) measured both open circuit voltage and current under these different positions. Ohms law (Equation 5) was used to determine power:
 where V = voltage (v) and I = current (A).
The test procedures to be followed were:
(The power output tests were done by measuring both the voltage and current at different points and these values were used to calculate the power output using the Ohm’s Law.
The test procedures followed were:
(a) Measurements at position 1 of the system (exit point of solar panels [1a] and the input side of the solar charge controller [1b]). The voltage and current measured at this point were used to calculate solar modules power output and was compared with the theoretical calculation of the power output from the solar modules;
(b) Position 2 measures both voltage and current at the exit of the charge controller and the input of the inverter.
(c) Position 3 read voltage and current to and from the batteries, and
(d) Position 4a read current and voltage between the inverter and heat exchanger, pump and fans.
Measurements at this point provide how much power the appliances draw. Position 4b reads the current and the voltage drawn by electrical appliances.
RESULTS AND DISCUSSION
Theoretical power and energy
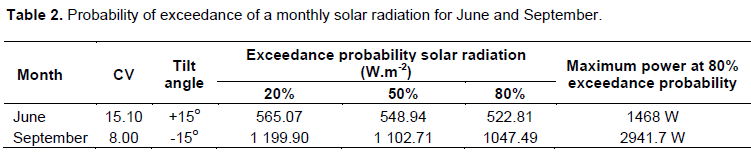
The performance of SPV systems depends on the tilt angle and orientation of the array. In studying the effect of insolation on modules a solar tracking device helps in adjusting the position of the solar panels so that the highest possible energy output obtains compared to a fixed SPV system. This necessitates that installations of the modules be at an optimal tilt angle that maximizes the solar radiation captured by SPV panels. Solar radiation data for PMB from Schulze et al. (1999) and from SAWS-ARC weather station was collated at tilt positions +15° for June and -15° September to determine probability of exceedance which information was used to calculate theoretical power and energy. It is important to base the design of a SPV system on a higher chance that the expected solar radiation will occur or exceeded in the given period and therefore a probability of exceedance is considered. The solar radiation data at 80% probability of exceedance at different tilt angles data for PMB was considered and only data for maximum theoretical output was extracted. Table 2 summarises the data of the probability of exceedance of monthly solar radiation for June and September. From Table 2 at 20% of the time in each month there was a higher radiation received in PMB than in 50 and 80% of the time. As the exceedance probability increased, the amount of radiation received decreased. Relatively lower percentages were recorded at high irradiance levels and the converse is true. The high irradiance levels, are associated with a direct beam component, that is spread more widely with very small individual frequency percentages. For the purpose of calculation, 80% exceedance probability was used, as the values are closer to reality as is possible. From Table 2, the average optimal solar radiation received at 80% probability of exceedance in PMB in June and September were 522.81 W.m-2 at tilt = +15° and 1047.49 W.m-2 at tilt = -15°, respectively. The optimal power for the months of June and September in PMB are 1468 and 2 941.7 W, respectively and from Equation 2, this translated to optimum energy output of 628.5 and 1068.1 Wh. m−2 for the two months, respectively.
The theoretical power and energy were low in June because solar insolation levels were low. To generate adequate energy under such circumstances would require more solar modules and this would increase the cost of installation. The sizing of stand-alone SPV considers meeting electrical loads requirements with lowest average daily solar insolation on the array surface, which usually occur during winter months. However, the temperatures are also generally low in winter (June), and the maximum temperatures are 16 to 20°C in PMB. Under such conditions for tomatoes and many tropical and sub-tropical FV in SSA, either no cooling or minimal cooling will be required during short periods as alluded to by Punja et al. (2016). To ensure optimization of the solar insolation, a switch could be incorporated to the system coupling the electrical load (pump, fans and heat exchanger) to the SPV array system. This will allow the SPV system to switch off when the battery bank facility is fully charged. Optimising the system is important, as the costs of installation are reduced to ensure the IAC+EC systems translate to a low cost cooling technology (Chandel et al., 2015; Goel and Sharma, 2017).
The theoretical power output for the month of September is very significant for design as this month is the beginning of summer and higher solar radiation is received in subsequent months until April of the following year when temperatures begin to fall. In subsequent months, the theoretical power output is higher as the area receives more solar irradiation and this coincides with higher cooling loads as the ambient temperature is also relatively higher. This is the reason why most of the large-scale SPV systems are built in arid and semi-arid areas, where the solar insolation levels are high (Sayyah et al., 2014). However, caution has to be taken as high ambient temperature affects performance of the SPV system due to high cell temperature (Ronoh, 2017).
From Equation 3, the theoretical output power from the charge controller was:

in September. From Equation 4, the optimum output power of the inverter is 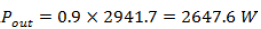 in September. This means that the theoretical power available to run the electrical components at 80% probability of exceedance in September in PMB was 2382.8 W.
Variation of insolation with ambient temperature
Ambient air temperature and solar radiation outside the IAC+EC system around the SPV system was studied in the month of September 2018. It was observed that ambient temperatures and solar irradiance were low in the morning and increased from 08.00 h to between 12.00 to 14.00 h and thereafter decreased towards 18.00 h (Figure 5). Ambient temperature increased due to increasing incident solar radiation from morning until afternoon 13.00 to 14.00 h and then decreased from then onwards towards sunset as also confirmed by Madhava et al. (2017). The average insolation values rose from 293.4 W.m-2 at 08.00 h in the morning to 1 059.6 W.m-2 at mid-day. Eltawil and Samuel (2007) observed a similar trend. At any location like PMB, the length of the path the radiation takes from source to ground level varies with time of the day as the spectrum of the radiation changes through each day because of the changing absorption and scattering path length (Ronoh, 2017). Figure 5 relates to data obtained on clear days of September where the solar insolation increased from early morning to a peak at midday and then decreases to zero at night. The peak is achieved at midday as the sun is overhead and its path length is shortened. At midday, less solar radiation is scattered or absorbed by atmospheric mediums, and more radiation that is direct reaches the modules compared to any other time of the day and Olomiyesan et al. (2015) complements these results. The highest average solar irradiance received in September 2018 of 1 059.6 W.m-2 was slightly higher than the average value of 1 047.9 W.m-2 received over 50 years at 80% exceedance for the same month. This implies that the average insolation received in this month should produce enough power and energy for the designed electrical appliances.
Solar photovoltaic module power and solar irradiance power
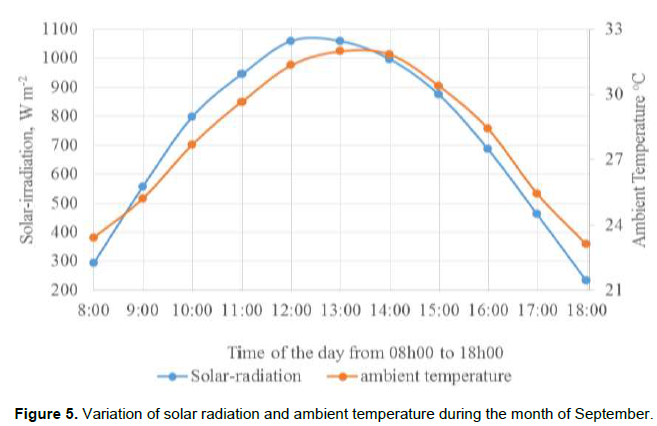
The SPV module power (Pmodule) and solar irradiance power (Pirridiance) were studied in the month of September on clear and, sunny days selected (11 days) for the experiment. The Pmodule was obtained by measuring voltage and current between the solar modules and solar charge controller while the Pirridance values were obtained by converting solar irradiance values in Figure 5 to power by using Equation 1. Figure 6 shows the variation of Pmodule (W) and the Pirridance (W) during the period of study from 08.00 to 18.00 h. The Pmodule increased with the Pirridance to a peak between 12.00 and 14.00 h and decreased thereafter as the solar radiation intensity decreased. The results from the present study agree with findings of Charfi et al. (2018) in Tunisia who obtained similar trends. The Pirridance received and Pmodule output had very similar trends with the maximum and minimum values at the same hours during the period of the experiment. This shows that the amount of electricity generated by SPV system is largely depended on the availability of the solar energy at a particular location as corroborated by Li et al. (2005) and Chaabane et al. (2019). The design power which is the maximum average solar power received in PMB over 50 years in the month of September at 80% probability of exceedance is 2941.9 W (Table 2) while the peak Pirridance in the month of September 2018 was 2975.4 W (Figure 6). Therefore, Pirridance was just 1% higher the design power. This shows the importance of basing the design on higher percentage of probability of exceedance.
The peak Pmodule was 2 873.5 W, which was about 3.5% lower than the peak Pirridance of 2975.4 W during the period of the experiment. The difference between the Pmodule and the Pirridance is attributable to the efficiency of the SPV system that peaks at 14.9% (Figure 8) which value was lower than the rated solar panel efficiency of 15 to 19%. The other contributors are environmental factors including module temperature, soiling material accumulating on the module surfaces, resistance in the wiring and connections and in some instances, modules of the same type have slight differences in electrical characteristics. Ghazi et al. (2014) mentioned that solar modules need regular cleaning as soiling is regarded as one of the significant contributors to reduction of the power output of SPV systems as it reduces the solar radiation reaching the surface of modules. When modules are soiled, the dust particles deposited on the surface absorb and scatter the incoming incident light and this might have contributed to the reduction of the Pmodule value (Sayyah et al., 2014). The peak Pmodule of 2873.5 W was 24% higher the design load for electrical appliances of 2343 W. However, it is important to note that the efficiencies of the controller and inverter could account for 24% more power generated by the modules.
Solar photovoltaic module parameters and ambient temperatures
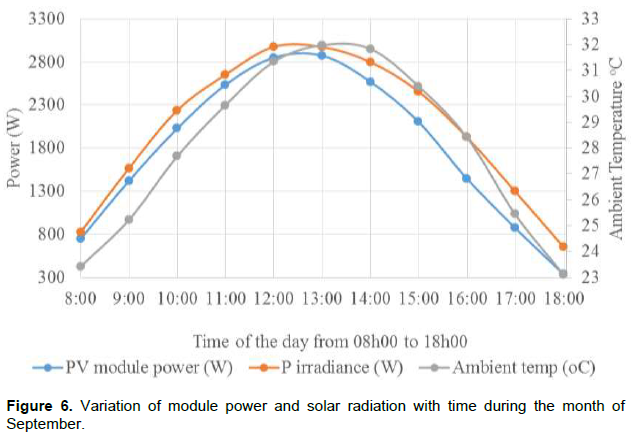
The Pmodule output and module temperature increased with ambient temperature to about 32°C (Figure 7), which coincided with the highest ambient temperature at midday. The maximum Pmodule output occurred at 31 to 32°C ambient temperature (Figure 6) and the system was most efficient at this period (Figure 8). Thereafter both power output and ambient temperature declined after midday as shown in Figure 5. Ya’acob et al. (2014) made similar observations in Malaysia where they had the highest generated power data at midday with ambient temperature at 32.5 to 34.5°C. The Pmodule output increased as short circuit current increased with insolation due to the increase in the number of photons generating the current. Increased solar panel temperature also increases the kinetic energy of the photons resulting in increased current and module output. Figure 7 shows that Pmodule increased with module temperature until 25°C and decreased thereafter.

This corroborates the work done by Bai et al. (2016) and Chaabane et al. (2019) which showed that though solar panels are designed to operate in the presence of the sun, high heat reduce panels’ capacity to generate power. The increased SPV module temperature arose from high insolation heating and high ambient temperature. When the module surface temperature increases beyond a certain level, the atoms in the material vibrate resulting in a reduction in the conductance of the electron traveling through the electrical component (Olcan, 2015). Many standard grade solar panels have 0.5 to 1% less photoelectric conversion efficiency for every 1°C SPV module temperature increase above 25°C (Rawat and Kumar 2013; Bai et al., 2016).
In Figure 8, it is clearly visible that the electrical efficiency increased up to noon due to the positive effect of the solar cells temperature during this period of the day and the converse is true beyond midday. It is noted that the efficiency of the system was below the 15 to 19% given by the manufacturer, and Ya’acobs et al. (2014) explain that efficiency will vary once modules are bundled in series or parallel and under different climatic characteristics from those the manufacturer tested under. According to Rawat and Kumar (2013), high incident radiation increases the surface temperature of solar cells and that in turn decreases the photoelectric conversion efficiency of cells.
Performance of the solar photovoltaic system
The peak Pmodule of 2873.5 W translated to 5146.6 W.h-1 actual energy produced by the solar modules. This was the actual produced and stored by batteries in order to cool the 3.8 tons of tomatoes from 17.00 to 22.00 h. Therefore, to cool one ton of tomatoes, using IAC+EC system requires 1354.4 W.h-1. This value is comparable to the value of 700 W.h-1 for forced air evaporative cooling of tropical FV using a 0.1 HP fan mentioned by Kitinoja and Thompson (2010). The difference in power requirements can be attributable to the additional IHE and water pump incorporated in this study. The power requirements for the solar powered IAC+EC system were low when compared with hydro-cooling (immersion type) to 0 to 2°C or hydro-cooling (shower type) to 7°C where the energy required to cool 1 metric tonne of produce is 35 to 150 kWh.
Solar energy is one of the major sources of renewable energies available in SSA and SPV are currently utilised in many agricultural applications. For this study the SPV system of 9 modules (3-series 3 string) of 330 W each and a 48-V battery bank of 3-strings 230 AH batteries was able to supply the appliances with the needed electrical power and provided sufficient energy to charge the battery bank. Non-passive evaporative cooling can be viewed as a cooling technology with low initial investment and installations costs as a system of 1 to 2 MT can be constructed for US$1,300 at an energy use per MT of 0.7 kWh (Kitinoja and Thompson, 2010). However, the cost of a solar-powered 3.8 tons IAC+EC system requiring about 4.7 kW of energy input is as high as US$7500 with solar power system alone costing at least 80% of the total (Sibanda, 2019). The costs of an IAC+EC system compares well with a small-scale mechanical refrigeration system with a storage capacity of 2 tons that requires about 7 kW of electricity and has a slightly high cost of US$8,500 (Kitinoja and Thompson, 2010). Therefore, optimal sizing of SPV systems in order to supply load demand is important because of high capital investment costs of solar energy powered IAC+EC systems.
Performance evaluation of the electrical components of the design
There were four major tests to evaluate the performance and assess the electrical components of the design for the 3-string 3-series solar module system and three-string 48 V battery system. Table 3 provides the values of the current and voltage measured at difference locations in Figure 3. Equation 5 (Ohm’s law) was used to determine the power input/out at the different locations.

The current and voltage measured at the exit point of the solar modules and at the entrance point of the solar charge controller were used to determine the percentage voltage drop through the SPV cables as follows:


This practical voltage drop as calculated provides reasonable efficiency of operation occurrence as the voltage drop is less than 3% as defined by Early et al. (2014).
Table 3 shows that the power from modules into the charge controller was 2851.9 W and that the average current and voltage supplied by the solar to the batteries were 20.16 A and 127.3 Vdc, respectively. Therefore, the battery bank facility had enough power to start up the SPV system and to operate the IAC+EC system from 17.00 to 22.00 h at evening to nighttime. The input power to the converter was 2624.1 W which was converted from DC to AC. The AC current and voltage measured at position 4 between the inverter and the load was 18.43 AAC and 205 VAC providing a DC power of 2403.3 W. Therefore, the power supplied by the invertor is enough to run the electrical appliances that include the heat exchanger, water pump and two fans.
Efficiencies of the designed system
The solar panel efficiency is calculated from the relationship between current and the voltage measured between the solar panels or batteries and the charge controller and theoretical power output of the solar panels. The current and voltage drawn by the load from the batteries through the inverter were 22.3 Adc and 129.3 Vdc giving a DC power of 2883.4 W (Table 3).
The efficiency of the solar panels was 14.7% as solar cells have a threshold photon energy corresponding to the particular energy band gap below which electricity conversion does not take place. Photons of longer wavelength do not generate electron-hole pairs but only dissipate their energy as heat in the cell. However, most common SPV module converts 4 to 17% of the incoming solar radiation into electricity as explained by Chow (2010). The reasons an efficiency less than 15% was obtained could be that solar modules work best when module temperatures is below 25°C. Higher ambient temperatures of about 32°C increase the module temperature and that could cause a slight increase in the electrical current as the semiconductor properties of solar cells shift, resulting in a much larger decrease in voltage as alluded to by Bai et al. (2016). Some solar panels may produce as much as 1% less electricity for every -9.44°C temperature above 25°C. The other reason why there is a variation could be that the peak annual accumulated output is calculated using the SPV module efficiency under a reference sunlight of irradiance 1 000 W.m-2 with a solar cell temperature of 25°C. In reality, solar radiation at a location varies with the weather conditions; season and time of day, as a result the technical information provided for STC might not occur in practice.
CONCLUSION
The use of SPV systems is increasing as installations costs are decreasing and the application is finding expression in remote and isolated communities and in new farming setting ups of SSF with no access to cooling facilities. Electricity supply is of great concern, as it is inadequate and in SSA, connection to the national grid for most SSF seems highly unlikely in the near future. This has turned interest to renewable energy sources like solar as a means of bridging the energy gap and providing environmentally friendly energy. In this study, a SPV system IAC+EC was evaluated based on actual performance. Furthermore, this experiment explored the possibility of integrating solar energy to power IAC+EC system targeting SSF in remote areas with no access to grid electricity.
Most of the literature does not give actual values of energy required by different cooling systems, but merely states which cooling systems are more energy intensive than others are. Energy required to operate modern cooling systems are greater than the energy required to operate IAC+EC system. The SPV systems used in the study supplied energy during the critical period of the day when temperatures were high from 08.00 to 22.00 h. To cool one ton of tomatoes using IAC+EC requires 1354.4 W. h-1 and the batteries had to store 5146.6 W. h-1 to provide energy for the 3.8-ton storage chamber to cool tomatoes from 17.00 to 22.00 h when the IAC+EC system was switched off. The efficiency of the solar panels was 14.7%. The energy to power an IAC+EC system relates to the size of the solar array system required to provide the energy and the cost of the system. The study concludes that combinations of the solar array system can power the cooling system at daytime during summer season and the excess energy can be stored in the battery to run the system for another five hours into the night. A bigger system is required to run all-night and in the near future, this will be possible, as the prices of modules continue to decline.
Therefore, where grid electricity or other commercial energy sources are unavailable and solar energy is available, IAC+EC system is a viable alternative to these more complex and costly modern day cooling systems. This shows that stand alone SPV systems have an expression in rural, dispersed and remote areas where grid electricity supply may not be readily accessible. Integrated solar and indirect evaporative cooling is an attractive alternative for SSF with no access to cooling technologies in developing countries, especially in Africa.
CONFLICT OF INTERESTS
The authors have not declared any conflict of interests.
ACKNOWLEDGEMENT
The authors are grateful to the Agricultural Research Council for funding and University of KwaZulu Natal, School of Engineering in Pietermaritzburg for allowing the research team to review the work done on evaporative cooling at the university research farm.
REFERENCES
|
Abidin FZ, Yesilata B (2004). New approaches on the optimization of directly coupled solar photovoltaic pumping systems. Solar Energy 77:81-93. |
|
|
Almarshoud A (2016). Sizing of SPV array for water pumping application. Paper presented at Conference: 32nd European photovoltaic solar energy conference and exhibition, at Munich, Germany, 30 May to 3 June 2016. |
|
|
Bai A, Popp J, Balogh P, Gabnai Z, Pályi B, Farkas I, Pintér G, Zsiborács H (2016). Technical and economic effects of cooling of monocrystalline photovoltaic modules under Hungarian conditions. Renewable and Sustainable Energy Review 60:1086-1099. |
|
|
Campana PE, Li H, Yan, J (2013). Dynamic modelling of a solar photovoltaic pumping system with special consideration on water demand. Applied Energy 112:635-645. |
|
|
Cecelski E (2000). Enabling equitable access to rural electrification: current thinking and major activities in energy, poverty and gender. Briefing Paper. Alternative Energy Policy and Project Development Support in Asia: Emphasis on Poverty Alleviation and Women, Asia Alternative Energy Unit, the World Bank, Washington DC. |
|
|
Chaabane M, Charfi W, Mhiri H, Bournot P (2019). Performance evaluation of solar photovoltaic systems. International Journal of Green Energy 16(14):1295-1303. |
|
|
Charfi W, Chaabane M, Mhiri H, Bournot P (2018). Performance evaluation of a solar photovoltaic system. Energy Reports 4:400-406. |
|
|
Chandel SS, Nagaraju NM, Chandel R (2015). Review of solar photovoltaic water pumping system technology for irrigation and community drinking water supplies. Renewable and Sustainable Energy Reviews 49:1084-1099. |
|
|
Chow TT (2010). A review on photovoltaic/thermal hybrid solar technology. Applied Energy 87:365-379. |
|
|
Deveci O, Onkol M, Unver HO, Ozturk Z (2015). Design and development of a low-cost solar powered drip irrigation system using Systems Modelling Language. Journal of Cleaner Production 102:529-544. |
|
|
Early MW, Coache CD, Monzi G (2014). National electrical code hand book. ISBN 9781455905447. |
|
|
Eltawil MA, Samuel DVK (2007). Performance and economic evaluation of solar photovoltaic powered cooling system for potato storage. Agricultural Engineering International: CIGR Journal, Manuscript EE 07 008. Vol. IX. |
|
|
Ghazi S, Sayigh A, Ip K (2014). Dust effect on flat surfaces - A review paper. Renewable and Sustainable Energy Reviews 33:742-751. |
|
|
Goel S, Sharma R (2017). Performance evaluation of standalone, grid connected and hybrid renewable energy systems for rural application: A comparative review. Renewable and Sustainable Energy Reviews 78:1378-1389. |
|
|
Hankins M (2010). Stand-alone solar electric systems. The earthscan expert handbook for planning, design, and installation. Built Environment 248pp. |
|
|
Huang BJ, Huang YC, Chen GY, Hsu, PC, Li K (2013). Improving solar photovoltaic system efficiency using one-axis 3-position sun tracking. Energy Procedia 33:280-287. |
|
|
Kaddoura TO, Ramli MAM, Al-Turkib YA (2016). On the estimation of the optimum tilt angle of solar photovoltaic panel in Saudi Arabia. Renewable and Sustainable Energy Reviews 65:626-634. |
|
|
Kaldellis JK, Spyropoulos GC, Kavadias KA, Koronaki IP (2007). Experimental validation of autonomous SPV-based water pumping system optimum sizing. Renewable Energy 34:1106-1113. |
|
|
Khatib T, Ibrahim IA, Mohamed A (2016). A review on sizing methodology of photo-voltaic array and storage battery in stand-alone photovoltaic system. Energy Conversion and Management 120:430-448. |
|
|
Kitinoja L, Thompson JF (2010). Pre-cooling systems for small-scale producers. Stewart Postharvest Review. |
|
|
Li DHW, Cheung GHW, Lam JC (2005). Analysis of the operational performance and efficiency characteristic for photovoltaic system in Hong Kong. Energy Conversion and Management 46:1107-1118. |
|
|
Madhava M, Kumar S, Rao DB, Smith DD, Kumar, HVH (2017). Performance evaluation of photovoltaic hybrid greenhouse dryer under no-load condition. International Agricultural Engineering Journal CIGR 19(2):93-101. |
|
|
Munzer SY, Ebaid Qandil H, Hammad M (2013). A uniï¬ed approach for designing a photovoltaic solar system for the underground water pumping well-34 at Disi aquifer. Energy Conversion Management 75:780-795 |
|
|
Olcan C (2015). Multi-objective analytical model for optimal sizing of stand-alone photovoltaic water pumping systems. Energy Conversion and Management 23:358-369. |
|
|
Olomiyesan BM, Oyedum OD, Ugwuoke PE, Ezenwora JA, Ibrahim AG (2015). Solar energy for power generation: A review of solar radiation measurement processes and global solar radiation modelling techniques. Nigerian Journal of Solar Energy 26:1-8. |
|
|
Pedro MLPM, João FAM, António LMJ (2016). Comparative analysis of overheating prevention and stagnation handling measures for photovoltaic-thermal (SPV-T) systems. Energy Procedia 91:346-355. |
|
|
Prusky D (2011). Reduction of the incidence of postharvest quality losses, and future prospects. Food Security 3(4):463-474. |
|
|
Punja ZK, Rodriguez G, Tirajoh A (2016). Effects of bacillus subtilis strain QST 713 and storage temperatures on post-harvest disease development on greenhouse tomatoes. Crop Protection 84:98-104. |
|
|
Rawat P, Kumar P (2013). Performance evaluation of solar photovoltaic / Thermal (SPV/T) System. International Journal of Science and Research 4(8):1466-1471. |
|
|
Ronoh EK (2017). Prediction of total solar irradiance on tilted greenhouse surfaces. Agricultural Engineering International: CIGR Journal 19(1):114-121. |
|
|
Safa S, Abdessalem B, Salwa B, Salah SMB, Sassi BN (2016). Design and construction of sun tracking systems for solar parabolic concentrator displacement. Renewable and Sustainable Energy Reviews 60:1419-1429. |
|
|
Sayyah A, Horenstein MN, Mazumder MK (2014). Energy yield loss caused by dust deposition on photovoltaic panels. Solar Energy 107:576-604. |
|
|
Saxena A, Agarwal N, Srivastava G (2013). Design and Performance of solar air heater with long term heat storage. International Journal of Heat and Mass Transfer 60:8-16. |
|
|
Schulze RE, Maharaj M, Lynch SD, Howe BJ, Melvil-Thomson (1999). South African Atlas of Agrohydrology and Climatology. School of Bioresources Engineering and Environmental Hydrology University of Natal, Pietermaritzburg, South Africa. |
|
|
Sibanda S (2019). Development of a solar powered indirect air-cooling combined with direct evaporative cooling system for storage of horticultural crops in hot and humid areas. PhD Thesis; University of KwaZulu Natal, Pietermaritzburg, South Africa. |
|
|
Sibanda S, Workneh TS (2020). Performance of indirect air-cooling combined with direct evaporative cooling for fresh produce. Heliyon Journal 6(1):E03286. |
|
|
Sun LL, Li M, Yuan YP, Cao XL, Lei B, Yu NY (2016). Effect of tilt angle and connection mode of SPVT modules on the energy efficiency of a hot water system for high-rise residential buildings. Renewable Energy 93:291-301. |
|
|
Tolesa GN, Workneh TS (2017). Influence of storage environment, maturity stage and pre-storage disinfection treatments on tomato fruit quality during winter in KwaZulu-Natal, South Africa. Journal of Food Science and Technology 54(10):3230-3242. |
|
|
Tripathy M, Yadav S, Sadhu PK, Panda SK (2017). Determination of optimum tilt angle and accurate insolation of BISPV panel influenced by adverse effect of shadow. Renewable Energy 104:211-223. |
|
|
Ya'acob ME, Hizam H, Khatib T, Radzi MAM (2014). A comparative study of three types of grid connected photovoltaic systems based on actual performance. Energy Conversion and Management 78:8-13. |
|
|
Yahaya S, Akande K (2018). Development and performance evaluation of pot-in-pot cooling device for Ilorin and its environ. Journal of Research Information in Civil Engineering 15(1):2045-2059 |
|
|
Zvonimir G, Margeta J (2007). A model for optimal sizing of photovoltaic irrigation water pumping systems. Solar Energy 81:904-916. |
|
Copyright © 2024 Author(s) retain the copyright of this article.
This article is published under the terms of the Creative Commons Attribution License 4.0


