ABSTRACT
The effects of plant density on yield and yield components in upland rice cultivation were examined by conducting a series of field experiments in Central Uganda, using three African and one Japanese improved upland rice varieties. The estimation of plant-density response functions with respect to yield components and yield revealed that an increase in plant density significantly decreased the number of panicles per hill, number of spikelets per panicle, and 1000-grain weight, and significantly increased the number of panicles per square meter. The percentage of filled grain was not affected by plant density. Compared to the Japanese variety, the three African varieties were characterized by more numbers of panicles/hill, less numbers of spikelets/panicle, higher grain-filling ratio and lighter 1000-grain weight, but differences in the degrees of response to plant density were less distinct between them. Rice yield increased in the range of plant density tested, though the marginal increase in yield due to an increase in plant density by 1 hill/m2 diminished from 100 kg/ha at the plant density of 11 hills/m2 to 30 kg/ha at 33 hills/m2. No significant differences were found among the four varieties for the level of yield as well as for its degree of positive response to plant density. The yield components that determined the increase in yield were the number of panicles per square meter and the number of spikelets per panicle, or combined together, the number of spikelets per square meter, which was estimated to reach the maximum at the plant density of 35 hills/m2. When the differences among the treatments in the costs of seeds and weed-control were considered, the optimum plant density was found to be 22 hills/m2 (plant-spacing of 30 cm × 15 cm), lower than the plant density that gives the maximum yield.
Key words: Economic optimum, maximum yield, NERICA, plant-density response function, yield components.
Rice is a crop of importance in sub-Saharan Africa (SSA), the demand for which has been increasing most rapidly among major staple crops in the region (Seck et al., 2013). As the demand has largely been satisfied by increasing rice import from outside the region, SSA’s self-sufficiency in rice has been declining. In order to enhance food security, it is imperative for SSA countries to increase domestic rice production. Since rice production in SSA is mostly dependent on rainfed upland ecosystems (Rodenburg et al., 2014; Saito et al., 2015), the future of rice production in SSA critically depends on the development of upland rice cultivation. The advent at the turn of the century of NERICA (New Rice for Africa), a series of upland rice varieties that are the interspecific progenies of Oryza glaberrima and O. sativa developed by the Africa Rice Center (AfricaRice, then WARDA) (Jones et al., 1997), coupled with national as well as international efforts toward the development of rice production in SSA (AGRA/JICA, 2008), has helped to develop adapted upland varieties and promote upland rice cultivation in SSA.
There are, however, technical challenges to be addressed for the wider diffusion of upland rice cultivation in SSA, many of which stem from the fact that rice is relatively new, exotic, and unfamiliar crop for upland farmers in many parts of the region, particularly in East Africa, except for Madagascar (Badawi et al., 2010). The optimum plant density in upland rice production and crop management is an example of such challenges. In monsoon Asia, the effects of plant density in lowland rice cultivation have been relatively well studied (Kondo, 1944; Yamada et al., 1960; Yoshida and Parao, 1972; Akita, 1982a, b; Patel, 1999; Hossain et al., 2003; Hayashi et al., 2006; Gendua et al., 2009; Roshan et al., 2011; Huang et al., 2013), but less effort has been devoted to optimal plant population for upland rice production (Kawatei et al., 1966; Lampayan et al., 2010; Chauhan and Johnson, 2011; Clerget et al., 2016). In SSA, Oyedokun (1977), Oyedokun and Sobulo (1977), Yamaguchi (1982), Akobundu and Ahissou (1985), Oikeh et al. (2009), and Oghalo (2011) studied the effects of plant density in upland rice cultivation in West Africa, but no substantial efforts have been made to study on the effects of plant density and/or plant population in East Africa, except for NaCRRI (2010) that gives recommendations for upland rice plant spacing without published data.
The objective of this paper is to search the optimum plant density / plant spacing for upland rice in an East African environment. Since high plant density could suppress weed growth, many past studies on plant density investigated it in relation to weed infestation (Kawatei et al., 1966; Akobundu and Ahissou, 1985, Hossain et al., 2003; Chauhan and Johnson, 2011). This paper looks for the optimum plant density under the standard crop management situation that is usually kept weed-free while considering the cost of weeding.
Experiment
Field experiments were conducted in the 1st- and 2nd-seasons of 2012 and the 1st-season of 2013, at the experimental farm of the National Crops Resources Research Institute (NaCRRI) in Namulonge, Central Uganda (latitude 00°30’ 46.4N, longitude 32°38’ 03.6E, altitude 1120 m above sea level). An upland field in the farm was divided into experimental plots, 6 m × 3.9 m each, laid out in randomized-block design with three replications.
For plant density, three treatments, 16.7 hills/m2 (the spacing of 40 cm × 15 cm), 22.2 hills/m2 (30 cm × 15 cm), and 33.3 hills/m2 (20 cm × 15 cm), were adopted in the 1st- and 2nd- seasons of 2012, and four treatments, 11.1 hills/m2 (60 cm × 15 cm), 13.3 hills/m2 (50 cm × 15 cm), 16.7 hills/m2, and 22.2 hills/m2, were adopted in the 1st-season of 2013. For each hill, 11 seeds were dibbled at the sowing depth of 3 cm and, after germination, thinned to five plants per hill.
Four upland varieties, NERICA 4 (O. sativa / O. glaberrima // O. sativa; henceforth denoted as N4), NERICA 10 (O. sativa / O. glaberrima // O. sativa; N10), ITA 325 (O. sativa L. ssp. Javanica, known in Uganda as NARIC 2; ITA325), and Yumenohatamochi (O. sativa L. ssp. japonica; Yume), were used. For fertilizer, N-P-K were applied three weeks after sowing at a rate of 60-30-30 kg/ha as basal fertilizers and 30 kg/ha of N was applied at the 50 days after sowing (DAS) as additional fertilizer. The field was not irrigated but standard agronomic practices were followed under rainfed conditions. Weeds, whenever emerged, were pulled out to keep the plots weed free. Data were collected on the number of panicles per hill (denoted henceforth as panicles/hill), the number of spikelets per panicle (spikelets/panicle), the percentage rate of filled grain per panicle (grain-filling rate), 1000-grain weight and yield. The number of panicles per square meter (panicles/m2) was obtained by multiplying the number of hills per square meter to panicles/hill. The grain weight was adjusted to a moisture content of 14% fresh weight. In addition, the intensity of labor that was needed to keep the experimental plots weed-free was monitored. The dates of sowing and harvesting were April 2 and August 1 in the 2012 1st-season, September 29 and January 16 in the 2012 2nd-season, and March 6 and July 1 in the 2013 1st-season, respectively.
The total rainfall and its within-season distribution differed among the three study seasons. The 2012 2nd-season recorded the total rainfall of 800 mm with a relatively better within-season distribution. The total rainfall of the 2013 1st-searon was 650 mm, but about 90% of it fell during the first half of the season, leaving only a little rainfall during the critical period of anthesis from 70 to 90 DAS. The total rainfall of the 2012 1st-seaon was only about 400 mm, but the fields received more rain during the 70 to 90 DAS period than the 2013 1st-season.
Data analysis
Multiple regression model
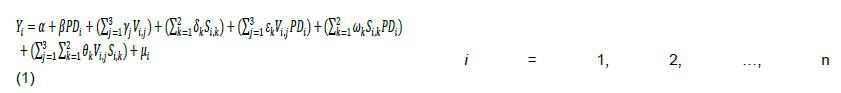
The effects of plant density on yield components and yield were analyzed quantitatively by estimating the following multiple regression model for each of them:
where Y is the variable to be explained, that is, panicles/hill, panicles/m2, spikelets/panicle, filled-grain ratio (%), 1000-grain weight (g), or yield (t/ha), PD is plant density (the number of hills /m2), V’s are dummy variables for varieties, S’s are dummy variables for seasons, μ is random error, i stands for observation, n is the total number of observations (N = 120), j stands for variety (1 = N4, 2 = N10, and 3 = ITA325), k stands for season (1 = the 2012 1st-season and 2 = the 2013 1st-season), and a,b,g,d,e,w and q are regression parameters to be estimated.
The response of yield components and yield to plant density could be non-linear (Akita, 1982a, b; Yoshida, 1981). In the estimation of Equation 1, three functional forms, linear, semi-log linear, and quadratic, are tried out for each of yield components and yield, and the best fitting form was selected. Depending on the functional form adopted, Equation 1 should be read accordingly. For example, in the case of the quadratic form, Equation 1 is read as including PD2, in addition to PD.
The dummy variables for varieties and seasons were introduced to control the variations due to variety and season. For variety dummy, Yume was set as the base variety for comparison. Similarly, for season dummy, the 2012 2nd-season was set as the base season. The regression coefficients of the linear term, g(d)ï€¬ï€ for the varieties (seasons) account for the differences in the intercept tern between the varieties (seasons) and the regression coefficients of interaction terms between varieties (seasons) and plant density, e(w) account for the differences in the slope between varieties (seasons). Note that Equation 1 is parallel to the ANOVA model with plant density, variety, season as the experimental factors, except that plant density is treated as a continuous variable. In the estimation of Equation 1, all explanatory variables were ‘centered’ by converting all observations to mean deviations in order to avoid multi-collinearity (Aiken and West, 1991).
Economic performance
A difference in plant density results in differences in the required amount of seeds per unit of planted area and the required intensity of weeding. In order to search the optimum plant density for farmers, the profit for each plant-density treatment was estimated as follows:
Ri = (Yield)i × Py
Ci = [(Seed)i × Ps] + [(Weeding Labor)i × Pw]
pi = Ri - Ci
where i (= 1, 2, … , 5) stands for the plant-density treatment, R is revenue, C is cost, p is profit, Yield is rice yield by treatment, Seed is the quantity of seeds sown by treatment, Weeding labor is labor input required for weeding by treatment, Py is the paddy price, Ps is the seed price, and Pw is the wage rate.
The effects of plant density
Preliminary analyses
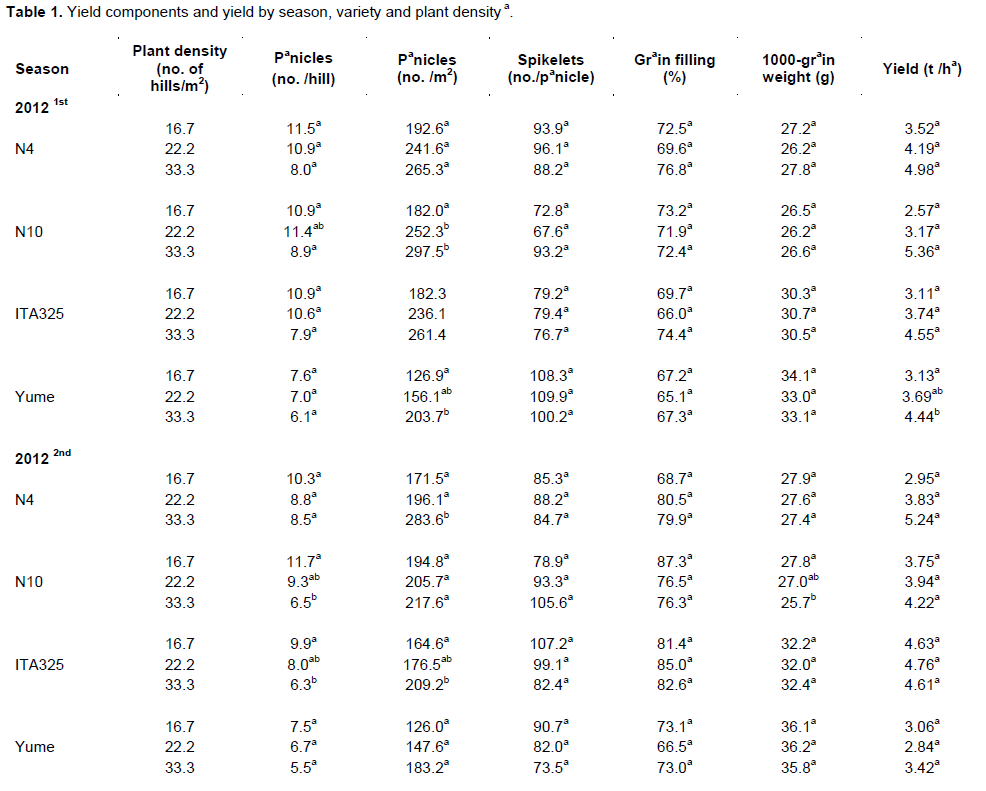
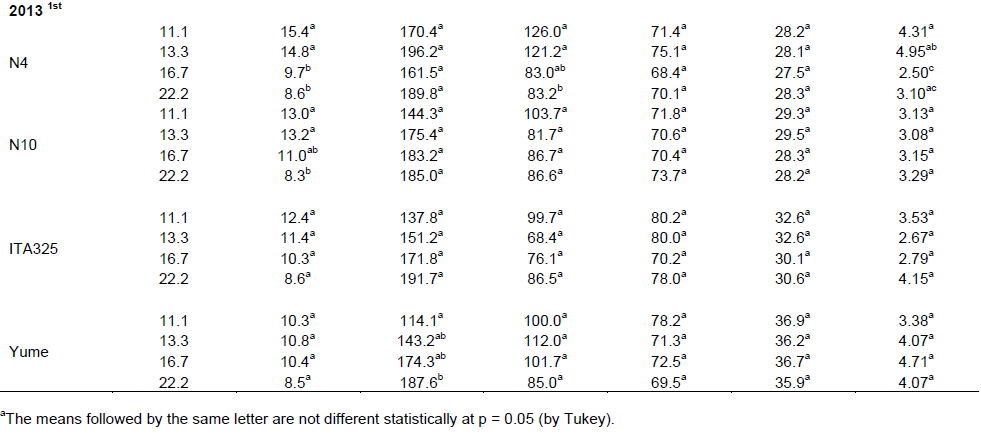
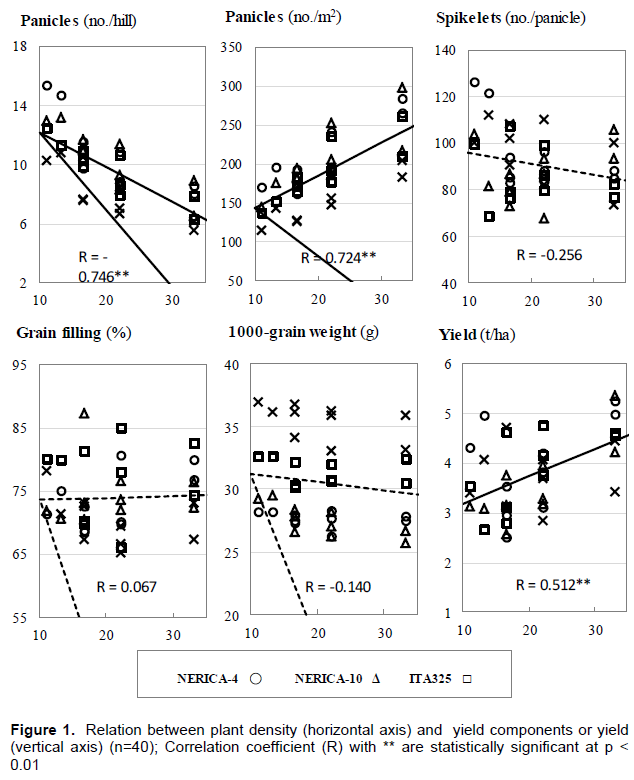
The means by season, varieties, and plant density treatment and by yield component indicated that an increase in plant density (the number of hills/m2) decreased panicles/hill and spikelets/panicle and increased panicles/m2 and yield, although large variations across replications made the mean differences among the plant density treatments not significant for many cases (Table 1). No appreciable effects of plant density were found for grain-filling rate and 1000-grain weight. The simple correlation analysis for the four varieties as a whole confirmed these observations partially (Figure 1). The negative impacts of plant density on panicles/hill and the positive impacts on panicles/m2 and yield were statistically significant at p < 0.01. The relation with plant density was negative for spikelets/panicle and 1000-grain weight, but not significant. Grain-filling rate seemed not to be affected by plant density.
Response-function estimation
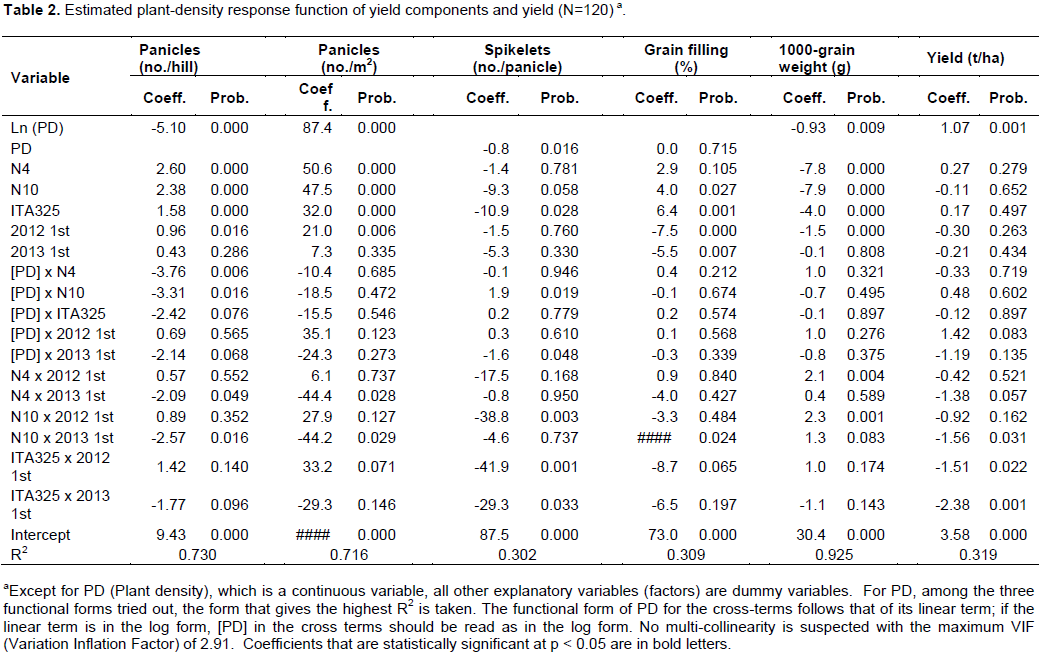
The results of the estimation of Equation 1 revealed that among the functional forms tried out, the semi-log linear form performed better for panicles/hill, panicles/m2, 1000-grain weight, and yield and that the linear form did better for spikelets/panicle and grain-filling rate (Table 2). The quadratic form performed poorest in all the equations.
The regression coefficient of plant density in the panicle/hill equation was negative and highly significant (Table 2). A lower plant density allows plants to receive more sunlight, which facilitates the increase in the number of panicles per plant. This has been widely observed for upland as well as lowland rice. Akita (1982a, b) found for a lowland rice variety that tillers/hill and panicles/hill decreased as plant density increased in his experiment with 10 density levels from 1 to 100 hills/m2. Kondo (1944), Yamada et al. (1960), Hossain et al. (2003), Hayashi et al. (2006), and Zhang and Yamagishi (2010) found the same for lowland rice and Oyedokun (1977), Akobundu and Ahissou (1985), Yamaguchi (1982), and Clerget et al. (2016) for upland rice. Akita (1982b) reported for lowland rice that shading by thickly growing leaves due to higher plant density caused the withering of lower layer leaves, resulting in lower tillering. In the study, upland rice experiment, such withering of leaves was not observed until just before harvest even in plots of the highest density.
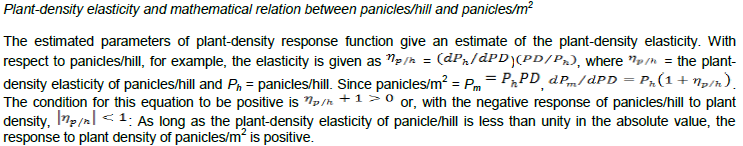
The regression coefficient of plant density in the panicles/m2 equation was negative and highly significant (Table 2); the number of panicles per unit area increased as plant density increased, which implied that the plant-density elasticity of panicles/hill lies between 0 and -1. All the previous studies mentioned in the previous paragraph are unanimous in showing the positive relation between panicles/m2 and plant density. The same response was found by Harrell and Blanche (2010) for direct seeded rice in the USA and by Nakano et al. (2012) for a Japanese high-yielding rice for feed use. Huang et al. (2013) reported an exceptional case for Chinese hybrid varieties that while the effect of plant density on panicles/m2 was positive and significant for crops planted early, no significant relation was found for crops planted late.
The spikelets/panicle equation revealed that its negative relation with plant density was significant, when variations due to varieties and seasons were controlled (Table 2). The negative effect of plant density on spikelets/panicle, which is expected result from the competition among plants at higher plant density, has also been widely reported for lowland and upland rice varieties alike (Kondo, 1944; Matsushima, 1966; Akita, 1982b; Yamaguchi, 1982; Hossain et al., 2003; Zhang and Yamagishi, 2010; Nakano et al., 2012; Clerget et al., 2016), and it is hardly possible to find plant-density studies that reported otherwise.
The regression coefficient of plant density in the grain-filling-rate equation was not significant at all and those in the 1000-grain-weight equation were negative and significant (Table 2). These yield components are affected negatively by shading (Matsushima, 1966). More tillers/m2 and panicles/ m2 resulted from higher plant density in earlier growing stages may also induce competitions for fertilizer nutrients and soil water, resulting in lower grain-filling rate and grain-weight/grain, which could be particularly important in upland rice cultivation that is usually practiced under rainfed conditions with low fertilizer application. All these suggest the negative effects of plant density on these yield components. However, the effects of plant density on these components are more complex than the other yield components, for upland and lowland rice alike. For filled-grain rate of upland rice varieties, Kawatei et al. (1966) reported for a Japanese variety significantly positive responses to plant density, whereas Yamaguchi (1982) found the opposite
for IITA varieties. In both studies, the response to plant density was found insignificant for1000-grain weight. Oyedokun (1977) for IITA upland rice varieties and Clerget et al. (2016) for a recent upland variety of NSIC-Rc222 found no significant effects of plant density for both components. For lowland rice, Kondo (1944), Takeda and Hirota (1971), Hossain et al. (2003), Gendua et al. (2009), and Harrell and Blanche (2010) found negative responses for both components, Akita (1982b), Hayashi et al. (2006), and Nakano et al. (2012) found positive responses for both components, and Yoshida and Parao (1972), Lampayan et al. (2010), and Roshan et al. (2011) found insignificant responses for both components. All these suggest that some factors other than plant density were at work in regulating the plant-density responses of these components.
Finally, the regression coefficient of plant density in the yield equation was positive and significant for the range of plant density tested (Table 2). All the plant-density studies referred to in this sub-section are consistent in this respect: yield increases as plant density increases throughout the density range tested, or it increases until it reaches the maximum or plateau at about the plant density of 30 hills/m2 or higher. In an experiment in the Philippines with an upland rice, Apo, and two levels of row spacing, Chauhan and Johnson (2011) reported that row-spacing of 15-cm yielded better than that of 30-cm, which is consistent with our findings.
Differences among varieties
The response of panicles/hill to plant density differed significantly among the varieties (Table 2). The intercept dummy variables for variety were all positive and highly significant, which means that, with respect to plant density, the regression lines of three African varieties were located significantly above that of Yume. Moreover, the slope dummy variables of N4 and N10 (the interaction terms between plant density and N4 or N10) were negative and significant, which means that the rate of decrease in panicles/hill was significantly larger for these NERICA varieties than for Yume. In comparison with Yume, the three African varieties under study, the two NERICA varieties in particular, are characterized by larger panicles/hill and higher negative response to plant density. For panicles/m2, too, the intercept dummy variables for variety were all positive and highly significant for all three African varieties, but the slope dummy variables, which were significant for N4 and N10 in the panicles/hill equation, turned insignificant. With respect to spikelet/panicle, the intercept dummy variables for variety had negative coefficients for African varieties, but significant only for ITA325 (Table 2). The intercept dummy variables for variety in the grain-filling equation were positive and significant, except for N4, and those in the 1000-grain-weight equation were all negative and significant, but no slope coefficient was significant in these two equation. The yield equation did not show any significant coefficient for variety-related dummy variables.
Critical yield components and the optimum plant density
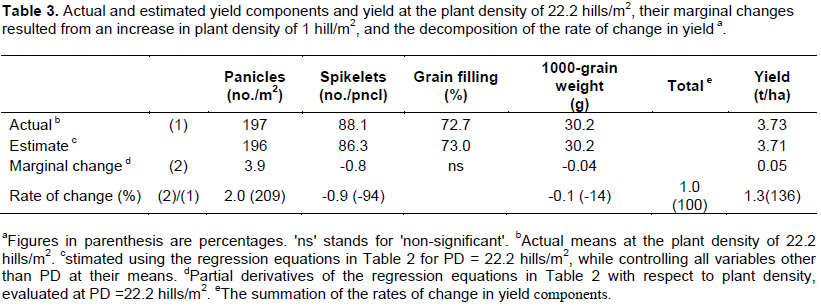
In order to analyze how changes in plant density affects to yield, the change in yield due to a unit increase in the plant density was decomposed into the changes in the yield components due to a unit increase in the plant density. The response functions of three yield components, for which plant density gave significant effects, were of the semi-log linear form and so was the response function of yield. This means that the rate of change due to a change in plant density is not constant over the range within which plant density changes. Let us examine the rates of change in the yield components and yield at the plant density of 22.2 hills/m2 which is the density treatment closest to the mean of the plant density of 20.8 hills/m2 in the estimation of the response functions (Table 3). The ‘estimated’ figures of the yield components and yield, estimated by using the response functions in Table 2, were close to the ‘actual’ figures with projection errors less than 2% for all the response functions. It was estimated that a unit increase in plant density (1 hill/m2) increases panicles/m2 by 3.9 with the rate of change of 2%, decreased spikelets/panicle by 0.8 with the rate of change of 0.9% and 1000-grain weight by 0.04 g with the rate of change of 0.1%, and increased yield by 50 kg/ha. The rates of change of four yield components summed up to 1%, which was the estimated rate of change in yield due to the change in plant density. Although there was a discrepancy of 36% between this estimate and the rate of change derived from the yield equation, it was apparent that the increase in yield due to a unit increase in plant density was brought about by the increase in panicles/m2. Spikelets/panicle moved the opposite direction, but its rate of change was less than that of panicle/m2, resulting in a positive change in the number of spikelets per square meter. The negative change in 1000-grain weight further reduced the rate of change in yield, but its contribution to the change in yield was less important. Therefore, the direction as well as the degree of changes in yield due to changes in plant density was largely determined by the changes in the number of spikelets square meter. It is generally the case, upland and lowland rice alike, that at lower levels of plant density till 25 to 50 hills/ha panicles/m2 is the most important yield component that determines the positive effects of plant density on yield (Yoshida, 1981; Akita, 1982b; Yamaguchi, 1982; Harrell and Blanche, 2010; Clerget et al., 2016).
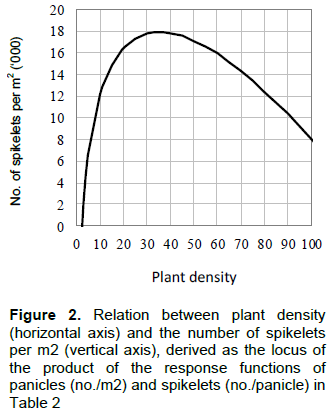
As Akita (1982b) and Hossain et al. (2003) showed for lowland rice, the rate of increase in panicle/m2 diminishes as plant density increases and eventually becomes smaller than the rate of decrease in spikelet/panicle in the absolute values, which results in decreases in spikelet/m2 and in turn in yield. This applies to the present study on upland rice. The response function of spikelet/m2, which was derived from the estimated response functions of panicle/m2 and spikelet/panicle is depicted in Figure 2.

The maximum number of spikelets per m2 is reached at the plant density of 35 hills/m2, and the number starts to decline towards higher density. Considering the heavy weight that spikelet/m2 takes in determining the rate of change in yield due to changes in plant density, it is expected that the maximum yield would have been attained at around this density level, which is slightly higher than the highest density treatment of 33 hill/m2 in the present study. Theyield equation in Table 2 gives that the marginal increase in yield as plant density increases by 1 hill/m2 declined from 100 kg/ha at the density of 11 hills/m2 to only 30 kg/ha at the density of 33 hills/m2.
Comparable results were obtained for lowland rice by Akita (1982b). Hossain et al. (2003) reported that the maximum yield as well as the maximum number of spikelet/m2 was attained at the plant density of 25 and 27 hills/m2, respectively. For upland rice in West Africa, mixed results have been reported. In Nigeria, Oyedokun and Sobulo (1977) showed, using five TOS-numbered upland varieties released by IITA with three plant-density treatments from 11 to 100 hills/m2, that the maximum yield was attained at the density of 50 hills/m2; in an experiment in Nigeria using seven ITA varieties and four other improved upland varieties with five levels of plant density from 2 to 100 hills/m2, Yamaguchi (1982) reported that as plant density increases the rate of increase in yield as well as spikelets/m2 diminished but never declined; and in an experiment in Nigeria with two ITA varieties and one local upland variety, Oghalo (2011) reported that, among three plant-density treatments from 8 to 17 hills/m2, rice yield was highest at the mid-density of 11 hills/m2. In an experiment in Benin using four upland rice varieties including NERICA 1, 2, and 4, Oikeh et al. (2009) reported that the spacing of 30 cm × 30 cm (11 hills/m2) or 20 cm × 20 cm (25 hills/m2) was optimum for NERICA varieties. The present study in Uganda indicated that the plant density of 11 hills/m2 was too sparse to attain the optimum rice yield. Whether the plant density as low as 11 hills/m2 could be an optimum plant density for upland rice in SSA should be examined carefully in the future.
Economic consideration
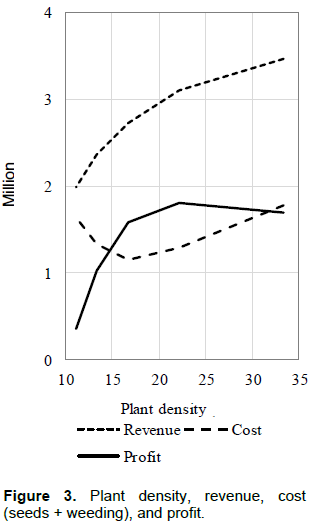
When the cost of seeds and weed control were taken into account, the highest profit was attained at the plant density of 22 hills/m2, instead of 33 hills/m2 (Figure 3). In this estimation, the quantity of seeds for each treatment was obtained by multiplying the seeding rate of 11 seeds/hill with the mean 1000-grain weight of 30.4 g and the hill density of each treatment. The intensity of manual labor needed to keep the plots weed free was lowest for the 17 hills/m2 treatment (row-spacing of 40-cm). Relative to this treatment, the needed labor intensity for other treatments were measured as follows: 1.1 for 22 hills/m2 (30 cm), 1.2 for 13 hills/m2 (50 cm), and 1.5 for 33 hills/m2 (20 cm) and 11 hills/m2 (60 cm). The labor requirement for weeding per ha for the 17 hills/m2 (40 cm) treatment was assumed to be 65 person-days/ha, referring to Miyamoto et al. (2012). The farm-gate prices of seeds and paddy rice were assumed to be Ush 2000/kg and Ush 1000/kg, respectively, and the wage rate was assumed to be Ush 8000/day, referring to Haneishi et al. (2013). The result of the study is consistent with the findings for upland rice by Kawatei et al. (1966) and Akobundu and Ahissou (1985) that the inter-row spacing of 30 cm was preferable for higher yields as well as for easier weed control. The hill density of 22.2 hills/m2 is close to the recommended hill densities of 25 hills/m2 in West Africa (Oikeh et al., 2008) and of 26.7 hills/m2 in East Africa (NaCRRI, 2010).

Comparison with farmers’ actual practices
Upland farmers in East Africa, when they plant upland rice, usually adopt line seeding (drill). A typical method of their line seeding is to place a seed in 1.8 cm interval in a row, with a row spacing of 30 cm, in which case the seeding rate is 185 seeds/m2. If the germination rate is 100%, the plant density in terms of the number of plants per m2 is 185 plants/m2. Since the number of plants in the study is 5 plants/hill, the plant density of 185 plants/m2 corresponds to the plant density of 37 hills/m2, which is slightly higher than the biologically optimum hill density of 35 hills/m2 given in this study as the hill density that maximizes the number of spikelets/m2. This suggests that upland farmers in East Africa are rational in selecting the plant density in upland rice cultivation, or that their rate of seeding may be slightly exceeding the economically optimum level.
It should be reminded, however, that this study is based on the plant density obtained by hill spacing. The effects of plant density could be different if plant density is measured in terms of row spacing or seeding rate. Although Lampayan et al. (2010) and Chauhan and Posner (2011), both of which adopted row spacing, and Harrell and Blanche (2010), which used seeding rate, report plant-density responses the patterns of which are essentially the same as those reported by the studies, including ours, which adopted the hill density, further research is needed to confirm differences in the effects of plant density among the different measures of plant density.
The estimation of plant-density-response-functions for yield components and yield revealed that an increase in plant density significantly decreased the number of panicles per hill, the number of spikelets per panicle, and 1000-grain wright, and significantly increased the number of panicles per m2. Grain-filling rate was not affected by plant density. As a result, rice yield responded to plant density positively throughout the plant density range from 11 hills/m2 (plant spacing of 60 cm × 15 cm) to 33 hills/m2 (20 cm × 15 cm), though the marginal increase in yield as plant density increased by 1 hill/m2 diminished from 100 kg/ha at the lowest density to 30 kg/ha at the highest density. The critical yield components that determined this increase in yield were the number of panicles per square meter and the number of spikelets per panicle, or combined together, the number of spikelets per square meter, which was estimated to reach the maximum at the plant density of 35 hills/m2. When the differences among the treatments in the costs of seed and weed control were taken into consideration, the optimum plant density was reduced to 22.2 hills/m2 (plant spacing of 30 cm × 15 cm), lower than the plant density that give the maximum yield. Whether this conclusion, that is, the optimum plant density of recently developed African upland rice varieties is about 20 hills/m2 or higher, is applicable in other growing environments in SSA should be examined carefully in the future.
The authors have not declared any conflict of interests.
REFERENCES
|
AGRA/JICA (2008). Coalition for African rice development (CARD). Alliance for a Green Revolution in Africa (AGRA) and Japan International Cooperation Agency (JICA).
View
|
|
|
|
Aiken LS, West SG (1991). Multiple Regression: Testing and Interpreting Interactions. Sage Publication, London.
|
|
|
|
Akita K (1982a). Studies on competition and compensation of crop plants, IX, Effects of planting density on the characters of rice plant. Sci. Rept. Fac. Agric. Kobe Univ. 15:5-10.
|
|
|
|
Akita K (1982b). Studies on competition and compensation of crop plants, XI, Effects of planting density on the yield component in rice plant. Sci. Rept. Fac. Agric. Kobe Univ. 15:17-21.
|
|
|
|
Akobundu IO, Ahissou A (1985). Effect of interrow spacing and weeding frequency on the performance of selected rice cultivars on hydromorphic soils of West Africa. Crop Prot. 4(1):71-76.
Crossref
|
|
|
|
Badawi AAT, Maximos MA, Aidy IR, Olaoye RA, Sharma SD (2010). History of Rice in Africa. In Sharma S.D. (ed.) Rice: Origin, Antiquity and History, CRC Press, New York pp. 373-410.
Crossref
|
|
|
|
Chauhan, BS, Johnson, DE (2011). Row spacing and weed control timing affect yield of aerobic rice. Field Crops Res. 121:226-231.
Crossref
|
|
|
|
Clerget B, Bueno C, Domingo AJ, Layaoen HL, Vial L (2016). Leaf emergence, tillering, plant growth, and yield in response to plant density in a high-yielding aerobic rice crop. Field Crops Res. 199: 52-64.
Crossref
|
|
|
|
Gendua PA, Yamamoto Y, Miyazaki A, Yoshida T, Wang Y (2009). Responses of yielding ability, sink size and percentage filled grain to the cultivation practices in Chinese large-panicle-type rice cultivar, Yangdao 4. Plant Prod. Sci. 12(2):243-256.
Crossref
|
|
|
|
Haneishi Y, Maruyama A, Miyamoto K, Matsumoto S, Okello S, Asea G, Tsuboi T, Takagaki M, Kikuchi M (2013). Introduction of NERICA into an upland farming system and its impacts on farmers' income: A case study of Namulonge in Central Uganda. Trop. Agric. Dev. 57(2):61-73.
|
|
|
|
Harrell DL, Blanche SB (2010). Tillage, seeding, and nitrogen rate effects on rice density, yield, and yield components of two rice cultivars. Agron. J. 102(2): 592-597.
Crossref
|
|
|
|
Hayashi S, Kamoshita A, Yamagishi J (2006). Effect of planting density on grain yield and water productivity of rice (Oryza sativa L.) grown in flooded and non-flooded fields in Japan. Plant. Prod. Sci. 9(3):298-311.
Crossref
|
|
|
|
Hossain MS, Mamun AA, Newa MN, Anam MK (2003). Effect of cultivar and spacing on weed infestation and performance of transplant Aman rice in Bangladesh. Pakistan J. Agron. 2(3):169-17.
|
|
|
|
Huang M, Yang C, Ji Q, Jiang L, Tan J, Li Y (2013). Tillering responses of rice to plant density and nitrogen rate in a subtropical environment of southern China. Field Crops Res. 149:187-192.
Crossref
|
|
|
|
Jones MP, Dingkuhn M, Aluko K, Mande S (1997). Interspecific Oryza sativa L x O. glaberrrima Steud progenies in upland rice improvement. Euphytica 92:237-246.
Crossref
|
|
|
|
Kawatei K, Kato T, Sakane K (1966). Studies on the competitive effect of annual weeds to upland rice: The relationships between the effects of weeds control and row distance or weed-free periods. Japanese J. Crop Sci. 34(3):303-310.
Crossref
|
|
|
|
Kondo Y (1944). The effects of increasing plant density in lowland rice. Agric. Hortic. 19(7):667-674.
|
|
|
|
Lampayan RM, Bouman BAM, de Dios JL, Espiritu AJ, Soriano JB, Lactaoen AT, Faronilo JE, Thant KM (2010). Yield of aerobic rice in rainfed lowlands of the Philippines as affected by nitrogen management and row spacing. Field Crops Res. 116:165-174.
Crossref
|
|
|
|
Matsushima S (1966). Crop Science in Rice: Theory of Yield Determination and its Application. Fuji Publishing Co., Tokyo.
|
|
|
|
Miyamoto K, Maruyama A, Matsumoto S, Haneishi Y, Tsuboi T, Asea G, Okello SE, Takagaki M, Kikuchi M (2012). NERICA cultivation and its yield determinants: The case of upland rice farmers in Namulonge, Central Uganda. J. Agric. Sci. 4:120-135.
Crossref
|
|
|
|
Nakano H, Morita S, Kitagawa, H, Wada H, Takahashi M (2012). Grain yield response to planting density in forage rice with a large number of spikelets. Crop Sci. 52:345-350.
Crossref
|
|
|
|
NaCRRI-JICA (2010). Rice cultivation handbook, NERICA Promotion Project, NaCRRI, Kampala, Uganda.
|
|
|
|
Oghalo SO (2011). Effect of population density on the performance of upland rice (Oryza Sativa) in a forest-savanna transition zone. International J. Sustain. Agric. 3(2):44-48.
|
|
|
|
Oikeh SO, Nwilene FE, Agunbiade TA, Oladimeji O, Ajayi O, Semon M, Tsunematsu H, Samejima H (2008). Growing upland rice: a production handbook. Africa Rice Center (WARDA). Cotonou, Benin. View
|
|
|
|
Oikeh S, Touré A, Sidibé B, Niang A, Semon M, Sokei Y, Mariame M (2009). Responses of upland NERICA rice varieties to nitrogen and plant density. Archives Agron. Soil Sci. 55(3):301-314.
Crossref
|
|
|
|
Oyedokun JB (1977). Effects of plant density on yield parameters of upland rice in South Western Nigeria. East Afr. Agric. For. J. 42(4):379-387.
|
|
|
|
Oyedokun JB, Sobulo A (1977). Response of improved upland rice varieties to spacing and nitrogen in south-western Nigeria. Ghana J. Agric. Sci. 10:121-127.
|
|
|
|
Patel JR (1999). Response of rice (Oryza sativa) to time of transplanting, spacing and age of seedlings. Indian J. Agron. 44(2):344-346.
|
|
|
|
Rodenburg J, Zwart SJ, Kiepe P, Narteh LT, Dogbe W, Wopereis MCS (2014) Sustainable rice production in African inland valleys: Seizing regional potentials through local approaches. Agric. Syst. 123:1-11.
Crossref
|
|
|
|
Roshan MN, Azarpour E, Moradi M (2011). Study of yield and yield components of rice in different plant spacings and number of seedlings per hill. Middle-East J. Sci. Res. 7(2):136-140.
|
|
|
|
Saito K, Dieng I, Toure AA, Niang A, Somado EA, Wopereis MCS (2015). Rice yield growth analysis for 24 African countries over 1960-2012. Global Food Security 5:62-69.
Crossref
|
|
|
|
Seck PA, Touré AA, Coulibaly JY, Diagne A, Wopereis MCS (2013). Africa's rice economy before and after the 2008 rice crisis. In Wopereis MCS, Johnson, DE, Ahmadi, N, Tollens, E, Jalloh, A (Eds.), Realizing Africa's Rice Promise. Cabi International and Wallingford, Oxfordshire and Boston pp. 24-34.
Crossref
|
|
|
|
Takeda T, Hirota O (1971). Relationship between Spacing and Grain Yield of Rice Plant. Japanese J. Crop Sci. 40(3):381-385.
Crossref
|
|
|
|
Yamada N, Ota Y, Nakamura H (1960). Ecological effects of planting density on growth of rice plant. Japanese J. Crop Sci. 29:329-333.
Crossref
|
|
|
|
Yamaguchi J (1982). Plant density response of rice cultivars under dryland conditions. In: IITA Annual Report for 1981. IITA, Ibadan, Nigeria pp. 115-118.
|
|
|
|
Yoshida S, Parao FT (1972). Performance of improved rice varieties in the tropics with special reference to tillering capacity. Expl Agric. 8:203-212.
Crossref
|
|
|
|
Yoshida S (1981). Fundamentals of Rice Crop Science. International Rice Research Institute, Los Baňos, Philippines.
|
|
|
|
Zhang B, Yamagishi J (2010). Response of spikelet number per panicle in rice cultivars to three transplanting densities. Plant Prod. Sci. 13(3):279-288.
Crossref
|