Full Length Research Paper

ABSTRACT
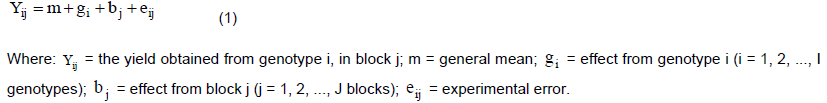
The objective of this study was to determine a suitable plot size for field experiments with papaya genotypes. Two experiments were carried out using a randomized complete block design with 11 and 12 papaya genotypes, respectively. In both experiments, plots consisted of one row, with 10 plants each. Spacing between rows was 3.5 m, with 1.5 m between plants. The characteristic evaluated was fruit production in t ha-1 in first year of cultivation, and the basic unit used was one plant. Suitable plot size was estimated using Lin and Binns, and Hatheway’s methods. These methods are complementary and should be used together in the determination of the optimum plot size. The results of these tests showed that the optimum plot size for the evaluation of yield in papaya was four plants by plot with four replications each assuming 30% of the precision for establishing differences among the means of two genotypes.
Key words: Breeding, Carica papaya, intrablock correlation.
INTRODUCTION
MATERIALS AND METHODS
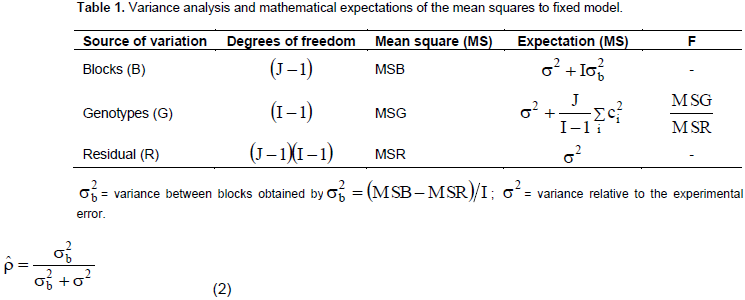
 = the intra-block correlation.
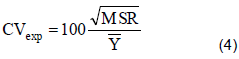
 that is the estimate of the experimental coefficient of variation in percentage, was determined by Equation 4:
 = the general mean.
 in the evaluation of yield in the papaya was calculated using Hatheway’s method (Hatheway, 1961), by Equation 5:
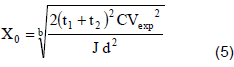
 are defined by Equations 3 and 4, respectively; J = the number of replications considered; d = the difference between genotypes mean to be detected as significant at the 5% probability, and expressed as a percentage of the expected detected mean; t1 = the critical value of Student's t distribution for the level of significance of the test (type I error) of α = 5% (bilateral test at 5%), with df degrees of freedom and t2 = the critical value of the Student t distribution, corresponding to 2 (1-P) (bilateral test), where P is the probability of obtaining a significant result, that is, the power of the test (P = 0.80, in this study), with df degrees of freedom. The tabulated values of t distribution were obtained with residual degrees of freedom, according to the treatments I and J replications, where
 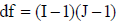 for a randomized block design. As reported by Cargnelutti Filho et al. (2014), the parameter d measures the precision, being that a small percentage of d indicates greater precision; in other words, small differences between treatments means will be considered significant.
RESULTS AND DISCUSSION
= 19.92 and 26.36% in Experiments 1 and 2, respectively (Table 2). Other researchers also found with values between 20 and 30% in the evaluation of papaya genotypes (Oliveira et al., 2014; Dantas et al., 2015; Luz et al., 2015). In both experiments, there was a significant difference between the means for the assayed genotypes with productivity of the first trial of 79 and of 66 t ha-1 in the second experiment, always for the first year of cultivation. There was a significant difference between the means by the Scott-Knott grouping test in two experiments (Table 3). Productivity ranged from 55 t ha-1 (for UENF/Caliman 01 genotype to 97 t ha-1 and CR2 x SS32 genotype in experiment 1) to 37 t ha-1 (for Golden THB genotype to 104 t ha-1 and CR3 x Maradol genotype in experiment 2). Most genotypes have a productivity average above Brazilian and world average of 50 and 31 t ha-1, respectively (FAO, 2014) are higher than the productivity of other genotypes verified in different studies (Oliveira et al., 2014; Dantas et al., 2014). Consequently, from the point of view of the experimental quality, the results of both experiments present credibility for study of the determination of optimum plot size. 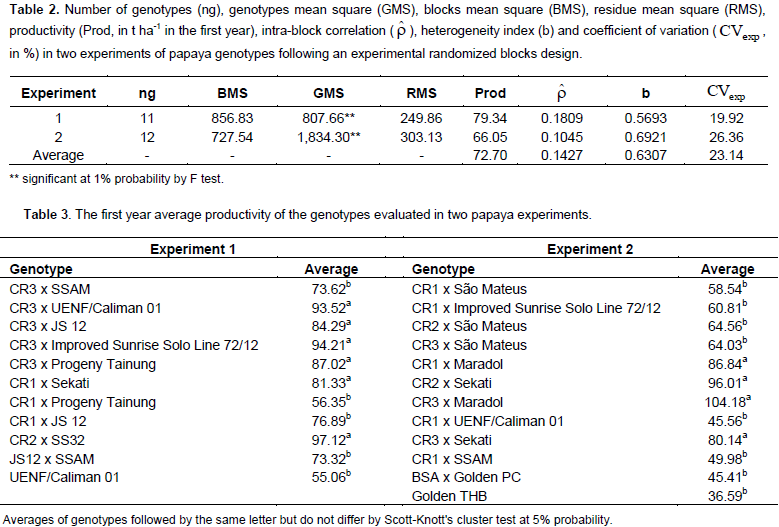
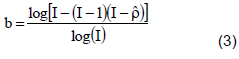
 was 0.1809 and 0.1045 in experiments 1 and 2, respectively, which allowed to obtain soil heterogeneity index (b) 0.5693 and 0.6901, respectively (Table 2). As recommended by Lin and Binns (1986) when b value is between 0.2 and 0.7, the researcher should plan a suitable combination between the number of replicates and plot size. In research involving yield production of papaya in the field, one of the researcher's wishes is also to reduce the experimental area. This can be obtained, according to equation 5 presented by Hatheway (1961): through, reducing the value of t1 which is achieved by increasing the number of treatments and/or repetitions; increasing the number of repetitions (J); by decreasing the accuracy or increasing the difference between the means (increasing the value of d). These options can be taken individually or all together as presented in Table 4, when b = 0.6307 and = 23.14%.
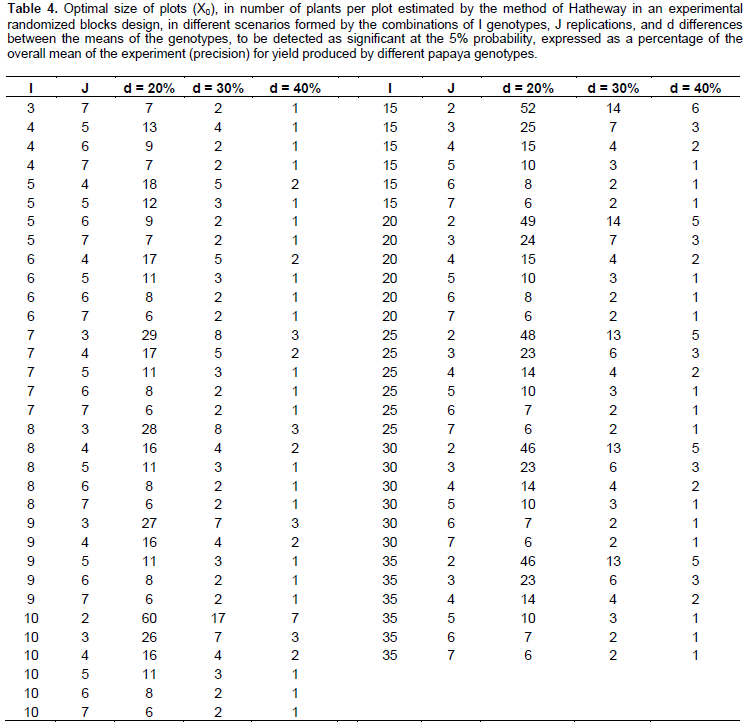
CONCLUSION
CONFLICT OF INTERESTS
ACKNOWLEDGEMENT
REFERENCES
|
Alves SMF, Seraphin JC (2004). Coeficiente de heterogeneidade do solo e tamanho de parcela. Pesqui. Agropecu. Bras. 39:105-111. |
|
|
Barbosa MHP, Peternelli LA, Silveira LCI (2001). Plot size in sugarcane family selection experiments. Crop Breed. Appl. Biotechnol. 1:271-276. |
|
|
Brito MCM, Faria GA, Morais AR, Souza EM, Dantas JLL (2012). Estimação do tamanho ótimo de parcela via regressão antitônica. Rev. Bras. Biom. 30:353-366. |
|
|
Cargnelutti Filho A, Toebe M, Alves BM, Burin C, Neu IM, Facco G (2014). Tamanho amostral para avaliar a massa de plantas de mucuna cinza. Comum. Sci. 5:196-204. |
|
|
Casler MD (2013). Finding Hidden Treasure: A 28-year case study for optimizing experimental designs. Commun. Biom. Crop Sci. 8:23-38. |
|
|
Celanti HF, Schmildt ER, Schmildt O, Alexandre RS, Cattaneo LF (2016a). Optimal plot size in the evaluation of papaya scions: proposal and comparison of methods. Rev. Cer. 63:469-476. |
|
|
Celanti HF, Schmildt O, Alexandre RS, Cattaneo LF, Schmildt ER (2016b). Plot size in the evaluation of papaya seedlings 'Baixinho de Santa Amália' in tubes. Rev. Bras. Frut. 38:1-15. |
|
|
Cortes DFM, Santa-Catarina R, Barros GBA, Aredes FAS, Silveira SF, Ferreguetti GA, Pereira MG (2017). Model-assisted phenotyping by digital images in papaya breeding program. Sci. Agric. 74:294-302. |
|
|
Cruz CD (2016). Genes Software – extended and integrated with the R, Matlab and Selegen. Acta Sci. Agron. 38:547-552. |
|
|
Dantas JLL, Lucena RS, Boas SAV (2015). Avaliação agronômica de linhagens e híbridos de mamoeiro. Rev. Bras. Frut. 37:138-148. |
|
|
Food and Agriculture Organization (FAO) (2014). Food and Agriculture Organization of the United Nations. |
|
|
Hatheway WH (1961). Convenient plot size. Agron. J. 53:279-280. |
|
|
Khan M, Hasija RC, Tanwar N (2017). Optimum size and shape of plots based on data from a uniformity trial on Indian Mustard in Haryana. Mausam 68:67-74. |
|
|
Leite MSO, Peternelli LA, Barbosa MHP (2006). Effects of plot size on the estimation of genetic parameters in sugarcane families. Crop Breed. Appl. Biotechnol. 6:40-46. |
|
|
Lima JF, Peixoto CP, Ledo CAS, Faria GA (2007). Tamanho ótimo de parcela para experimentos com planta de mamoeiro em casa de vegetação. Ciênc. Agrotec. 31:1411-1415. |
|
|
Lin CS, Binns MR (1984). Working rules for determining the plot size and numbers of plots per block in field experiments. J. Agric. Sci. 103:11-15. |
|
|
Lin CS, Binns MR (1986). Relative efficiency of two randomized block designs having different plot size and numbers of replications and of plots per block. Agron. J. 78:531-534. |
|
|
Lorentz LH, Erichsen R, Lúcio AD (2012). Proposta de método para estimação de tamanho de parcela para culturas agrícolas. Rev. Cer. 59:772-780. |
|
|
Luz LN, Pereira MG, Barros FR, Barros GB, Ferreguetti GA (2015). Novos híbridos de mamoeiro avaliados nas condições de cultivo tradicional e no semiárido brasileiro. Rev. Bras. Frut. 37:159-171. |
|
|
Meier VD, Lessman KJ (1971). Estimation of optimum field plot shape and size for testing yield in Crambea byssinica Hochst. Crop Sci. 11:648-650. |
|
|
Muniz JA, Aquino LH, Simplício E, Soares AR (2009). Estudo do tamanho de parcelas experimentais em povoamentos de Eucalyptus grandis Hill, usando parcelas lineares. Ciênc. Agrotec. 33:1002-1010. |
|
|
Oliveira EJ, Fraife Filho GA, Freitas JPX, Dantas JLL (2014). Desempenho produtivo e interação genótipo x ambiente em híbridos e linhagens de mamoeiro. Biosci. J. 30:402-410. |
|
|
Paranaíba PF, Ferreira DF, Morais AR (2009). Tamanho ótimo de parcelas experimentais: Proposição de métodos de estimação. Rev. Bras. Biomed. 27:255-268. |
|
|
Pimentel-Gomes F (1984). O problema do tamanho das parcelas em experimentos com plantas arbóreas. Pesqui. Agropecu. Bras. 19:1507-1512. |
|
|
Pimentel-Gomes F (2009). Curso de estatística experimental, 15nd ed., Fealq, Piracicaba, Brazil. |
|
|
Poltronieri TPS, Silveira SF, Vivas M, Santa-Catarina R, Cortes DFM, Azevedo AON, Pereira MG (2017). Selecting black-spot resistant papaya genotypes derived from backcrossing and hybrids. Gen. Mol. Res. 16:1-11. |
|
|
Santos PHD, Silveira SF, Vivas M, Carvalho BM, Pereira MG (2017). Alternative control to black spot disease in papaya genotypes. Sum. Phytop. 43:60-62. |
|
|
Schmildt ER, Schmildt O, Cruz CD, Cattaneo LF, Ferreguetti GA (2016). Optimum plot size and number of replications in papaya field experiment. Rev. Bras. Frut. 38:1-9. |
|
|
Silva CA, Nascimento AL, Ferreira JP, Schmildt O, Malikouski RG, Alexandre RS, Schmildt ER (2017). Genetic diversity among papaya accessions. Afr. J. Agric. Res. 12:2041-2048. |
|
|
Silva WM, Moraes MLT, Pupin S, Silva JM, Sebbenn AM, Pavan BE (2016). Influência do tamanho de parcelas experimentais na seleção de progênies de E. camaldulensis Dehnh. Sci. For. 44:979-986. |
|
|
Sousa RP, Silva PSL, Assis JP, Silva PIB, Silva JCV (2015). Optimum plot size for experiments with the sunflower. Ver. Ciênc. Agron. 46:170-175. |
|
|
Storck L, Cargnelutti Filho A, Lúcio AD, Lopes SJ (2009). Método de Papadakis e número de repetições em experimentos de soja. Ciênc. Rur. 39:977-982. |
|
|
Storck L, Ribeiro ND, Lopes SJ, Cargnelutti Filho A, Carvalho MP, Jost E (2007). Persistência do plano experimental em ensaios de avaliação de germoplasma elite de feijão. Ciênc. Rur. 37:1549-1553. |
|
Copyright © 2024 Author(s) retain the copyright of this article.
This article is published under the terms of the Creative Commons Attribution License 4.0


