ABSTRACT
The State of São Paulo, Brazil is the major orange producer in the world. The “Valência” orange is one of the most important cultivars for industry with a high efficiency of processed juice. Climate is the main factor of influence for citrus yield and quality and its study is fundamental for understanding the climatic requirements of the crop. The estimation of yield and quality by agrometeorological models helps to understand the effects of climate on crop cycle, besides being an option for orchards planning activities. Understanding the relationships between water deficiencies (DEF), phenological phases, yield (fruits per box (FRBOX) and quality of “Valência” orange grafted on rangpur lime (VACR) are important to improve the water use in the production areas and to provide information about water stress for plants during its cycle. The present study aimed to investigate the influence of monthly DEF on yield and quality parameters of VACR, in order to develop agrometeorological models for the main four producers regions of State of São Paulo, Brazil. Data of 13 years were used for analysis, being the period from 2001 to 2009 used for calibration and from 2010 to 2012 for validation. Multiple linear regression for model construction was used. All the developed agrometeorological models were accurate, ranging the values of mean absolute percentage error (MAPE) of 5.25 to 9.27% for mean annual yield (FRBOX) and 2.74 to 14.14% for quality (RATIO) among all regions. The angular coefficients indicate which phenological phase of VACR is more sensitive to DEF. Bauru and Limeira FRBOX was related to DEF during bud formation and vegetative dormancy. Yield at Bebedouro were related to DEF between vegetative dormancy and flowering and at Matão bud formation. Fruit quality was more sensitive to DEF during maturity at all regions.
Key words: Modeling, estimate, water deficiency, “Valência” orange.
Brazil is the major citrus producer in the world, with the production mainly used in industrial processing for producing concentrated juice for exportation. Every five cups of orange juice consumed in the world has at least three from Brazilian fruits (Neves et al., 2010). The State of São Paulo stands out due to three fundamental factors: economic, climatic and soil. With regard climatic and soil factors, São Paulo shows favorable conditions to citrus production due to, mild temperatures, suitable rainfall distribution, soils composition and relatively plain topography (Reis, 2008).
While the other factors that affect production and plant development are constant weather condition which varies from year to year and it is considered as the main factor that cause yield and quality variability (Paulino et al., 2007). Agrometeorological models are tools used to understand the influence of climatic variables on crop production, being a way to summarize the responses of the crop to the climate (Rolim et al., 2008). These models can be of great utility for planning the agricultural activities at orchards and to estimate production (processed or ‘in natura’ fruits). There are many examples of agrometeorological models application on estimations of yield of annual and perennial crops. Santos and Camargo (2006) developed agrometeorological models to estimate coffee yield at different regions of São Paulo, Espírito Santo, Paraná and Minas Gerais States. Bozorg et al. (2011) developed a model for wheat crop at Irã region. Araújo et al. (2014) made a modeling in order to estimate soybean yield associated to agrometeorological variables at Paraná.
Guimarães et al. (2013), elaborated models in multiple linear regressions to predict the banana “Prata” harvest time, at Guanambi, Bahia (BA) in function of yield characteristics, for example number of fruits. The main problem in multiple linear regression models is the selection of independent variables. According to Xu and Zhang (2001) there are many methods for this selection linear and non-linear multiples models, as: a) forward selection, b) backwards elimination, c) stepwise, d) leaps and bound regression, e) orthogonal descriptors, f) genetic algorithm, g) genetic population, f) choosing the operators and g) fitness of evaluation. Or according to Gujarati and Porter (2011), another option is to test all possible combinations to avoid the minimum local problems in the domain range.
Some literature was found using modelling to estimate yield and quality of “Valência” orange (Camargo et al., 1999; Volpe et al., 2002; Paulino, 2007). Citrus crops according to some studies use water deficiencies information to detect its effects at yield and quality with regards to irrigation scheduling. Panigrahi et al. (2014), have done a study about this subject and utilized this hydric information to predict yield of “Kinnow” mandarin in New Delhi, India.
Among the agrometeorological modelling papers for yield estimation, a few are exclusive dedicated to understand the water deficiencies influence at different phenological phases. For annual crops, this relation is more commonly studied, as the model tested by Monteiro and Sentelhas (2014) that used relative water deficiency at phenological phases to the calculation of actual soybean yield at different Brazil regions. For perennial crops, such analysis are not common, for most of “Valência” orange agrometeorological modelling papers search to understand effects of water stress at citrus orchards in order to determine the irrigation deficit, mainly at flowering (Pérez-Pérez et al., 2009; Roccuzzo et al., 2014) and not to estimate yield and quality of the fruits in function of the monthly water deficiency. The “Valência” is important among sweet oranges, due to its yield and fruit size (Pio et al., 2005). At industrial view, this orange represents one of the pillars of the agroindustry, being the second cultivar most produced at the state of São Paulo. The “Valência” orange have excellent juice quality for processing, storage and transport (Coelho, 2002).
This study aim to develop agrometeorological models for estimating annual yield (mean fruits per box and fruits weight) and quality parameters (maximum of ratio, fruit sugar content, kilograms of soluble solids per hectare and mean acidity) of “Valência” orange as a function of monthly water deficiencies (DEF) for Bauru (BAU), Bebedouro (BEB), Limeira (LIM) and Matão (MAT) regions and also comprehend the relationship of annual DEF with yield and quality parameters of VACR orange.
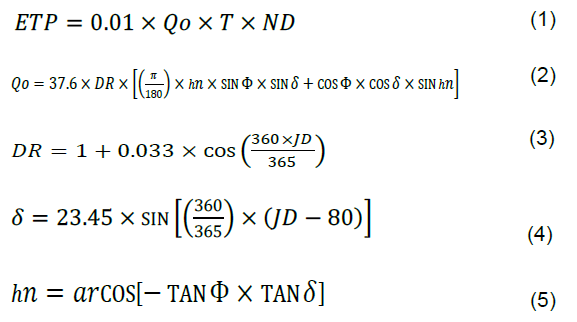
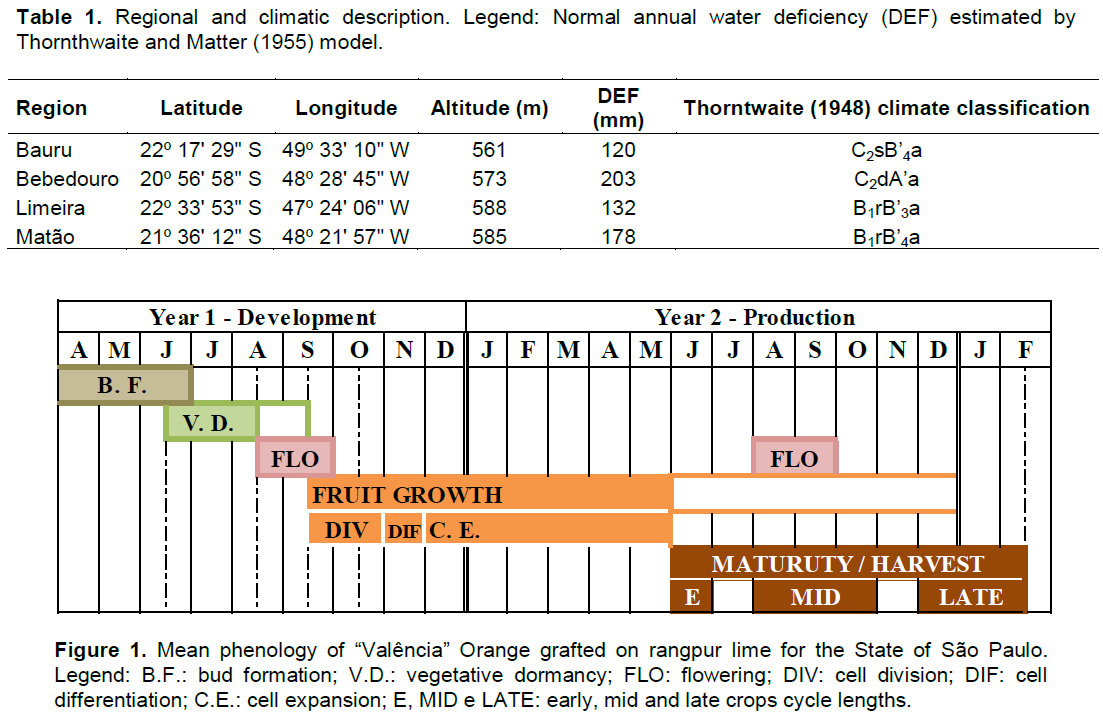
The regional climate data (Table 1) were obtained in daily scale from automatic meteorological station. Precipitation and air mean temperature data were organized at monthly scale from the period of 2000 to 2013 for calculation of potential evapotranspiration by the equation of Camargo (1971) (Equations 1, 2, 3, 4 and 5). Data of 13 years were divided into nine years for calibration (2001 to 2009) and three for validation (2010 to 2012).
where,
Qo is daily solar irradiance at the atmosphere (MJm
-2 day
-1); DR is relatively distance from earth to sun (astronomic units);

is hourly angle at sunrise;

is latitude (°); δ is solar declination (°); JD is Julian day; T is mean air temperature (°C); ND is number of days considered.
Meteorological data were used to calculate water deficiencies (DEF) (Equation 6), from the water balance calculation by the Thornthwaite and Matter (1955) method at monthly scale with available water capacity (AWC) of 100 mm.
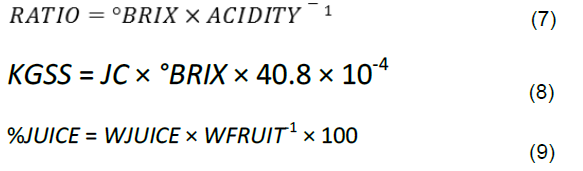
Where, DEF is water deficiency at the soil-plant system; ETP is potential evapotranspiration and ETR is actual or real evapotranspiration. Monthly quality data of ratio (Equation 7), fruit sugar content measured by optical refractometer (°BRIX), kilograms of soluble solids per hectare (KGSS) (Equation 8), acidity (% citric acid) and juice percentage (Equation 9) and monthly yield data of fruits per box (FRBOX) and fruit weight (WFRUIT) of “Valência” orange (Citrus sinensis, L. Osbeck) grafted on rangpur lime (Citrus limonia, Osbeck) (VACR) were obtained from the regional producers. These data were organized as a mean of the two flowerings and only from adult orchards (more than six years). Orange plants usually have two flowerings during its cycle, induced by thermal and/or hydric stresses, but it is possible for the plant to have more flowerings with climatic stresses off season.
where, JC: juice content (L); WJUICE: juice weight (kg); ACIDITY: % of citric acid; 40.8 box weight in kg.
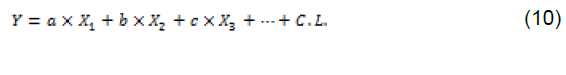
Multiple linear regressions (Equation 10) were applied to develop the models (Figures 6, 7, 8 and 9). The dependent variables were the yield and quality parameters and independent variables were the monthly DEF during the development and production years (Figure 1). The DEF data from April to December of the first year and from April to December of the second year were used to total the 16 possible pre-selected variables use in the models.
Where, Y: yield (fruits per box), as also brix, soluble solids, ratio, acidity and fruit weight; a, b, c,….: angular coefficients; X1, X2, X3,…: selected monthly DEF and C.L.: linear coefficient.
The main problem in multiple linear regressions is to find the combination of independent variables that brings consistency in the models. Following Gujarati and Porter (2011), the method used in this study was to test all possible combinations of monthly DEFs with 1 to 5 independent variables in the models, totaling 6,884 tested equations for each annual yield and quality parameter. The equations were generated by a routine in Visual Basic for Applications (VBA) in MS-Excel 2010 environment.
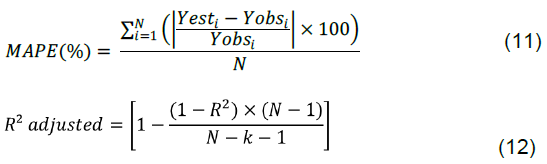
Analyses were made to identify the multicollinearity between the independent variables (monthly DEFs). Gujarati and Porter (2011), describe that multicollinearity is not an issue if the interest is just estimation. However if exists an interest of doing a coefficients interpretation, as is the case of this study, multicollinearity causes bias on these coefficients. In this study, we chose to remove equations that have minimal correlations among independent variables greater than 0.7. The best models were classified according to statistical indices of mean absolute percentage error (MAPE) (equation 11) and precision by the adjusted determination coefficient (adjusted R²) (equations 12), selecting only regressions that are statically significant by the test-F (p-value <0.05).
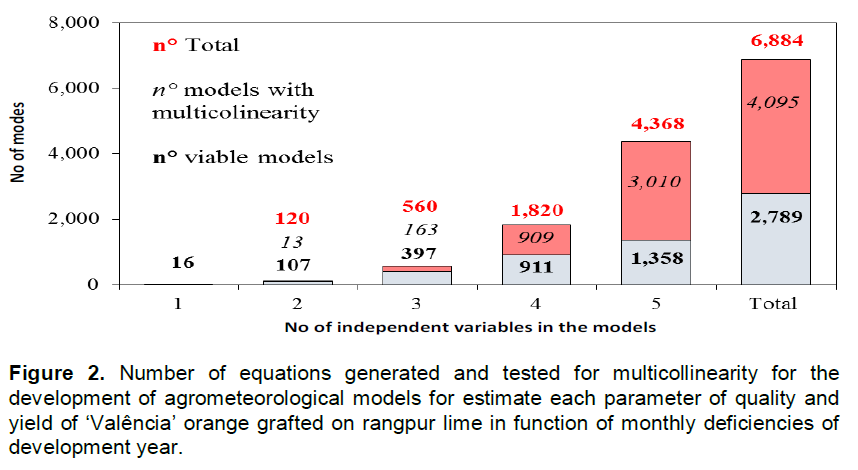
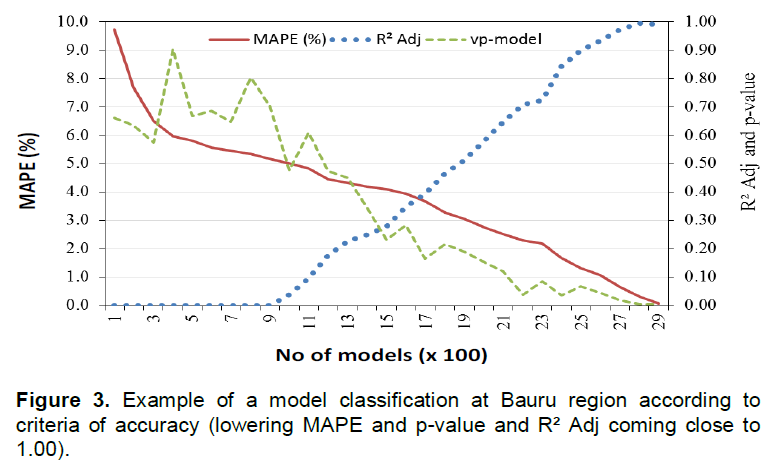
From all 6,884 generated and later tested equations for each yield and quality parameters, 4,095 equations showed multicollinearity between the independent variables at the models, the remaining combinations (2,789) represent the possible models for estimation of each yield and quality parameter of each region (Figure 2). With these, the best models were selected. The method of testing all combinations of the pre-selected independent DEFs were efficient. As long as adjusted R² gets closer to 1.00, the p-value and the MAPE kept decreasing, coming increasingly close to zero (Figure 3). These were the criteria used to classify the best estimate model for each yield and quality parameter of VACR.
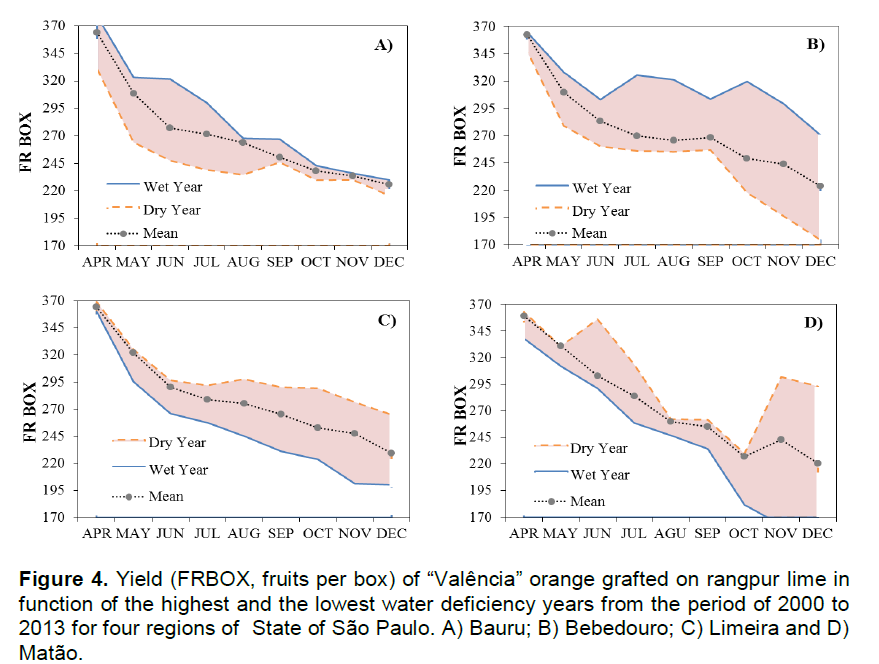
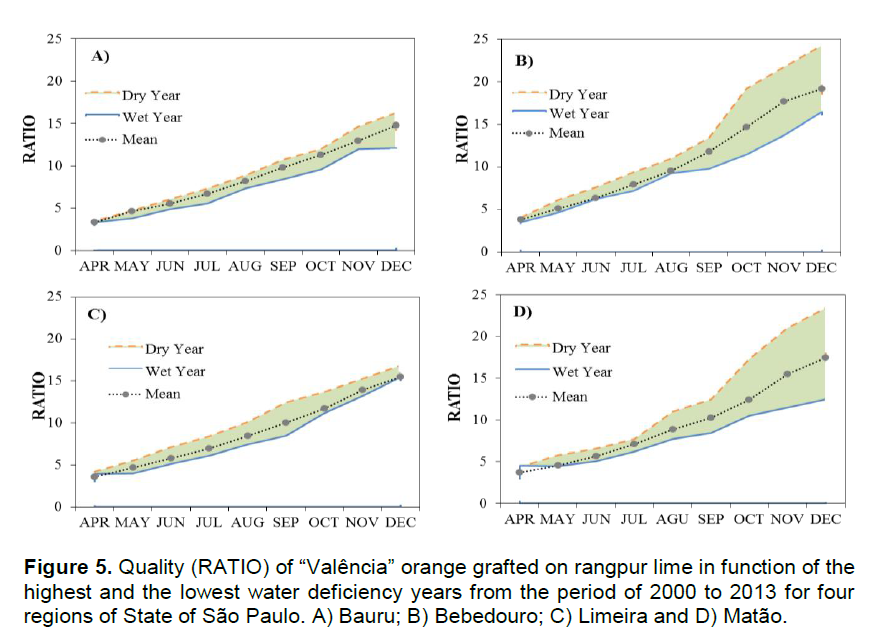
Analysis of available water variation at the studied regions proves a strong influence of DEF at yield (Figure 4) and quality (RATIO) (Figure 5) of VACR. Garcia-Tejero et al. (2011), had a similar view for the mediterranean conditions where the available water is the most limiting factor for plant development. For São Paulo, DEF is the most influent variable at flowering of oranges at mid-north state region and also the most active at central region, associated to low temperatures during flowering which result in reduced yield (Ribeiro et al., 2006).
Fruits per box (FRBOX) values were higher in April and reduce in December (maturity) due to the fruit size increase. In its turn, RATIO increase constantly up to the end of the year. This analysis proves that meteorological variables, especially the hydric balance elements as DEF have an interesting relation with yield and quality of VACR. An example of DEF influence at crops is demonstrated in the case of Bauru (BAU) and Bebedouro (BEB) that are regions with different characteristics where BAU have lowest temperature and lower DEF compared to BEB, however wet years (less DEF) favor yield increase at both regions. Limeira (LIM) and Matão (MAT) regions have intermediate values of DEF, being the FRBOX value higher at dry years. All the regions have different relations of increase or reduction of annual DEF, thereby an analysis were performed to quantify the influence of the annual water deficit variation and the responses this cause at average quality and yield of VACR, in annual scale (Table 2).
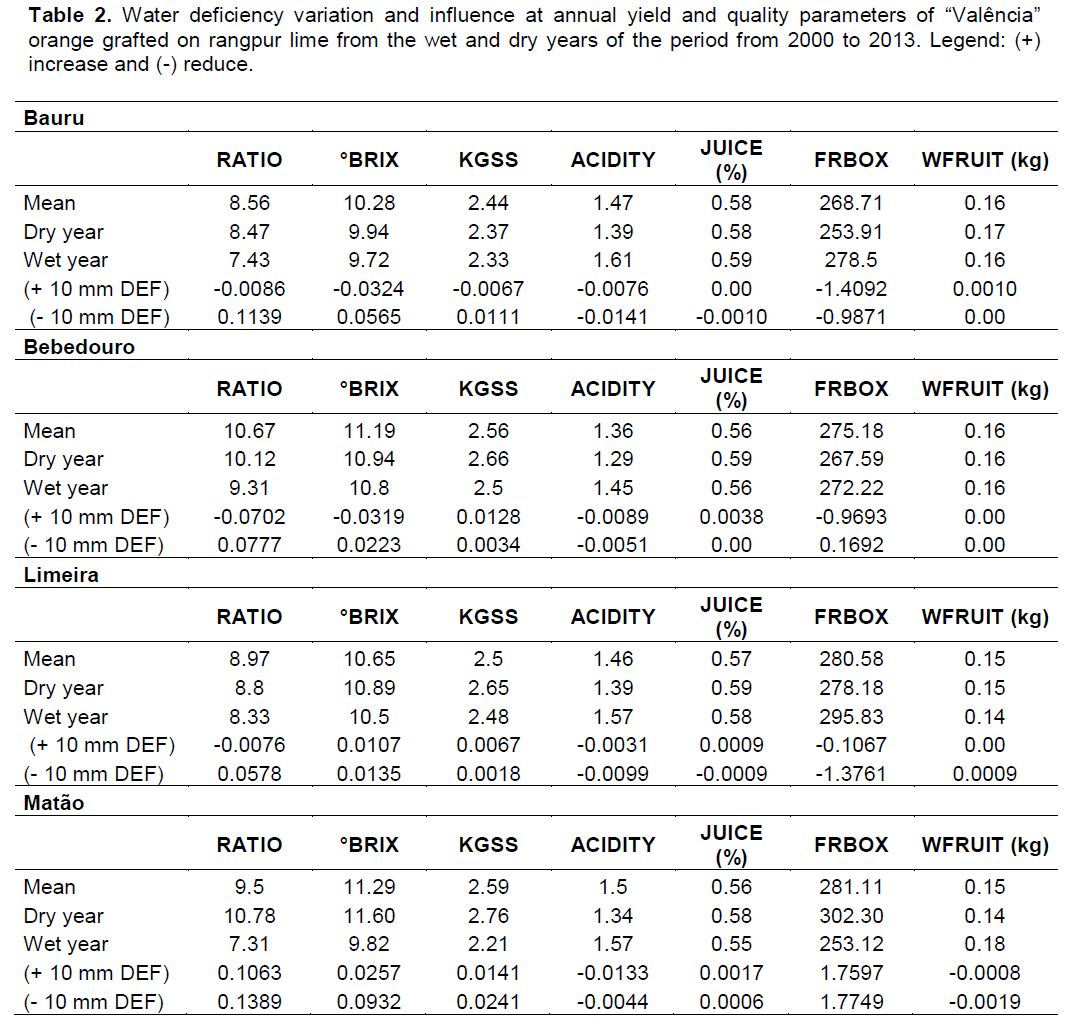
An evaluation of increase and reduction of 10 mm of annual DEF was made and how these variations affect the annual VACR yield and quality variability. The values of the parameters of yield and quality from the dry and wet years and the mean values of the period from 2000 to 2013 were used. São Paulo having’ a different topography and influence from air masses has a broad climatic diversity (Rolim et al., 2007). North regions have higher air temperatures and lower occurrence of rain during winter that are favorable for orange crops production, which is the case of Bebedouro (BEB) and Matão (MAT). The recent performance of the climatic variables at Matão put this region (Bauru and Limeira) suitable for the cultivation (Ribeiro et al., 2006).
At Bebedouro, every 10 mm of annual DEF increase results in a mean reduction of (-) 0.0702 annual RATIO, while for BAU and LIM the reduction is around 0.008. However, for MAT, the increase of 10 mm of annual DEF raises to 0.1063 points of RATIO. The maximum variation of DEF at BEB during the period of study (2000 to 2013) was at 2009/2010, with an increase of DEF of 253 mm which could reduce RATIO up to 1.77 points from a year to another. The minimized effect at BAU and LIM and the increase at MAT caused by the annual DEF variation can be due to the fact that these regions do not have water restrictions for orange crop production (Ribeiro et al., 2006). Reduced annual DEF of 10 mm, in other words, increased availability of water at the system for the plant expressed RATIO increase for all regions.
With regards to FRBOX, DEF effects were further stronger, even at regions without water restrictions for orange crop production (BAU and LIM); the reduction was significant. Each 10 mm of annual DEF increase result in a reduction of FRBOX at BAU, BEB and LIM in 1.4092, 0.9693 and 0.1067, respectively. Already at MAT, a climatic favorable region for orange crop production, each 10 mm of annual DEF increase, during the period of study, which leads to an average increase of 1.7597 FRBOX. For BEB, each increase of 10 mm of annual DEF may generate 0.97 fruits per box lose and the maximum variation (253 mm) can generate losses up to 24.36 fruits per box. The reduction of DEF, in other words, increase of available water, for BEB and MAT showed increase at FRBOX while that for BAU and mainly for LIM had opposite effect. For these regions without restrictions for orange crop production, the reduction of annual DEF could lead to losses at yield, perhaps because of rain during the maturity phase.
An exact quantity of water applied to fill the plants needs at each phenological phase comes as an alternative to improve the water use efficiency and minimize losses at yield, by using irrigation with regulated deficiency. One of the difficulties of those techniques is in quantifying the permissible water deficiency for each phase (Carr et al., 2012). Researches about stress tolerance mechanisms and the understanding of the interactions of those with the biotic factors are needed to help the citrus producers deal with stress problems that can result in positive or negative effects, depending on the phenological phase of the plant (Syvertsen and Garcia-Sanchez, 2014). The agrometeorological models developed in this paper relate the yield and quality parameters to the monthly DEFs of the regions (Figures 6, 7, 8 and 9), highlighting the phenological phases that are more sensitive to water stress by the use of adjusted coefficients; this can be a tool for quantify this tolerable DEF value for each phase during the plant cycle. For a better understanding of the limiting factors and estimation of yield and quality, parameters were established in multiple linear models with monthly DEFs as independent variables during the cycle of “Valência” orange.
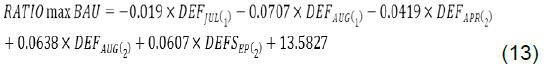
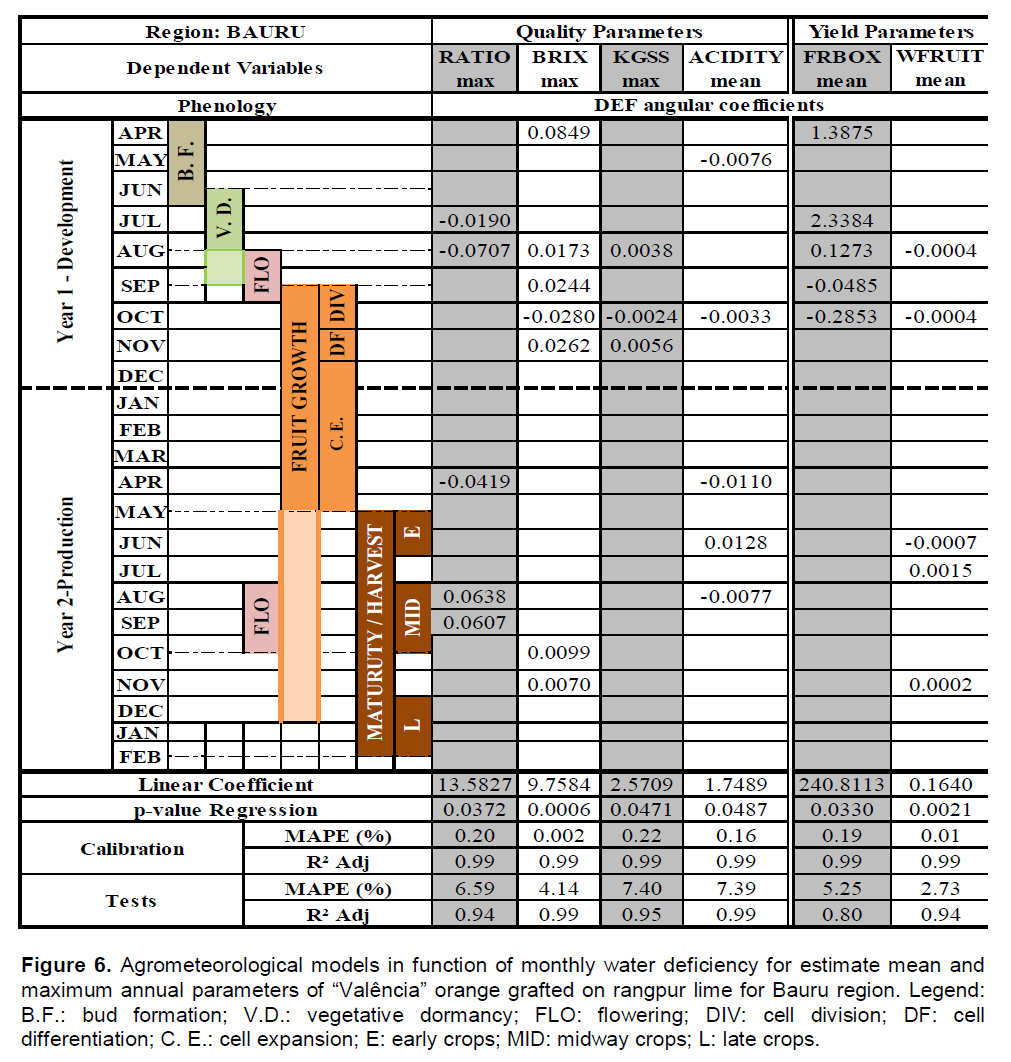
For BAU region (Figure 6) the estimation model of maximum RATIO (equation 13) had accuracy (MAPE) and precision (R² adj) satisfactory, with values of 6.59 and 0.94% respectively at validation and p-value of 0.0372. Considering the maximum RATIO value from the period (17.70 points), the percentage error of 6.59% represents an error by the modes of 1.16 points. At BAU, for all parameters, the most part of DEFs become concentrated at development year (1), between the phases of vegetative dormancy to the beginning of cell expansion. The yield (FRBOX) showed more sensibility to DEF at bud formation (April) and at vegetative dormancy (July), in which the angular coefficients were
higher. This result is in accordance with Camargo et al. (1999) that noticed that VACR yield is particularly sensitive to water deficiency at the beginning of flowering phase (August).
Where, (1) development year and (2) production year.
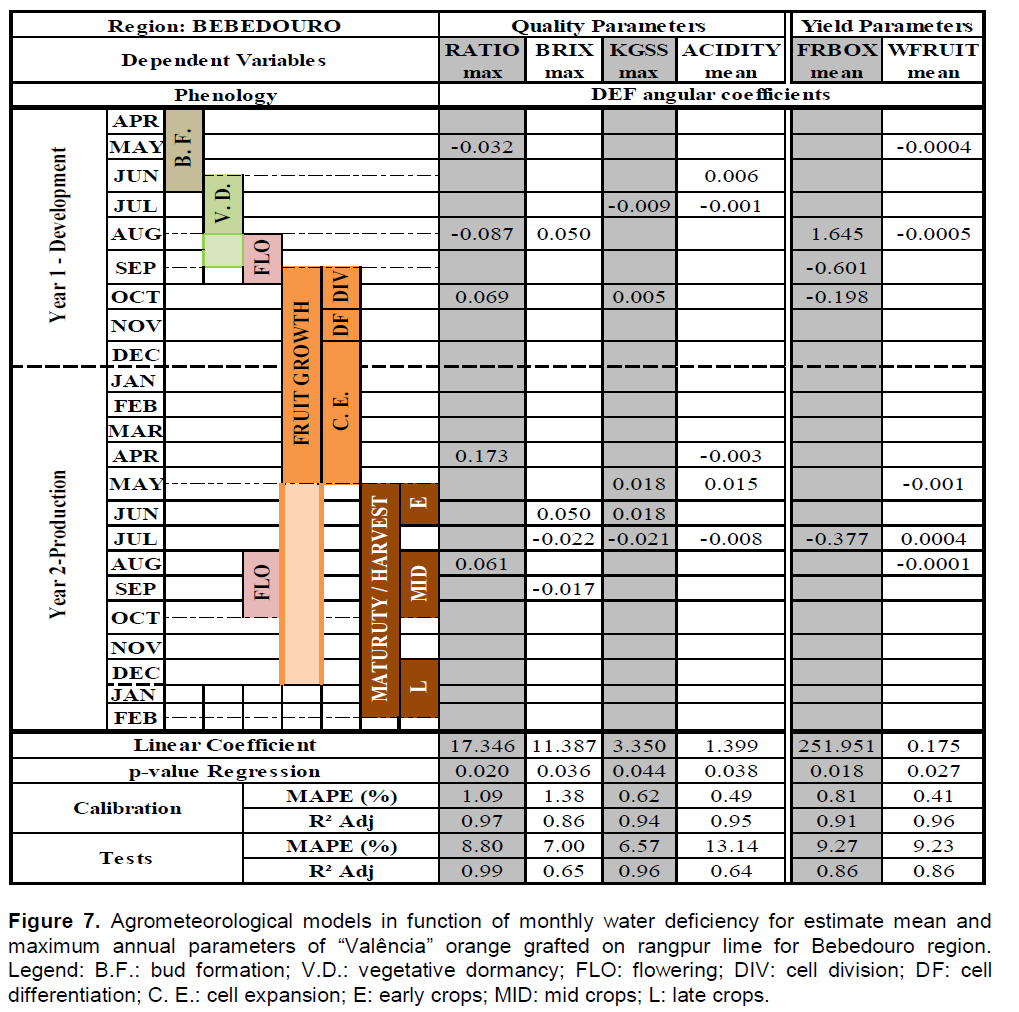
Bebedouro (Figure 7) had the same performance of BAU in relation of vegetative dormancy, being the most sensitivity phase to DEF, along with the start of flowering (August). This region in company of LIM and MAT had the main inducer flowering variable, the DEF (Ribeiro et al., 2006), being the performance of the flowering one of the responsible factors for losses or gains at yield. The estimation model of mean FRBOX for BEB was significant with p-value of 0.018 and accuracy and precision at validation of 9.27 and 0.86, respectively. For a mean yield of 275.18 fruits per box, the percentage error of 9.27% represents an error by the model of 25.5 fruits per box approximately.
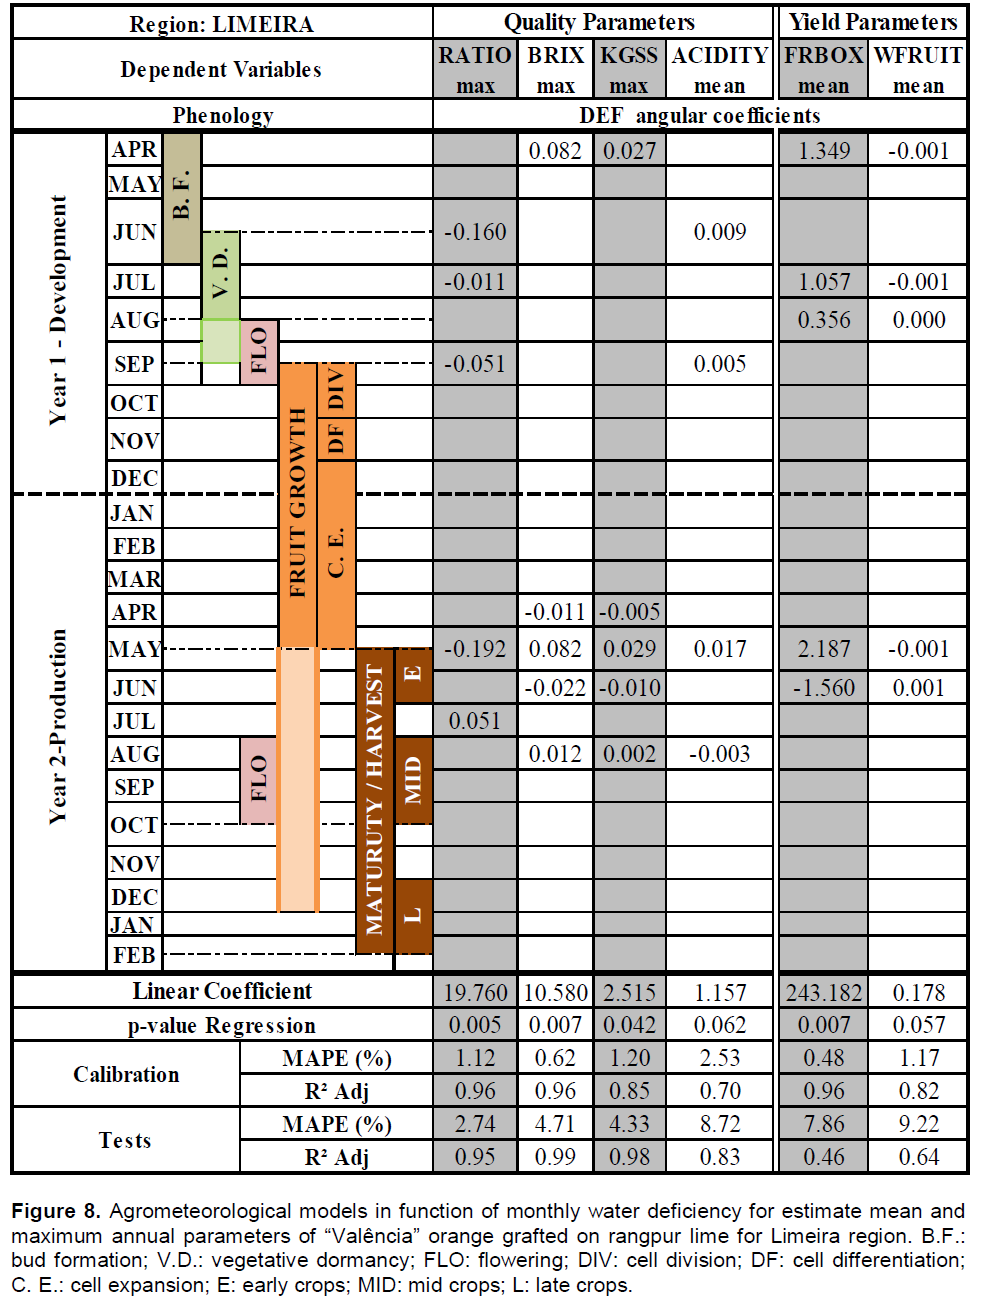
The performance of FRBOX at LIM (Figure 8) was practically the same as BAU, being the bud formation (April) and vegetative dormancy (July) phases, which are the ones that are more sensitive to DEF at the development year. Paulino et al. (2007), found that for LIM region the number of fruits per plant showed significant correlation with DEF of July to September of the development year. At production year (2) the most sensitive period for DEF at LIM is between the end of fruit growth and start of maturity (May and June). Water restrictions during these phases can lead to losses in yield and mainly in fruit weight (Garcia-Tejero et al., 2010). The estimation model for FRBOX at LIM showed high reliability, with p-value of 0.007, and accuracy (MAPE) and precision (R² adj) at validation of 7.86 and 0.46, respectively. For a mean yield of 280.58 fruits per box, the percentage error of 7.86% represents an error by the model of 22.05 fruits per box.
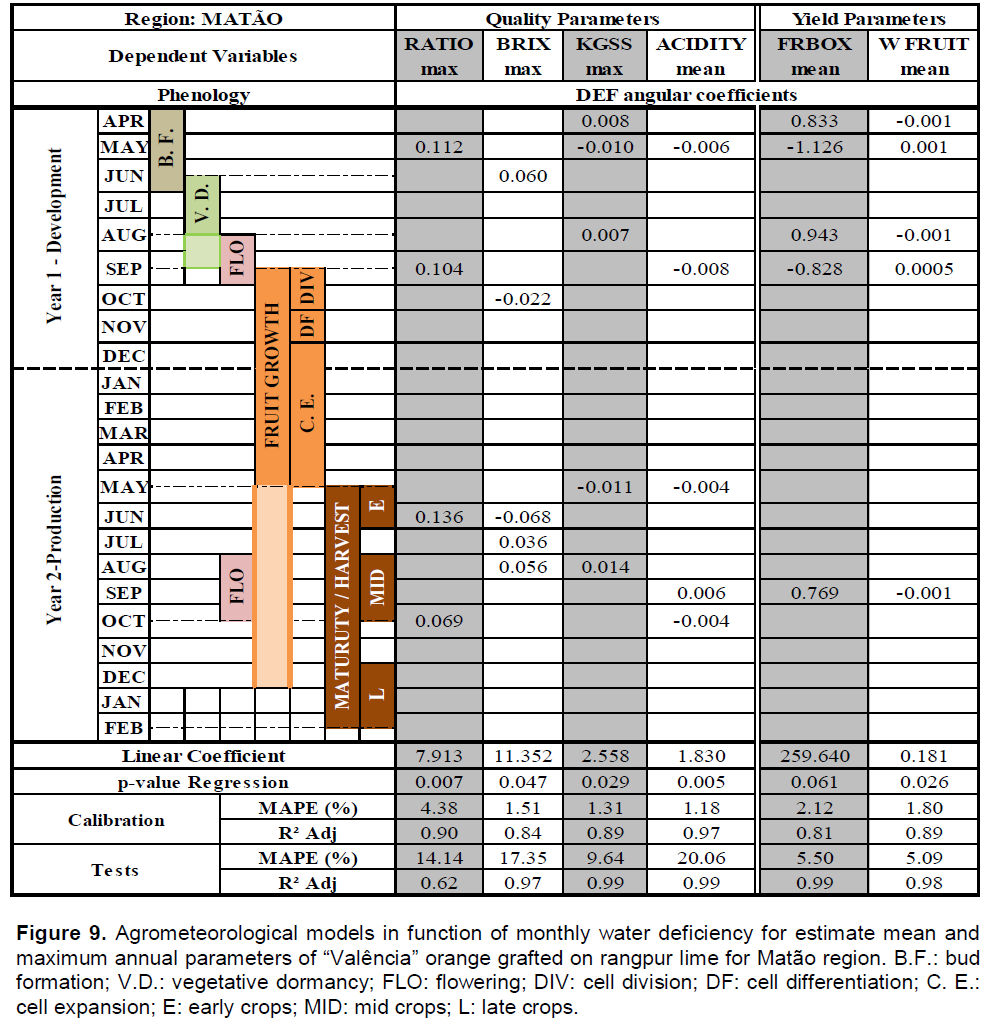
At MAT (Figure 9), the bud formation phase (April) was the most sensitive to DEF, the flowering (August to September) also presented sensibility to water deficiency. Martins snd Ortolani (2006), observed the same results about flowering of VACR at the region. The best estimation model of mean FRBOX was the one of this region with greater p-value of 0.061, great accuracy and precision values of 5.5 and 0.99%, respectively. The percentage error of 5.5% represents an error by the model of 15.15 fruits per box, considering an average yield of 281.11 fruits per box.
The water stress at production year (2) at the final phases of fruit growth and maturity (from May to September) were the ones that presented more effects of DEF on quality parameters (RATIO, BRIX and KGSS). Garcia-Tejero et al. (2010), affirmed that water deficiency at maturity affects the organoleptic characteristics of fruits and mainly the quality parameters. Briefly for BAU, the RATIO is the quality parameter that is more affected by DEF on maturity. For BEB and LIM are BRIX and KGSS and for MAT is BRIX.
Generally, at humid regions that have lower annual DEF, as BAU and LIM, the parameters estimation models of yield and quality were more accurate.
The ‘Valência’ orange grafted on rangpur lime had different sensitivities to the regional climate. Yield (FRBOX) was related to water deficiencies during bud formation (April) and vegetative dormancy (July) at Bauru and Limeira regions. The FRBOX at Bebedouro was more sensitive at the end of vegetative dormancy and the start of flowering (August) at bud formation (April). For the quality parameters (RATIO, BRIX and KGSS), all regions were more sensitive to water deficiency at maturity, especially Limeira. The agrometeorological models based on monthly water deficiencies showed good performance for yield and quality estimation of VACR for all regions.
The authors have not declared any conflict of interest.
REFERENCES
|
Araújo EC, Uribe-Opazo MA, Johann JA (2014). Modelos de regressão espacial para estimativa da produtividade da soja associada a variáveis agrometeorológicas na região do estado do Paraná. Eng. Agric. 34:286-299. |
|
|
|
Bozorg FAA, Kaveh F, Parehkar M, Manshouri M (2011). Evaluation and modification of model for the prediction of wheat yield at Iran region. Afr. J. Agric. Res. 6:300-306. |
|
|
Camargo MBP, Ortolani AA, Pedro Jr MJ, Rosa SM (1999). Agrometeorological model for yield prediction of orange cultivar 'Valência'. Bragantia. 58:171-178.
CrossRef |
|
|
Carr MKV (2012). The water relations and irrigation requirements of citrus (Citrus spp.): A review. Expl. Agric. 48:347-377.
CrossRef |
|
|
|
Coelho YS (2002). Frutas cítricas importadas no mercado de Salvador. Bahia Agric. 5:29-33. |
|
|
Garcia-Tejero I, Romero-Vicente R, Jiménez-Bocanegra JA, Martínez-García G, Durán-Zuazo VH, Muriel-Fernández JL (2010). Response of citrus trees to deficit irrigation during different phonological periods in relation to yield, fruit quality and water productivity. Agric. Water Manage. 97:689-699.
CrossRef |
|
|
Garcia-Tejero IF, Durán-Zuazo VH, Muriel-Fernández JL, Rodríguez-Pleguezuelo CR (2011). Water and sustainable agriculture. In: Springer Briefs in Agriculture. 1:1-94.
CrossRef |
|
|
Guimarães BVC, Donato SLR, Mais VM, Aspiazú I, Rodrgues MGV, Marques PRR (2013). Simple and multiple linear regressions for harvest prediction of Prata type bananas. Afr. J. Agric. Res. 8(48):6300-6308.
CrossRef |
|
|
|
Gujarati DN, Porter DC (2011). Basics Econometrics (5ª Ed.). Publisher Mcgraw-Hill/Irwin. 1:944. |
|
|
Martins NA, Ortolani AA (2006). Estimativa de produção de laranja Valência pela adaptação de um modelo agrometeorológico. Bragantia. 65:261-355.
CrossRef |
|
|
Monteiro LA, Sentelhas PC (2014). Calibration and testing of an agrometeorological model for the estimation of soybean n different Brazilian regions. Acta Sci. Agron. 36:265-272.
CrossRef |
|
|
|
Neves MF, Trombim VG, Milan P, Lopes FF, Cressoni F, Kalaki R (2010). O Retrato da Citricultura Brasileira. In: Neves MF (Coord.). In: ed.: Markestrat. 1:138 Disponível em: Panigrahi P, Sharme RK, Hasan M, Parihar SS (2014). Deficit irrigation scheduling and yield prediction of 'Kinnow' mandarin (Citrus reticulate Blanco) in a semiaris region. Agri. Water Manage. 140:48-60. |
|
|
Paulino ES, Mourão Filho FAA, Maia AHN, Avilés TEC, Dourado Neto D (2007). Agrometeorological models for 'valência' and 'hamlin' sweet oranges to estimate the number of fruits per plant. Sci. Agric. 64:1-11.
CrossRef |
|
|
Pérez-Pérez JG, Robles JM, Botía P (2009). Influence of déficit irrigation in phase III of fruit growth on fruit quality in 'lane late' sweet orange. Agric. Water. Manage. 96:969-974.
CrossRef |
|
|
|
Pio RM, Figueredo JO, Estuchi ES, Cardozo SAB (2005). Variedades Copas. In Mattos Jr D, Negri JD, Pio RM, Pompeu Jr J (Eds). In: Citros. Instituto Agronômico. 1:929. |
|
|
|
Reis EM (2008). A política fitossanitária de combate ao cancro cítrico na região de Presidente Prudente, SP. Rev. Fom. 2:179-188. |
|
|
Ribeiro VR, Machado CE, Brunini O (2006). Ocorrência de condições ambientais para indução do florescimento de laranjeiras no estado de São Paulo. Rev. Bras. Frutic. 28:247-253.
CrossRef |
|
|
Roccuzzo G, Villalobos FJ, Testi L, Fereres E (2014) Effects of water deficits on whole tree water use efficiency of orange. Agric. Water Manage. 140:61-68.
CrossRef |
|
|
Rolim GS, Camargo MBP, Lania DG, Moraes JFL (2007). Classificação climática de Koppen e de Thorntwaite e sua aplicabilidade na determinação de zonas agroclimáticas para o estado de São Paulo. Bragantia. 66:711-720.
CrossRef |
|
|
|
Rolim GS, Ribeiro RV, Azevedo FA, Camargo MBP, Machado EC (2008). Previsão do número de frutos a partir da quantidade de estruturas reprodutivas em laranjeiras. Rev. Bras. Frutic. 30:048-053. |
|
|
Santos MA, Camargo MBOP (2006). Parametrização de Modelo Agrometeorológico de estimativa de produtividade do cafeeiro nas condições do estado de São Paulo. Bragantia. 65:173-183.
CrossRef |
|
|
Syvertsen JP, Garcia-Sanchez F (2014). Mutiple abiotic stresses occurring with salinity stress in citrus. Env. Exp. Bot. 103:128-137.
CrossRef |
|
|
Thornthwaite CW (1948). An approach towards a rational classification of climate. Geograph. Rev. 38:55-94.
CrossRef |
|
|
|
Thornthwaite CW, Matter JR (1955). The Water Balance. Publications Climatol. 1:104. |
|
|
Volpe CA, Schoffel ER, Barbosa JC (2002). Influência da soma térmica e da chuva durante o desenvolvimento de laranjas 'Valência' e 'Natal' na relação entre sólidos solúveis e acidez e no índice tecnológico do suco. Rev. Bras. Frutic. 24:436-441.
CrossRef |
|
|
Xu L, Zhang WJ (2001) Comparison of different methods for variable selection. Analyt. Chim. Acta. 446:477-483.
CrossRef |