ABSTRACT
Simple sequence repeat (SSR) markers (36 microsatellite pairs) were used to assess genetic diversity among sixteen rice (Oriza sativa L.) cultivars from Iran, four from Uzbekistan, and one from Afghanistan, and to compare this diversity with that of three control cultivars including Nipponbare, Jasmine 85 and Basmati 370. Among the 36 microsatellite pairs, 31 produced polymorphisms ranging from 1 to 7 alleles (average = 3.72 per microsatellite). There were 134 alleles detected using all the SSR primers, 103 of which (76.9%) showed polymorphisms, while 31 did not. The genetic similarity coefficient among the 24 rice cultivars was 0.601. The genetic diversity revealed by this survey will be useful to designate the most appropriate parental cv. to initiate a breeding program aimed at developing new rice varieties with traits adapted for Middle Eastern agriculture.
Key words: Rice cultivars (cvs.), simple sequence repeat (SSR) marker, polymorphism information contents (PIC) value, and genetic similarity (GS), microsatellite.
Cultivated rice (Oryza sativa L.), which is grown worldwide is one of the most important cereals for human nutrition (Huang et al., 2012). Among major crops grown in Iran, rice is second crop after wheat. The prevalence of rice cultivation is due largely to the affordability of rice for people of all economic classes. To meet an anticipated future increase in demand, a rice breeding program is underway, focused on traits particularly desirable in Iranian cultivars. According to the International Rice Research Institute (http://irri.org/rice-today/irri-in-iran), breeding goals for Iranian rice include introduction of salt tolerance, resistance to sheath blight caused by
Rhizoctonia solani Kühn (teleomorph:
Thanatephorus cucumeris (A.B. Frank Donk), elimination of
chaulkiness in the kernels, and increased yield, especially for long grain cultivars and aromatic types called Sadri rice.
In the past, Iranian plant breeders chose parental materials for rice hybridization based on morphological and agronomic characteristics. Molecular marker technology, however, has improved breeders’ ability to accurately identify and characterize genetic resources. DNA markers use nucleotide sequences to identify species (Ganie et al., 2015) and microsatellites or single sequence repeats (SSRs) are extensively employed in plant genetics studies, using both low and high throughput genotyping approaches (Vieira et al., 2016). Polymorphic DNA was chosen to characterize rice germplasm because it satisfies these criteria. All molecular markers technique can be used for several different applications including: germplasm characterization, genetic diagnostics, characterization of transformations, study of genome organization, marker assisted selection (MAS) and phylogenic analysis (Mishra et al., 2014). In this study, genetic diversity was determined among
24 rice cultivars using simple sequence repeats (SSRs) to identify heterotic groups favorable for use in rice cross-hybridization.
Newly developed single nucleotide polymorphism (SNP) markers are effective in detecting genetic diversity (Ren et al., 2013). SSR and single nucleotide polymorphic (SNP), the two most robust markers for identifying rice varieties were compared for assessment of genetic diversity and population structure (Singh et al., 2013). Both genetic diversity and population structure analysis improved varieties from landraces and local selections (Kumbhar et al. 2015). The study of genetic diversity is important on crop breeding program for selection of suitable diverse parents (Tidke et al. 2014). The objectives were determined genetic diversity using SSR markers to investigate interrelationship among the genotypic variation.
Plant materials
This study was based on multiple sources of germplasm: sixteen Iranian cvs. [Fajr, Shafagh, Pouya, Shiroudi, Tabesh, Nemat, Neda, (from Mazandaran province), Kadus, Saleh, Dorfak, Sepidroud, Khazar (from Gilan province), Zayandehroud, Sazandegi (from Isfahan province), Doroudzan, and Ghasredashti (from Fars province)], one Afghan cv. [Pashadikonar], four Uzbek cvs. [Gulnar, Shortanby, Nokos-2, and Nokos-70], one Japanese cv. [Nipponbare], one Indian cv. [Basmati], and one Thai cv. [Jasmine 85]. The Iranian cvs. were provided by the Rice Research Institute Iran (RRII), located in Amol City near the Caspian
Sea .
DNA extraction and SSR primers
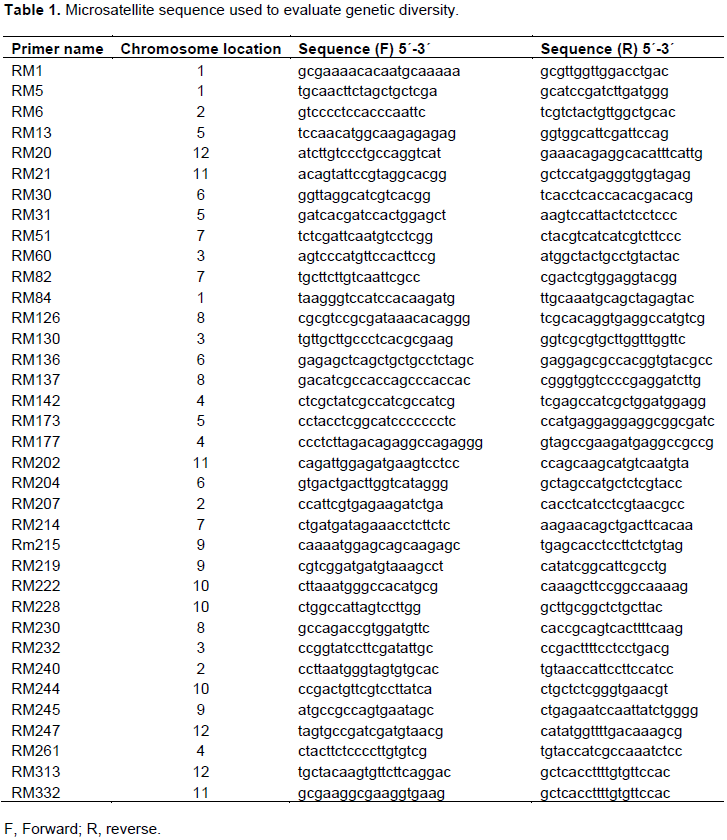
Young leaves (100 mg/sample) were ground to fine powders in liquid nitrogen. DNA was extracted following the CTAB protocol introduced by Doyle and Doyle (1987). Primers (Table 1) for 36 microsatellites were downloaded from: http://www.gramene.org/db/markers/marker_view and used to assess genetic diversity among rice cultivars.
PCR analysis
PCR was performed in a 12.5 μL reaction mixture containing 7.7 μL double distilled water, 0.5 unit Taq DNA polymerase, 10 ng genomic DNA, 1.25 μL 10X buffer, 1 μL 50 mM MgCl2, 1 μL of 5 mM DNTPs, 5 pM of each primer. PCR conditions were as follows: denaturation at 94°C for 5 min followed by 35 cycles (94°C for 1 min, 55°C for 1 min, 72°C for 2 min), and final elongation at 72°C for 5 min. PCR products were separated by electrophoresis on a 1.5% agarose gel. One Kb mass RullerTM was used to estimate the fragment sizes. The gel was stained with ethidium bromide for 20 min, and then photographed under UV light.
Data analysis
In this study, microsatellite band fragments were analyzed by the binary procedure. The presence and absence of SSR amplified bands characteristic of each genotype were scored 1 for presence and 0 for absence of the band. The polymorphism information content (PIC) value was calculated for each microsatellite locus using the following formula (Nei, 1970):
PIC = 1 - ∑ xi2
where xi is the frequency of i allele. Genetic similarity (GS) was calculated using this formula (Nei and Li. 1979):
GSij = 2Nij / Ni + Nj
Where Nij is the number of bands present in both genotypes i and j, Ni is the number of bonds present in genotype i, and Nj is the number of bonds present in genotype j. Microsatellite markers were clustered using the unweighted pair group method (UPGMA) with Statistical software.
SSR analysis
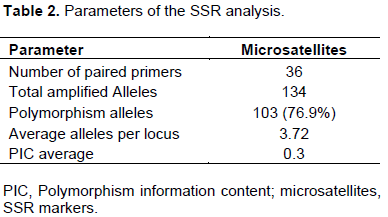
Allele variation of SSR markers was determined among the 24 rice cvs; 31 polymorphic bands, which ranged from 1 to 7 alleles (average = 3.72) per microsatellite, were detected by the 36 microsatellite marker pairs. These SSRs detected a total of 134 alleles, of which 103 (76.9%) showed polymorphisms, while 31 alleles (23.1%) did not (Table 2).
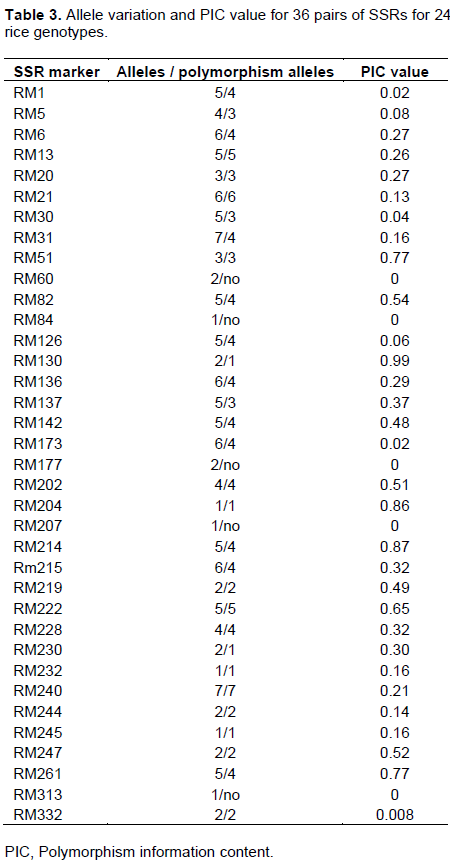
The polymorphism information content (PIC), is defined as the expected fraction of informative offspring from a cross. The higher the PIC, the more likely the gene for a particular trait would be co-inherited with the SSR marker. PIC values were calculated for the rice cvs. and the SSRs used in this study. The values ranged from 0.008 to 0.99 (average = 0.3) for those SSRs that produced polymorphic bands, while the non-polymorphic markers that produced a PIC value of 0. cvs. with the lowest PIC values were RM332 (0.008), RM1 and RM173 (0.02), RM30 (0.04), and RM126 (0.06); cvs. With the highest PICs were RM51and RM261 (0.77), RM204 (0.86), RM124 (0.87), and RM130 (0.99). The data are shown in Table 3.
Genetic similarity
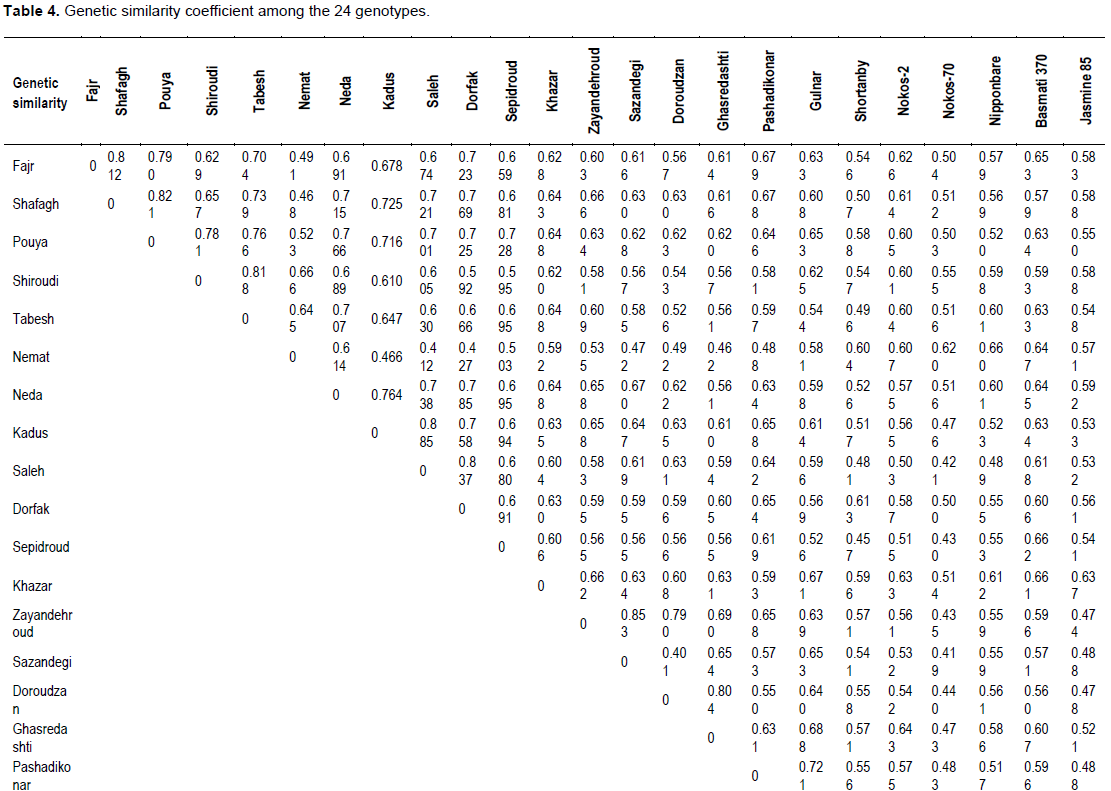
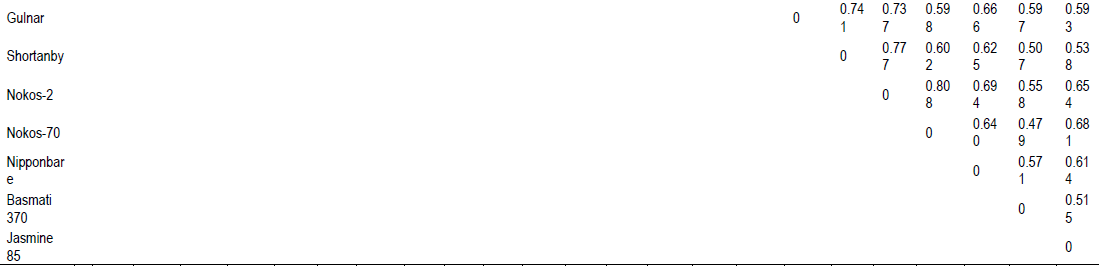
The 36 SSRs were used to estimate genetic similarity among 24 rice genotypes (Table 4). The average value was 0.601. The minimum and maximum genetic similarity coefficients were 0.401 and 0.885, respectively. The highest similarity coefficients are: Tabesh - Neda (0.707), Pashadikonar - Golnar (0.721), Golnar - Shortanby (0.741), Shortanby - Nokos-2 (0.777), Pouya - Shiroudi (0.781), Neda - Dorfak (0.785), Doroudzan - Ghasredashti (0.804), Nokos-2 - Nokos-70 (0.808), Fajr – Shafagh (0.812), Shiroudi - Tabesh (0.818), Pouya - Shafagh (0.821), Saleh – Dorfak (0.837), Zayandehroud - Sazandegi (0.853), and Kadus - Saleh (0.885). The lowest genetic similarity coefficients are: Tabesh - Shortanby (0.496), Fajr - Nemat (0.491), Pashadikonar - Nokos-70 (0.483), Nokos-70 - Basmati370 (0.479), Kadus - Nokos-70 (0.476), Ghasredashti - Nokos-70 (0.473), Shafagh - Nemat (0.468), Doroudzan - Nokos-70 (0.440), Zayandehroud - Nokos-70 (0.435), Sepidroud - Nokos-70 (0.430), Saleh - Nokos-70 (0.412) and Sazandegi - Doroudzan
(0.401). The smaller the genetic distance value, the more closely related the parents of a cross are.
Cluster analysis
Cluster analysis, based on informative SSR alleles, classified 24 rice genotypes into seven groups (Figure 1). Group 1: Fajr and Shafagh, Group 2: Kadus, Saleh and Dorfak, Group 3: Pouya, Tabesh, Neda, and Sepidroud, Group 4: Shiroudi and Nemat, Group 5: Gulnar and Shortanby, Group 6: Nokos-2, Nokos-70, Jasmine 85 and Nipponbare, Group 7: Zayandehroud, Sazandegi and Doroudzan. In this comparison, four cvs. did not fall into any Group: Basmati 370 from India, Pashadikonar from Afghaniztan, and Khazar and Ghasredashti, which are from two different regionsin Iran. Native Iranian cvs. were distributed across all seven groups.
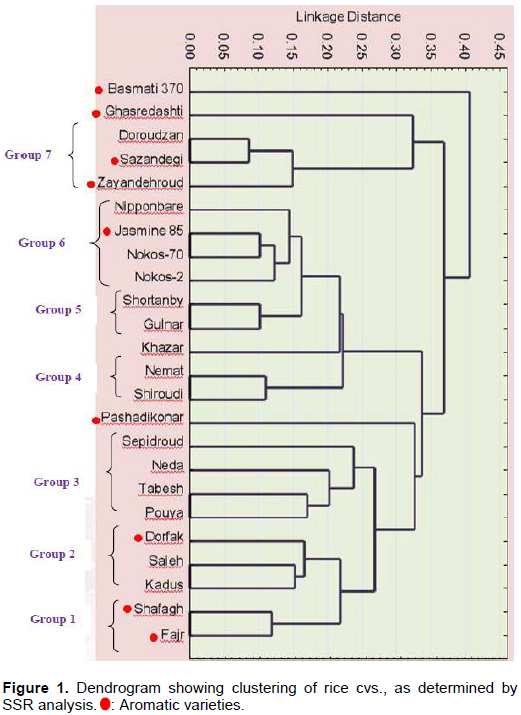
Cluster analysis revealed that aromatic cvs. from Iran are genetically different from standard aromatic cvs. Yet, the Iranian aromatic cvs. themselves clustered in different groups. For example, Zayandehroud, Sazandegi (from one region in Iran) clustered in Group 7, whereas Fajr and Shafagh (from the same region) clustered in Group 1. Basmati 370 was genetically distinct from all other cvs., since it did not fall into any of the Groups, even though it is considered a standard aromatic variety. Two other aromatic cvs. Ghasredashti and Pashadikonar (an aromatic rice from Afghanistan), also failed to be grouped (Figure 1).
Many previous studies have shown that both morphological and SSR markers are useful for analyzing genetic diversity in rice and other crops. Single-nucleotide polymorphisms have become the genetic markers of choice in various genetic, ecological, and evolutionary studies (Tang et al., 2016). In the present study, SSR markers were used to detect genetic variation among 24 rice genotypes; in a separate analysis (data not shown here), morphological features were combined with the SSR results, and it was found that there was general agreement between the two sets of data with respect to pair-wise genetic distances among the rice cvs.
In cases of disagreement between the datasets, greater significance was attached to the SSR marker analysis. There are several reasons for this: (1) morphological features are phenotypes, whereas SSRs are genotypes; morphological similarities may obscure genetic differences. (2) Many
morphology traits are controlled by multiple genes; hence a morphological variation alone does not indicate the number of genes involved, or the effects of pleiotropy, epitasis and the environment. (3) SSRs are distributed across the entire genome, whereas morphological features are lesscomprehensive. (4) SSRs are more easily scorable than most morphological features, (5) SSR detection is highly reproducible and can reveal intraspecific homology. (6) The abundance of SSRs enhances the likelihood of linkage to specific agronomic traits; for instance, SSR results revealed large genetic distances between certain landraces of rice, thus evaluation of genetic diversity and genetic structure in crops has important implications for plant breeding programs and the conservation of genetic resources (Ren et al., 2013). The result of cluster analysis revealed that there was to significant correlation between the aromatic feature and genetic similarity.
DNA polymorphisms have proven to be powerful tools for genotyping, and for estimating genetic diversity. Among molecular markers, SSRs have been used to indicate genetic diversity of crop germplasms and have been widely applied in the genetic diversity analysis (Salgotra et al. 2015). The importance of plant genetic diversity is now being recognized as a specific area since exploding population with urbanization and decreasing cultivable lands are the critical factors contributing to food insecurity in developing world (Govindaraj et al., 2015). SSR-based analysis of genetic diversity can be used to identify duplicate germplasms in morphological similar accessions.
This study was set in the context of previously reported crop breeding programs. Genetic diversity is the main source of variability in any crop improvement program and it serves as a reservoir for identifying superior alleles controlling key agronomic and quality traits through allele mining association mapping (Nachimuthu et al., 2015). The microsatellite DNA marker has been the most widely used, due to its easy application by simple PCR, followed by a denaturing gel electrophoresis for allele size determination, and to the high degree of information provided by its large number of alleles per locus (Mishra et al., 2014). The goal of our work was to identify genetic variation within a rice germplasm collection, so that desirable parents could be chosen for rice breeding programs in Iran. The relatively low genetic similarity (average = 0.601) that we found indicated high genetic diversity in our collection; thus these rice cvs. are a good source from which to choose genetically dissimilar parents to be cross-bred in a program aimed at improving commercial Iranian rice. For example, cvs. Khazar and Ghasredashti, which are genetically far apart, might be favorable parental materials for making new varieties. It is worth mentioning that cross hybridization is pivotal between genotypes of different clusters to improve desirable commercial varieties. Genome level profiling of germplasm collections in crop species is essential to identify accessions for their efficient use in crop improvement programs (Choudhury et al., 2014). Kioko et al. 0(2015) mentioned that the assessment of genetic diversity is crucial in germplasm characterization. Toward this end, the present results emphasize the importance of Iranian rice germplasm collection, conservation and maintenance. The focus should be on introduction of more diverse cultivated rice and any other heterotic materials that can be used for hybridization. As Iranian rice breeding programs are mobilized, it should be emphasized that each succeeding breeding generation should be monitored by molecular analysis; this will require the use of more primer combinations and introduction of additional molecular markers.
The authors have not declared any conflict of interests.
REFERENCES
|
Choudhury DR, Singh N, Singh AK, Kumar S, Srinivasan K, Tyagi RK, Ahmad A, Singh NK, Singh R (2014). Analysis of genetic diversity and population structure of rice germplasm from north-aastern region of India and development of a core germplasm set. Plos one 9(11):e113094.
Crossref
|
|
|
|
Ganie SH, Upadhyay P, Das S, Sharma MP (2015). Authentication of medicinal plants by DNA markers. Plant Gene 4:83-99.
Crossref
|
|
|
|
|
Govindaraj M, Vetriventhan M, Srinivasan M (2015). Importance of genetic diversity assessment in crop plants and its recent advances: an overview of its analytical perspectives. Genet. Research Int. 14p.
Crossref
|
|
|
|
|
Huang X, Kurata N, Wei X, Wang ZX, Wang A, Zhao Q, Zhao Y, Liu K, Lu H, Li W, GuoY, Lu Y, Zhou C, Fan D, Weng Q, Zhu C, Huang T, Zhang L, Wang Y, Feng L, Furuumi H, Kubo K, Miyabayashi T, Yuan X, Xu Q, Dong G, Zhan Q, Li C, Fujiyama A, Toyoda A, Lu T, Feng Q, Qian Q, Li J, Han B (2012). A map of rice genome variation reveals the origin of cultivated rice. Nature 490:497-503.
Crossref
|
|
|
|
|
Kioko WF, Musyoki MA, Piero NM, Muriira KG, Wavinya ND, Rose L, Felix M, Ngithi NL (2015). Genetic diversity studies on selected rice (Oryza sativa L) populations based on aroma and cooked kernel elongation. J. Phylogen. Evol. Biol. 3:158.
Crossref
|
|
|
|
|
Kumbhar SD, Kulwal PL, Patil JV, Sarawate CD, Gaikwad AP, Jadhav AS (2015). Genetic diversity and population structure in landraces and improved rice varieties from India. Rice Sci. 22(3):99-107.
Crossref
|
|
|
|
|
Mishra KK, Fougat RS, Ballani A, Thakur V, Jha Y, Bora M (2014). Potential and application of molecular markers techniques for plant genome analysis. Int. J. Pure Appl. Biosci. 2(1):169-188.
|
|
|
|
|
Nachimuthu VV, Muthurajan R, DuraialagurajaS, Sivakami R, Pandian BA, Ponniah G. Gunasekarn K, Swaminathan M, Suji KK, Sabariappan R (2015). Analysis of population structure and genetic diversity in rice germplasm using SSR markers: An initiative towards association mapping of agronomic traits in oryza sativa. Rice 8:30.
Crossref
|
|
|
|
|
Nei M (1970). Effective size of human populations. Am. J. Hum. Genet. 22(6):694-696.
|
|
|
|
|
Nei M, Li W (1979). Mathematical model for studying genetic variation in terms of restriction endonucleases. Proc. Natl. Acad. Sci. 76(10):5269-5273.
Crossref
|
|
|
|
|
Ren J, Sun D, Chen L, You FM, Wang J, Peng Y, Nevo E, Sun D, Luo MC, Peng J (2013). Genetic diversity revealed by single nucleotide polymorphism markers in a worldwide germplasm collection of durum wheat. Int. J. Mol. Sci. 14:7061-7088.
Crossref
|
|
|
|
|
Salgotra RK, Gupta BB, Bhat JA, Sharma S (2015). Genetic diversity and population structure of Basmati rice (Oryza sativa L.) germplasm collected from north western Himalayas using trait linked SSR markers. Plos one 10(7):e0131858.
Crossref
|
|
|
|
|
Singh N, Choudhury DR, Singh AK, Kumar S, Srinivasan K, Tyagi RK, Singh NK, Singh R (2013). Comparison of SSR and SNP markers in estimation of genetic diversity and population structure of Indian rice varieties. Plosone 8(12):e84136.
Crossref
|
|
|
|
|
Tang W, Wu T, Ye J, Sun J, Jiang Y, Yu J, Tang J, Chen G, Wang C, Wan J (2016). SNP-based analysis of genetic diversity reveals important alleles associated with seed size in rice. BMC Plant Biol. 16:93.
Crossref
|
|
|
|
|
Tidke SA, Kiran S, Harke SN (2014). Analysis of genetic diversity in 20 cotton germplasm lines using random amplified polymorphic DNA marker. Asian J. Plant Sci. 13(4-8):184-189.
Crossref
|
|
|
|
|
Vieira MLC, Santini L, Diniz AL, Munhoz CF (2016). Microsatellite markers: what they mean and why they are so useful. Genet. Mol. Biol. 39(3):312-328.
Crossref
|
|