Full Length Research Paper
ABSTRACT
Fifteen improved and two local genotypes of Vigna unguiculata were evaluated for their performance in grain yield, yield components and yield stability from 2016 to 2018. Experiments were laid out in a Randomised Complete Block Design, with three replications. Data were collected on grain yield and yield components and subjected to analysis of variance (ANOVA). Stability analysis for grain yield was conducted using Francis and Kannenberg’s genotype-grouping technique. Results of combined ANOVA revealed highly significant (p<0.001) differences among genotypes, and across years for studied traits, except for days to physiological maturity, with non-significant yearly variations. Genotype by year interactions were non-significant except for number of seeds per pod, days to 50% flowering and hundred seed weight. Genotype, IT08K-126-19, gave the highest mean grain yield (3611 kgha-1), while “Akidi elu” gave the least (1695 kgha-1). Genotypes, IT08K-126-19, IT07K-210-1-1 and IT09K-456 gave higher and more stable grain yields. Meanwhile, IT08K-180-11, IT10K-837-1 and “Akidi elu”, gave lower and unstable yields. The results revealed that sufficient variability exists among genotypes, which can be exploited in breeding programmes. Genotypes with high and stable yields can be released to farmers to boost productivity.
Key words: Vigna unguiculata, genotypes, yield, yield components, yield stability.
INTRODUCTION
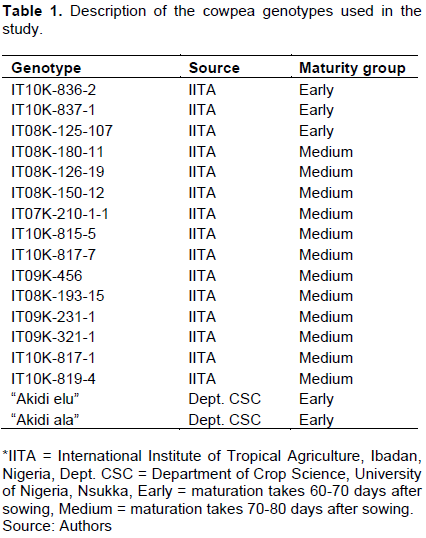
Cultivated cowpea (Vigna unguiculata (L.) Walp.) is a diploid (2n=2x=22 chromosomes), self-pollinated annual crop of the family Fabaceae, subfamily Faboideae, tribe Phaseoleae, subtribe Phaseolinae, genus Vigna and section Catiang (Boukar et al., 2018). The origin of the species is controversial, however substantial evidence alludes to West and Central Africa (Xiong et al., 2016). It is widely grown in the tropics and subtropics, and thrives on well drained, sandy loam to clay loam soil within a pH of 6 to 7. Cowpea is a warm weather and a relatively drought tolerant crop that grows up to 80 cm to 2 m tall and exhibits a variety of growth habits ranging from erect, semi-erect, prostrate to climbing. Genotypes are described as early, medium, or late maturing, when pods ripen within 60 to 70 days, 70 to 80 days and above 90 days after sowing (Alercia, 2011; Aliyu and Makinde, 2016). Eight to eighteen seeds are contained in a pod, and vary in size depending on the genotype. Henshaw (2008) classified seeds as small, medium, large or very large, when the weight of one hundred seeds pulled from a seed lot, was between 10 to 15.1 g, 15.1 to 20 g, 20 to 25 g, or greater than 25 g, respectively.
The crop and grain have numerous health benefits, soil fertility amendment properties, prospects for contributing to food and feed security, improvement in livelihood and sustainability in income generation of resource poor households (Tariku, 2018). Cowpea is mostly grown for its grain, which is considered the most economic part of the crop. Global production of cowpea grain is estimated at 6.5 million metric tonnes on about 14.5 million hectares, with countries like Nigeria, Niger Republic, Burkina Faso and Brazil being the major producers (FAOStat, 2017).
Statement of the problem
Vast literature documented on its importance and production, indicate that grain yield estimates are still far below estimates to meet growing population demands (Horn et al., 2017). Several findings have implicated the unavailability of seeds of improved cultivars, unfavourable climatic conditions, diseases, insect pests and parasitic weeds, as major causes of the low production and productivity observed in grain cowpea (Boukar et al., 2018; Carvalho and Halecki, 2021). Horn et al. (2017) reported grain yield ranging from 0.10 to 0.60 tha-1 which were far below potentially attainable yields of 1.5 to 3.0 tha-1. Ezeaku (2013) found out that grain yield in farmers’ fields in Nsukka and its environs were as low as 44.4 to 470 kgha-1 and noted that most of the varieties cultivated were unimproved, and that even the improved ones in use were acquired more than a decade ago. Evaluation of cowpea germ-plasm for their performance in grain yield and yield related traits is crucial for selection of superior genotypes in grain yield improvement programmes. Tariku et al. (2018) observed that the performance of a genotype is influenced by its genetic make-up, the growing environmental conditions and its interactions with the environment. The environment consists of biophysical factors that affect the growth and development of a genotype, and often, variations in the environment, exert changes in the phenotypic expression of traits; a phenomenon known as phenotypic plasticity (Bustos-Korts et al., 2018).
Germ-plasm evaluation studies focus mainly on the performance of genotypes across locations. However, the implications of genotype × year interactions cannot be overlooked, as such interactions when significant, undermine response to selection in breeding programmes (Tariku et al., 2018). This explains why, the exhibition of phenotypic plasticity across environments (years) poses a major limitation in the selection of superior parent genotypes for achievement of genetic gains in cowpea improvement programmes (Bustos-Korts et al., 2018).
For evaluation studies conducted in the same location, the inconsistencies in genotype performance across years is associated with year to year fluctuations in growing conditions (Boukar et al., 2018). Changes in weather such as, amount and distribution of rainfall and temperature, relative atmospheric humidity, and incidence and severity of pests and diseases, are known to affect yield drastically (Boukar et al., 2018). Studies on genotype by year interactions enable breeders to assess the relative performance and stability of a genotype in yield and yield related traits. Silva et al. (2016) further intimated that analysis for yield stability is crucial in the identification of genotypes with predictable performances for reliable recommendations. Francis and Kannenberg (1978) developed a stability analysis approach which used the coefficient of variation as a measure of stability. Thus, the ability of a given genotype to take advantage of a set of environmental conditions and to show highly predictable performance even under quite distinct environmental conditions, are resourceful features in predicting response to selection in crop improvement (Silva et al., 2016).
The objectives of this study were to evaluate improved and local cowpea genotypes for their performance in grain yield and yield components for three years 2016 to 2018, to select superior parents, that could constitute a base population for improvement, and to identify genotypes that can be released to farmers to complement existing ones.
MATERIALS AND METHODS
Experimental site, treatment and design
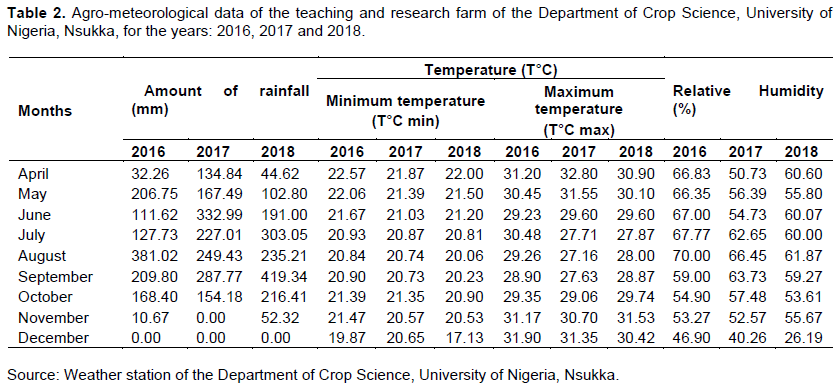
The evaluations were carried out at the Teaching and Research Farm of the Department of Crop Science, Faculty of Agriculture, University of Nigeria, Nsukka, located on latitude 06°52′N; longitude 07°24′E, at an altitude of 447.2 m above sea level (Uguru et al., 2011). Nsukka is in the derived savannah region of Enugu State, South-eastern, Nigeria. The soil has a characteristic sandy clay texture and a pH range of 4.1 to 5.1 (Kayode et al., 2019). Atmospheric relative humidity and temperature ranges are indicated in Table 2. The bimodal nature of rainfall in this region gives room for two cropping seasons: the early and late cropping seasons. The former starts from April to July, with rainfall peaks in June, followed by a transition in August, locally called “August break”. The latter commences in August, and the rains resume fully in September, transiting to droughts at the onset of dry season in November (Uguru et al., 2011).
Field evaluations were conducted in the years 2016, 2017 and 2018, during the late planting season (August-November). An area of 2100 m2 was prepared accordingly and a strip blanket application of poultry manure at a recommended rate of 3 tha-1 a week before sowing. Treatments (seventeen genotypes) were laid out in a randomized complete block design in three replications, on a plot size of 5 m × 3 m. Seeds were hand sown by placing 2 seeds per hole at a row spacing of 0.75 m and plant spacing of 0.5 m. After emergence, seedlings were thinned to one seedling per stand, giving a plant density of 26,667 plants ha-1. At four weeks after sowing, NPK, 15:15:15, was applied at the recommended rate of 100 kgha-1. Weeding was done manually when due. A systemic insecticide, Cyperforce® was applied as recommended, at flowering and pod formation stage against aphids, thrips, leaf defoliators and a complex of pod sucking bugs.
Data collection
Data were collected on the following cowpea descriptors as outlined by Alercia (2011). Number of days to 50% flowering and 95% physiological maturity were recorded on plot basis. Number of pods per plant, number of seeds per pod, hundred-seed weight (g/100 seeds), dry plant biomass (g) and grain yield (g/plant) were obtained on plant basis, and extrapolated to kilograms per hectare (kgha-1). Harvest index was estimated by dividing grain yield with dry plant biomass yield and expressed as a percentage.
A description of the cowpea genotypes used in the study is presented in Table 1.
Statistical analysis
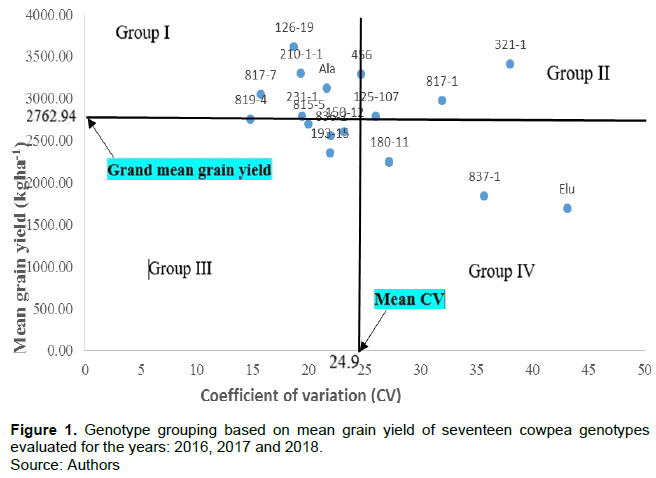
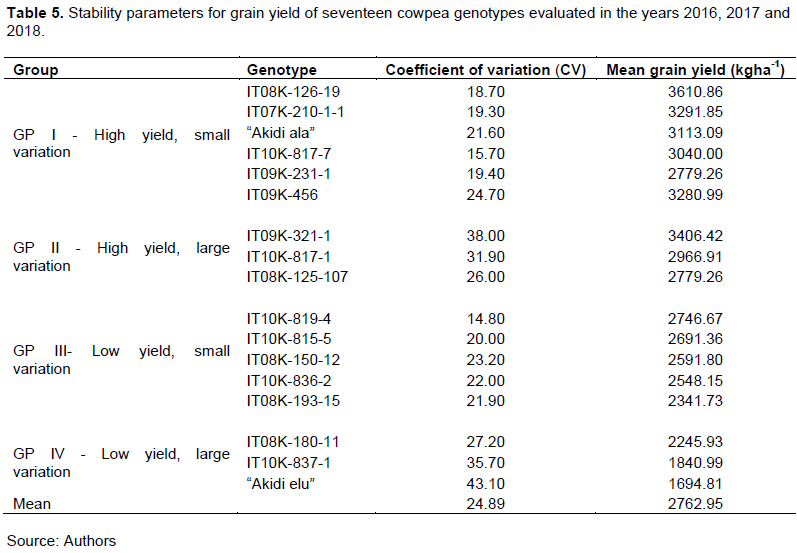
Data were subjected to analysis of variance (ANOVA) using GenStat software Discovery Edition 10.3. Significant differences between treatment means were separated using Fisher’s least significant difference (F-LSD) at 1% probability level. Data were equally subjected to a genotype-grouping technique using stability parameters such as coefficient of variation (CV) and mean grain yield, to assess the stability of genotypes in their performance in grain yield across years, following the method outlined by Francis and Kannenberg (1978). Thus, the coefficient of variation in grain yield and the mean grain yield for each genotype across the three years were determined using GenStat software. The mean grain yield for each genotype was plotted against the coefficient of variation (CV), using a scatter plot on an Excel spreadsheet (Figure 1). Two lines extending from the point of intercept (with coordinates-mean CV, grand mean grain yield), to the X and Y-axis, separated the genotypes into four groups. According to these authors, genotypes with mean grain yield above the grand mean grain yield line were considered to be high-yielding, while genotypes with mean grain yield below the line were said to be low-yielding. Meanwhile, genotypes with coefficient of variation for mean grain yield below the mean coefficient of variation (CV) line were described as stable while those with CV-values above the mean CV line were described as unstable. Therefore, the four groups were defined thus: Group I - high yield, small variation, Group II - high yield, large variation, Group III - low yield, small variation, and Group IV- low yield, large variation.
RESULTS
The agro-meteorological data of the experimental site for the three years are summarised in Table 2. The amount of rainfall during the growing period from the month of August to November differed for the three years. Rainfall in the month of August was highest in 2016. However, there was a 35% decrease in August 2017, with a remarkable dry spell that occurred at the time of seedling emergence and establishment, and a 38% decrease in rainfall in August 2018 compared to the amount of rainfall in August 2016. Nevertheless, a steady increase in amount of rainfall was recorded in the month of September from the year 2016 to 2018. In 2018, rainfall in September was almost twice the amount of rainfall in 2016 and 2017. Minimum and maximum daily temperatures increased slightly and steadily from the month of August to October, while relative humidity decreased progressively. However, slight alterations were observed in November 2017 and 2018.
Analysis of variance
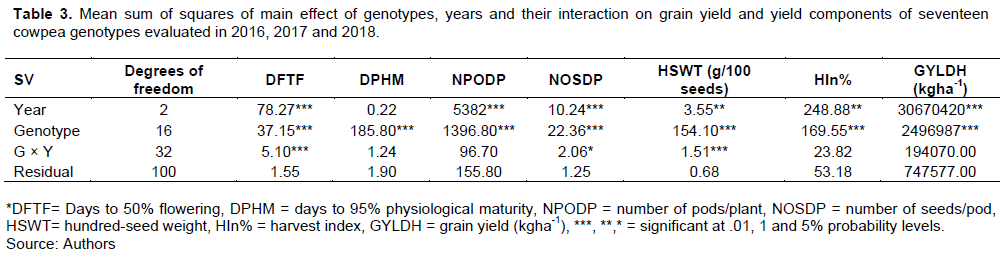
Combined analysis of variance over the years showed highly significant (p<0.01) mean sum of squares for genotypes (MSG) and mean sum of squares for years (MSY) for yield and yield components, except for number of days to 95% physiological maturity (DPHM), with non-significant variations across years (Table 3). MSG was higher in magnitude than MSY and mean sum of squares due to genotype by year interactions (MSG×Y) for DPHM, number of seeds/pod (NOSDP) and hundred-seed weight (HSWT). Meanwhile, MSG for number of days to 50% flowering (DFTF), number of pods/plant (NPODP), harvest index (HIn%) and grain yield (GYLDH) was lower in magnitude compared to MSY. The MSG×Y was non-significant (p<0.05) for DPHM, NPODP, HIn% and GYLDH. However, significant (p<0.05) and highly significant (p<0.01) genotype × year interactions were observed for NOSDP, HSWT and DFTF, respectively.
There were highly significant main effects of genotypes on yield and yield components (Table 4). Genotypes, IT09K-321-1, IT09K-231-1, IT08K-150-12 and IT08K-180-11, took significantly longer number of days to 50% flowering and 95% physiological maturity compared to genotypes: IT10K-836-2, IT10K-815-5 and IT10K-817-7, with significantly fewer DFTF and DPHM. Main effects of “Akidi ala”, IT09K-321-1, IT09K-231-1 and IT08K-126-19, on NPODP were significantly higher than those of IT10K-837-1, IT10K-819-4, IT10K-817-7, IT10K-815-5, “Akidi elu”, IT08K-180-11 and IT10K-836-2. “Akidi ala” and IT08K-126-19 recorded significantly higher HIn%, compared to the rest of the genotypes. Significantly higher GYLDH was obtained in IT08K-126-19, IT09K-321-1, IT07K-210-1-1, IT09K-456 and “Akidi ala”, compared to IT10K-815-5, IT08K-150-12, IT10K-836-2, IT08K-193-15, IT08K-180-11, IT10K-837-1 and “Akidi elu”. Number of seeds/pod was statistically higher in “Akidi elu”, than in the rest of the genotypes, with the exception of “Akidi ala” and IT10K-819-4, with statistically similar NOSDP. Highly significant differences were observed among genotypes for HSWT. HSWT ranged from 7.26 to 22.5 g/100 seeds, with “Akidi elu” recording the least, and was significantly lower than the rest of the genotypes. Genotypes IT10K-819-4, IT10K-817-7 and IT10K-817-1 produced large seeds which were statistically different from the rest of the genotypes.
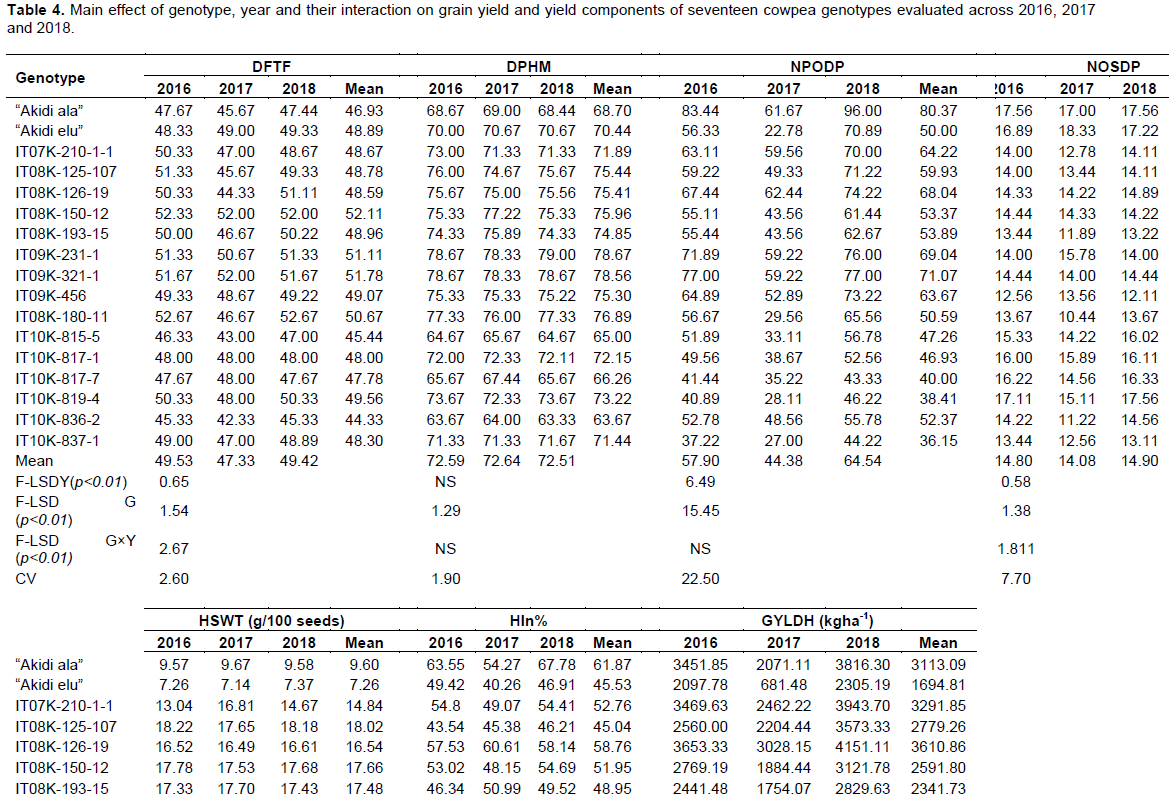
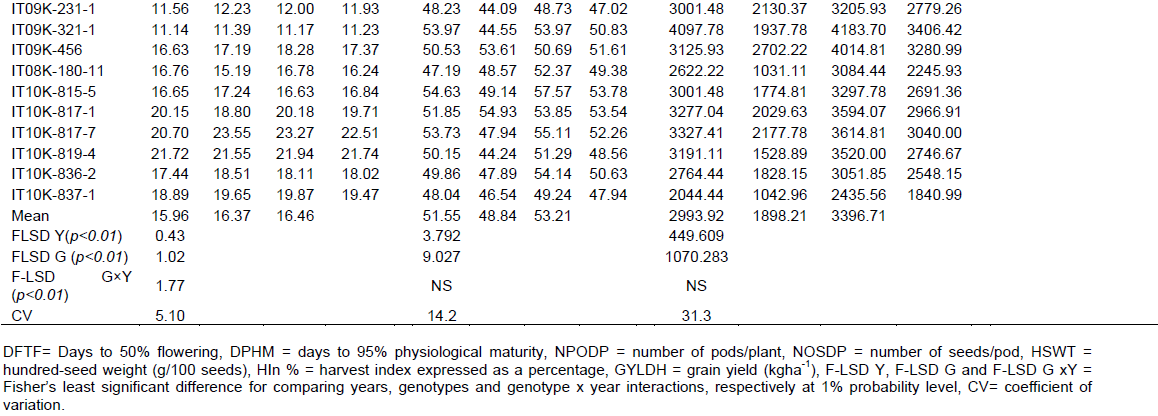
A general reduction and general increment were observed in the magnitude of phenotypic expression of the traits in the years 2017 and 2018, respectively, compared to 2016 (Table 4).
Stability analysis
Francis and Kannenberg’s genotype-grouping technique grouped the seventeen genotypes into four categories (Table 5 and Figure 1). Group I genotypes: IT08K-126-19, IT07K-210-1-1, IT09K-456, “Akidi ala”, IT10K-817-7 and IT09K-231-1, gave high grain yield with small variation, while, Group II genotypes: IT09K-321-1, IT10K-817-1 and IT08K-125-107 were high yielding with large variation. Group III genotypes which comprised IT10K-819-4, IT10K-815-5, IT10K-836-2, IT08K-150-12 and IT08K-193-15, had low yields with small variation, while Group IV genotypes “Akidi elu”, IT10K-837-1 and IT08K-180-11, were low yielding with large variation.
DISCUSSION
Genotypic variability of the population
The highly significant differences observed among genotypes, indicated the presence of high variability among genotypes for all studied traits. These findings are in consonance with those of Tariku (2018) and Gerrano et al. (2019) who reported high genotypic variability among cowpea lines. The mean values obtained for number of days to 50% flowering were similar to those reported by Animasaun et al. (2015), but differed from those reported by Cobbinah et al. (2011). Mean values observed for number of days to 95% physiological maturity were in the range of those reported by the Organization for Economic Co-operation and Development (2016), which classified genotypes as early or medium maturing, when pods ripened between 60 and 70 days or 70 and 80 days after sowing, respectively. Thus, genotypes: IT10K-836-2, IT10K-815-5, IT10K-817-7, “Akidi ala” and “Akidi elu” were early maturing, while the rest were medium maturing. Early maturation enabled genotypes to escape terminal droughts, which occurred at the onset of the dry season, resulting in the reduction of grain yield. This observation agrees with that of Owusu et al. (2018) who reported that the occurrence of terminal droughts at the flowering or fruiting stage resulted in 80% yield losses.
Mean number of days to 50% flowering and hundred-seed weight recorded by genotype IT07K-210-1-1, are similar to those reported by Idehen et al. (2016). Moreover, the mean values obtained for hundred-seed weight, days to flowering and maturity, number of pods/plant and seeds/pod, for genotypes IT08K-126-19, IT08K-150-12, IT09K-231-1, IT08K-180-11, IT10K-815-5 and IT10K-817-7, differed from those reported by Aliyu and Makinde (2016) for the same genotypes. Mean values for number of days to 50% flowering reported by these authors were 4 to 13 days higher than those observed in the present study. Equally, their reports on days to maturity were either higher, like in the case of IT08K-150-12, IT10K-815-5 and IT10K-817-7, or lower like in IT09K-231-1, IT08K-180-11, IT10K-837-1, IT08K-126-19 and IT09K-125-107. Thus, completely altering the placement of some of these genotypes in a given maturity group. For example, IT10K-837-1, was reported in their study as early maturing (58 days) but was found to be medium maturing (71days) in the current study. Also, IT08K-180-11, which was classified as late maturing (88 days) was found to be medium maturing (77 days) in the current study. Four to fifty-two lesser number of pods/plant were reported by Aliyu and Makinde (2016) as compared to the number observed in this study. For example, genotype IT09K-231-1 bore a mean of 69 pods/plant and 15 seeds/pod, whereas these authors reported 17.5 pods and 23 seeds: a difference of 52 pods/plant and 8 seeds/pod. Apart from, IT08K-125-107 and IT10K-817-7, whose mean hundred-seed weights were similar to those observed, the rest of the co-studied genotypes gave much lower hundred-seed weights than those reported by Aliyu and Makinde (2016). These observations provided evidence of the exhibition of phenotypic plasticity among genotypes for a given trait, and are in line with previous assertions by Gerrano et al. (2015) and Bustos-Korts et al. (2018), who opined phenotypic plasticity was the result of changes in the location or seasons (years), or both. Hall et al. (1997) earlier reported that inconsistencies in genotype performance across regions were because cultivars exhibit specific reproductive responses which increase local adaptation but limited their performance in other regions. Abadassi (2015) stressed that differences observed in evaluation studies could either be due to the materials used or the methods employed. Thus, he suggested the use of thermal degree days, as a better expression for maturation period than number of days to flowering and maturity, when referring to genotypes evaluated across agro-ecological zones. The reason being that the zones often vary in edaphic factors, altitude, rainfall distribution, sunshine and daily temperatures, which play key roles in the phenology of the crop.
Grain yield obtained for genotype IT10K-815-5, differed greatly from that reported by Aliyu and Makinde (2016). The genotype, which bore similar number of seeds per pod, with fewer number of pods/plant and had a higher hundred-seed weight, yielded twice as much grain as was observed in the present study. This observation prompted the question of whether the higher hundred-seed weight recorded in their study could have accounted for the disparity in yield obtained, and if it justifies the higher yield reported. Were these the case, it would imply that in cowpea, number of pods/plant and seeds/pod, do not always imply high grain yield when genotypes of different seed sizes, by implication, different hundred-seed weights are co-evaluated. The proof of such an assertion is that, genotypes like, “Akidi elu” and “Akidi ala”, which bore higher number of pods/plant and seeds per pod, compared to the rest of the genotypes, were not among the first three high-yielding genotypes. “Akidi elu” and “Akidi ala” recorded low hundred-seed weights compared to some of the genotypes with less seed and pod number. The variation observed among genotypes for hundred-seed weight concurs with previous reports by Timko et al. (2007), Henshaw (2008), Manggoel and Uguru (2011).
Influence of weather on grain yield and yield components’ performance
The significant differences observed in the magnitude of character expression across years were possibly due to vagaries in weather conditions during the growing season. In the year 2016, trait expression and grain yield were appreciable, despite the abrupt on-set of the dry season. However, in 2017, the unevenness in rainfall distribution during the growing season could have accounted for the reduction in number of pods per plant, seeds per pod and GYLDH. The dry spell, observed immediately after seeding in August 2017, could have negatively impacted seedling emergence and crop establishment, thus resulting in the poor grain yields. Meanwhile, in 2018, appreciable amounts of rainfall which, unlike in previous years, persisted into the month of November, provided adequate soil moisture, especially for medium maturing genotypes. These enhanced flower production, pod setting and accumulation of photo-assimilates in the seed, which translated into higher grain yields. These findings agree with those of Barbosa et al. (2016) and Boukar et al. (2018) who reported that moisture deficits at critical stages of plant growth, such as, seedling emergence, flowering or fruiting stage reduced productivity of cowpea grain.
Mean grain yield values recorded for IT08K-125-107, IT08K-150-12, IT09K-231-1 and IT08K-180-11, in 2018, were similar to those reported by Aliyu and Makinde (2016). Grain yield for IT08K-126-19 averaged over three years, was similar to that reported by Aliyu and Makinde (2016). However, the genotype performed better in 2018, and was stable and high-yielding across the years. This suggested better adaptation of the genotypes to the fluctuations in weather conditions and, highlights the importance of evaluating genotypes over several years to ascertain their response to selection.
The reduction in NOSDP observed in 2017, favoured an increase in HSWT in some genotypes, like IT07K-210-1-1(from 13.04 g in 2016 to 16.81 g/100seeds in 2017) and IT10K-817-7 (from 20.7 g in 2016 to 23.5 g/100 seeds in 2017). This suggested an adaptive response of these genotypes for HSWT to prevailing environmental conditions. By implication, these genotypes possessed a buffering ability to strengthen their sink capacity against some odds. This observation is in line with that of White et al. (2016) who opined those plants capable of harnessing external resources, coordinating their metabolic activities and ensuring proper resource use and allocation to economic parts, were better adapted to the growing environment.
Regardless of environmental constraints in the year 2017, the higher harvest index recorded in some genotypes, such as, IT08K-126-19, IT08K-193-15 and IT09K-456, suggested the possibility of increase in biological efficiency of these genotypes in the production, partitioning and translocation of photo-assimilates to sink (the seed), thus increasing the economic value of these genotypes. These findings corroborate with those of Acquaah (2007), who stated that harvest index could be increased or decreased by manipulating the cultural environments.
The significant genotype × year interactions observed revealed inconsistencies in genotype performance across years. Similar findings have been reported by several authors (El-Shaieny et al., 2015; Tariku, 2018; Geranno et al., 2019). The significant G × Y observed for days to 50% flowering, number of seeds/pod and hundred-seed weight, indicated a differential response among genotypes across years. This observation is in accordance with the reports of Fasahat et al. (2015) who intimated those unpredictable variations across years strongly influenced phenotypic stability in trait performance, and are a direct consequence of genotype × year interaction effects.
The non-significant genotype × year interactions observed on some traits, revealed consistency in genotype performance across years. This agrees with reports of Manggoel and Uguru (2011) for similar traits, except for number of days to 50% flowering. However, these results contradict those of El-Shaieny et al. (2015), who found significant G × E interaction on all traits, except HSWT.
The higher mean squares of genotypes over mean squares for years, and interaction, observed for DPHM, HSWT and NOSDP, indicated that expression of these traits was strongly under the control of genes than the environment. This revealed less environmental influence on the traits, and suggested moderate to high heritability of the traits, and thus, a positive response to selection, such as increase in genetic gains. Meanwhile, the higher mean squares of years over mean squares of genotypes and their interaction, recorded for DFTF, NPODP, HIn% and GYLDH, revealed that gene expression was strongly influenced by the conditions prevailing during the growing season, and thus suggested polygenic inheritance, lower heritability and a low response to selection. These remarks are in consonance with the findings of Shrivas et al. (2020).
Yield stability
The high yield, small variation, and low yield, small variation, observed in groups I and III genotypes, respectively, indicated genotype consistency in performance in grain yield for three years. Thus, these genotypes could be described as stable, and often more desirable to farmers, due to the reliability and predictability in their performance across years. The observations are in tandem with those of Francis and Kannenberg (1978) and Silva et al. (2016). This consistency in performance facilitated the process of selection. These findings are in consonance with those of Gerrano et al. (2019) and Samireddypalle et al. (2017), who noted that stable genotypes made minimal contribution to genotype by environment interactions, and thus facilitated selection, or their recommendation for release to farmers.
The high yield, large variation and low yield, large variation, observed in groups II and IV genotypes revealed the inconsistency of these genotypes in yield performance across years. This suggested that such genotypes contributed significantly to the differential responses observed across years, and thus articulated the unreliability and unpredictability in their performance. Hence, such genotypes cannot be selected directly to improve grain yield. These observations are in tandem with those of Gerrano et al. (2019) who stressed that instability and unpredictability in genotype performance complicated the selection process and reduced the efficiency of selection.
CONCLUSION
Combined analysis of variance revealed that sufficient variability exists among genotypes, which can be exploited in breeding programmes. Genotypes with high and stable yields could be recommended for release to farmers or incorporated as parents in cowpea breeding programmes to improve on the yield and yield stability of low yielding and unstable genotypes.
CONFLICT OF INTERESTS
The authors have no conflict of interests.
REFERENCES
|
Abadassi J (2015). Cowpea (Vigna unguiculata (L). Walp) agronomic traits needed in tropical zone. International Journal of Pure and Applied Bioscience 3(4):158-165. |
|
|
Acquaah G (2007). Principles of Plant Genetics and Breeding. Blackwell Publishing, Oxford P 584. |
|
|
Alercia A (2011). Key Characterization and Evaluation Descriptors: Methodologies for the Assessment of 22 Crops. Bioversity International, Rome, Italy P 602. |
|
|
Aliyu OM, Makinde BO (2016). Phenotypic analysis of seed yield and yield components in cowpea (Vigna unguiculata L. Walp). Plant Breeding and Biotechnology 4(2):252-261. |
|
|
Animasaun DA, Oyedeji S, Azeez YK, Mustapha OT, Azeez MA (2015). Genetic variability study among ten cultivars of cowpea (Vigna unguiculata L. Walp) using morpho-agronomic traits and nutritional composition. Journal of Agricultural Sciences 10(2):119-130. |
|
|
Barbosa MAM, Lobato AKS, Silva MHL, Maciel GM, Marques DJ (2016). Cowpea breeding for drought tolerance from Brazil to world: In abiotic and biotic stress in plants. Recent advances and Future perspectives. |
|
|
Boukar O, Belko N, Chamarthi S, Togola A, Batieno J, Owusu E, Haruna M, Diallo S, Umar LM, Olufajo O, Fatokun C (2018). Cowpea (Vigna unguiculata): genetics, genomics and breeding. Plant Breeding, pp. 1-10. |
|
|
Bustos-Korts D, Romagosa I, Borràs-Gelonch G, Casas AM, Slafer GS, Eeuwijk F (2018). Genotype by environment interaction and adaptation. Encyclopaedia of Sustainability Science and Technology, pp. 1-44. |
|
|
Carvalho M, Halecki W (2021). Modelling of cowpea (Vigna unguiculata) yield and control insecticide exposure in a semi-arid region. Plants 10(1074):1-16. |
|
|
Cobbinah FA, Addo-quaye MO, Asante IK (2011). Characterization, evaluation and selection of cowpea (Vigna unguiculata (L.) Walp) accessions with desirable traits from eight regions of Ghana. Journal of Agriculture and Biological Science 6(7):21-31. |
|
|
El-Shaieny AAH, Abdel-Ati YY, El-Damarany AM, Rashwan AM (2015). Stability analysis of component characters in cowpea (Vigna unguiculata (L.) Walp). Journal of Horticulture and Forestry 7(2):24-35. |
|
|
Ezeaku EI (2013). Productivity of grain cowpea (Vigna unguiculata (L.) Walp) as influenced by season, genotype, insect pest management and cropping system in South-eastern Nigeria. Virtual Library, University of Nigeria, Nsukka. |
|
|
FAOStat (2017). FAOSTAT statistical data base. Rome: Food and Agricultural Organizations of the United Nations. Visited on 15/08/2022. |
|
|
Fasahat P, Rajabi A, Mahmoudi SB, Noghabi MA, Rad JM (2015). An overview on the use of stability parameters in plant breeding Biometrics and Biostatistics International Journal 2(5):149-159. |
|
|
Francis TR, Kannenberg LW (1978). Yield stability studies in short season maize: A descriptive method for grouping genotypes. Canadian Journal of Plant Science 58(4):1029-1034. |
|
|
Gerrano AS, Adebola PO, van Rensburg WSJ, Laurie SM (2015). Genetic variability in cowpea (Vigna unguiculata (L.) Walp) genotypes. South African Journal of Plant and Soil 32(3):165-174. |
|
|
Gerrano AS, Rensburg SJ, Kutu FRK (2019). Agronomic evaluation and identification of potential cowpea (Vigna unguiculata (L.) Walp) genotypes in South Africa. Acta Agriculturae Scandinavica, Section B-Soil and Plant Science. Available at: DOI: 10.1080/09064710.2018.1562564. |
|
|
Gerrano AS, Rensburg SJ, Kutu FRK (2019). Agronomic evaluation and identification of potential cowpea (Vigna unguiculata (L.) Walp) genotypes in South Africa. Acta Agriculturae Scandinavica, Section B-Soil and Plant Science. Available at: https://doi:10.1080/09064710.2018.1562564. |
|
|
Hall AE, Singh BB, Ehlers JD (1997). Cowpea breeding. Plant Breeding Reviews 15:215-274. |
|
|
Henshaw FO (2008). Varietal differences in physical and proximate composition of Cowpea (Vigna unguiculata). World Journal of Agricultural Sciences 4(3):302-306. |
|
|
Horn L, Shimelis H, Sarsu F, Mwadzingenia L, Laing MD (2017). Genotype-by-environment interaction for grain yield among novel cowpea (Vigna unguiculata (L.) Walp) selections derived by gamma irradiation. Available at: https://doi.org/10.1016/j.cj.2017.10.002. |
|
|
Idehen EO, Oyelakin SA, Onikola AO, Adedapo VO (2016). Numerical and RAPD analysis of eight cowpea genotypes from Nigeria. Nigerian Journal of Biotechnology 31:59-65. |
|
|
Kayode OT, Aizebeokhai AP, Odukoya AM (2019). Soil characterisation for precision agriculture using remotely sensed imagery in south-eastern Nigeria. Journal of Physics: Conf. Series 1299. |
|
|
Manggoel W, Uguru MI (2011). Comparative study on the phenology and yield components of two photoperiodic groups of cowpea (Vigna unguiculata (L.) Walp) in two cropping seasons. African Journal of Agricultural Research 6(23):5232-5241. |
|
|
Organisation for Economic Co-operation and Development -OECD (2016). Cowpea (Vigna unguiculata) in Safety Assessment of Transgenic Organisms in the Environment, Volume 6: OECD Consensus Documents, OECD Publishing, Paris pp. 211- 241. |
|
|
Owusu EY, Akromah R, Denwar NN, Adebeng-Danquah J, Kusi F, Haruna M (2018). Inheritance of early maturity in some cowpea (Vigna unguiculata (L.) Walp) genotypes under rain fed conditions in Northern Ghana. Advances in Agriculture 2018 (8930259):1-10. |
|
|
Samireddypalle A, Boukar O, Grings E, Fatokun CA, Kodukula P, Devulapalli R, Okike I, Blümmel M (2017). Cowpea and groundnut haulms fodder trading, and its lessons for multidimensional cowpea improvement for mixed crop livestock systems in West Africa. Frontiers in Plant Science 8(30):1-9. |
|
|
Shrivas S, Devi B, Maurya KR, Patel M (2020). Studies on genetic variability and heritability of different traits in cowpea (Vigna unguiculata (L.) Walp). Indian Journal of Pure and Applied Biosciences 8(6):575-579. |
|
|
Silva D, Santos CA, Boiteux L (2016). Adaptability and stability parameters of total yield and protein content in cowpea (Vigna unguiculata) genotypes subjected to semi-arid conditions. Australian Journal of Crop Science 10(8):1164-1169. |
|
|
Tariku S (2018). Breeding cowpea (Vigna unguiculata L. Walp) for quality traits. Annals of Reviews and Research 3(2):1-7. |
|
|
Tariku S, Wassu M, Berhanu A (2018). Genotype by environment interaction and stability analysis of cowpea [Vigna unguiculata (L.) Walp] genotypes for yield in Ethiopia. Journal of Plant Breeding and Crop Science 10(9):249-257. |
|
|
Timko MP, Ehlers JD, Roberts PA (2007). Cowpea. In: Kole C (Eds.), Genome Mapping and Molecular Breeding in Plants, Volume 3, Pulses, Sugar and Tuber Crops. Springer Verlag Berlin Heidelberg, pp. 49-67. |
|
|
Uguru MI, Baiyeri KP, Aba SC (2011). Indicators of climate change in the derived savannah niche of Nsukka, South-eastern Nigeria. Journal of Tropical Agricultural, Food, Environment and Extension, 10(1):17-26. |
|
|
White AC, Rogers A, Rees M, Colin PO (2016). How can we make plants grow faster? A source-sink perspective on growth rate. Journal of Experimental Botany 67(1):31-45. |
|
|
Xiong H, Shi A, Mou B, Qin J, Motes D, Lu W, Ma J, Weng Y, Yang W, Wu D (2016). Genetic diversity and population structure of cowpea (Vigna unguiculata L. Walp). PLoS ONE 11(8):1-15. |
|
Copyright © 2024 Author(s) retain the copyright of this article.
This article is published under the terms of the Creative Commons Attribution License 4.0


