ABSTRACT
Wheat is one of the most important cereal crops in the world. The objectives of this study were: (i) to evaluate the solvent retention capacity of wheat flour from three genotypes when nitrogenous fertilizer is applied at different stages of crop growth; and (ii) to evaluate the possible existence of correlations between different solvents when nitrogenous fertilizer is applied at different stages of crop growth. The experiment was conducted from June to November 2013 in Plant Breeding Laboratory and Plant Production, Federal University of Santa Maria, the experimental area is located at Frederico Westphalen, southern Brazil. The experiment consisted of 12 treatment combinations (3 genotypes and application of nitrogenous fertilizer at 4 crop growth stages) of a 3x4 factorial (genotype x nitrogenous fertilizer application) arranged in a randomized complete block design with three replications. The genotypes Fundacep 52, TBIO Mestre and TBIO Itaipu were arranged with the tested nitrogenous fertilizer applications (I = no nitrogen, II = tillering, III = tillering and flowering and IV = tillering, booting and flowering). Greater levels of solvent retention capacity were observed in TBIO Mestre, suggesting that the genotype has good baking quality. The amount of glutenin was not affected by the stage of nitrogenous fertilization application. The water retention capacity of the flour has a strong and positive correlation with the retention capacity of the sodium carbonate and sucrose, along with the associations between the solvents sodium carbonate and sucrose.
Key words: Agriculture science, plant management, plant science, quality grains, Triticum aestivum L.
Wheat (Triticum aestivum L.) is an important economy cereal crop in the Brazilian. In Brazil, wheat is widely used as a raw material for the production of bread, biscuits and pasta. The country imports wheat grain from other countries because domestic production does not meet the demand for wheat grain, both in quantity and quality (Carneiro et al., 2005). The quality evaluation of wheat flour is an essential tool for pursuing optimum nitrogen fertilizer application regime and improved wheat genotypes in order to achieve superior quality. Due to the great variability among Brazilian wheat genotypes, the wheat flour quality cannot be assessed without defining its final product use (Gutkoski et al., 2007).
Wheat flour is composed mainly by starch (70 to 75%), water (12 to 14%), proteins (8 to 16%), non-starch polysaccharides (2 to 3%), lipids (2%) and minerals (1%) in average (Scheuer et al., 2011). Moreover, the qualities, quantities and differences in the several flour constituents vary from genotypes (Morita et al., 2002). Final quality of products derived from wheat is a factor directly related to technological characteristics of the wheat grain. The characteristics are influenced by genetic factors and its interaction with biotic factors and abiotic (Mandarino, 1993). The genotypes have differences in grain composition and processing quality, and a cultivar that is suitable for preparing food, may be inadequate for the preparation of other (Miranda et al., 2011).
The application of nitrogenous fertilizer is essential for the expression of technological wheat quality. As reported by Almeida et al. (2013), nitrogen is a constituent of gliadin and glutenin proteins that are, responsible for the functional characteristics of wheat flour. The amount of nitrogen fertilizer applied varies depending on the content of organic matter in the soil, the previous crop and the expected yield of grain. The management of nitrogen throughout the culture is given in two stages: at sowing and the remainder applied to cover. For the use of higher doses of nitrogen in coverage can adopt the installment in two applications, which were, at the start of tillering and the rest at the beginning of stretching. Nitrogen application coverage can still be performed after wheat booting, in order to increase grain protein, improving their technological characteristics (Cunha and Caierão, 2014).
The evaluation method of wheat flour quality by solvent retention capacity (SRC) is commonly used in breeding programs. This is because sampling is carried out using small quantities of flour (Pallarés et al., 2007). This method is successfully used by many researchers in the world, to assess the quality of the flour of different
genotypes and managements to increase the quality of wheat by-products (Pasha et al., 2009; Duyvejonck et al., 2012; Kaur et al., 2014; Gusmán et al., 2015), however, in Brazil, this method is not commonly used.
The SRC pattern of the four nitrogen application times presents a profile of the analyzed flour quality, making it possible to predict the end use quality (AACC, 2000). Therefore, this method may be promising as an indirect measure of wheat flour quality in genotypes and segregating populations. The study of techniques and management strategies to improve the quality of wheat grain is a key aspect in the search for greater competitiveness of the wheat produced in Brazil, reducing dependency on raw materials imported from other countries. Thus, the objectives of this study were: (i) to evaluate the solvent retention capacity of wheat flour from three genotypes when nitrogenous fertilizer is applied at different stages of crop growth; and (ii) to evaluate the possible existence of correlations between different solvents when nitrogenous fertilizer is applied at different stages of crop growth.
The experiment was conducted from June to November 2013 in Plant Breeding Laboratory and Plant Production, Federal University of Santa Maria, in the experimental area located at Frederico Westphalen, RS, southern Brazil, at altitude of 460 m above sea level, latitude 27°23’48.17”S and longitude 53°25’34.82”W, in the state of Rio Grande do Sul, southern Brazil. The area has distrophic red Oxisol soil (Embrapa, 2006), sub-tropical humid climate with balanced rain system and the dry season is not defined. The area receives an average annual rainfall ranging from 1,250.0 to 2,000.0 mm (Sema, 2005).
The experiment consisted of 12 treatment combinations (3 genotypes and application of nitrogenous fertilizer at 4 crop growth stages) of a 3x4 factorial arranged in a randomized complete block design with three replications. The genotypes were: Fundacep 52, TBIO Mestre and TBIO Itaipu, which are widely grown cultivars in the country, and the treatments for the nitrogenous fertilizer application were as follows; I = no nitrogen (without the application of N in coverage), II = tillering (application of 115 kg ha-1 N at tillering stage), III = tillering and flowering (application of 57.5 kg kg ha-1 N in the phase of tillering and 57.5 kg ha-1 N at flowering stage) and IV = tillering, booting, and flowering (application of 38.3 kg ha-1 N at tillering, 38.3 kg ha-1 N at booting and 38.3 kg ha-1 N at flowering).
The genotypes were seed on the 10th of July 2013 using a tractor seeder in 7.14 m2 plots measuring 12 rows by 3.5 m long, spaced 0.17 m apart. Grain yield was harvested from the eight center, discarding 0.5 m from both ends (length wise).The fertilization was carried out following the soil analysis before the implementation of the experiment, where basal fertilizer was applied at 200 kg ha-1 (08N:24P:12K) formulation. On the surface
was applied 115 kg ha-1 urea (45% of nitrogen) for all trials. It is applied to phenological stages related to the tested nitrogen managements. The average plant population was 310 plants m-2. Cultural treatments were performed according to the technical recommendations for the wheat crop (RCBPTT, 2011). Regarding pests and diseases control, pesticide and fungicide applications were done accordingly and where necessary.
The characters were measured at Laboratory of Cereals of Food Research Center of the University of Passo Fundo, RS. The SRC method expresses the solvent weight retained by flour after centrifuging and it is expressed as a percentage based on 14% of moisture determined according to the Equation 1.
Four solvents were used independently in SRC method in order to obtain different values for SRC: 50% sucrose, 5% sodium carbonate, 5% lactic acid and water. The solvent retention capacity was determined according to the method No. 56-11 of AACC (2000), using 5 g of flour for each solvent. The procedure consisted of weighing 5 g of flour for each test tube and adding 25 ml of the solvent. The tubes were then vigorously agitated with the support of magnetic stirrer for 40 s at 5 min intervals until completion of the 20 min cycle. Subsequently, the samples were centrifuged at 1000 × g for 15 min. The results were calculated according to Equation 1.
The data was subjected to analysis of variance by F test. Simple effects were dismembered when the genotype x nitrogenous application interactions were observed. Moreover, the variables that showed no significant interactions were dismembered into principal effects. Mean separation was done using Duncan’s multiple range test at 5% of probability. Analyses were performed with the Genes software (Cruz, 2013). The correlations were classified as described by Carvalho et al. (2004), where values equal to 0.00 correspond to null correlation; 0.00 to ≤ 0.30 corresponds to weak correlation; 0.30 to ≤ 0.60 corresponds to medium correlation; 0.60 to ≤ 0.90 corresponds to strong correlation; 0.90 < 1.00 corresponds to very strong correlation and 1.00 corresponds to perfect correlation.
Analysis of variance for traits
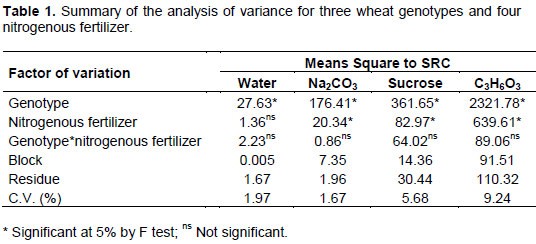
The analysis of variance by F test revealed no significance (≤ 0.05) for the genotype wheat x nitrogenous fertilizer application interaction for the traits water retention capacity, sodium carbonate retention capacity, sucrose retention capacity, and lactic acid retention capacity, implying that the response pattern obtained by genotypes depending on nitrogenous fertilizer strategies in surface fertilization was similar (Silva, 2007). For traits, water retention capacity was observed to have significant differences for the factor genotypes, with no significant effect factor on nitrogen application, showing more effect of the genetic makeup of each genotype than the nitrogenous fertilizer for this trait. For characters, sodium carbonate retention capacity, sucrose retention capacity and lactic acid retention capacity significant differences were found between the main effects for both factors of variation, genotypes and nitrogen fertilization, inferring that for these characters, evidenced variation was due to the genetic differences of genotypes and adopted nitrogenous fertilizer. The coefficients of variation for the traits varied from 1.67 to 9.24% (Tables 1 and 2). According to the classification by Pimentel-Gomes (2000), coefficients of variation (CV) may be considered low (<10%) with high accuracy, medium (10 to 20%) with good accuracy, high (20 to 30%) with low accuracy and very high (> 30%) with low accuracy. Thus, CV obtained in this study show reliable results and adequate experimental accuracy.

Complementary analyzed
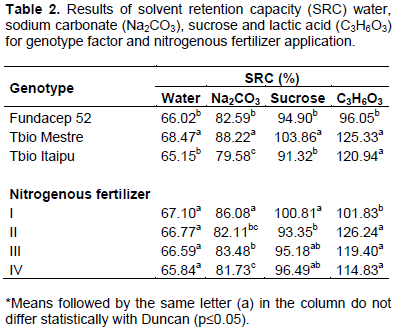
In the comparison of genotype effects, TBIO Mestre genotype presented greater magnitudes of retention capacity of the solvents (water, sodium carbonate and sucrose) as compared to the other studied genotypes (Table 2). This result demonstrates that this genotype revealed better flour quality indices for baking. The TBIO Mestre and TBIO Itaipu genotypes expressed greater lactic acid absorption than the Fundacep 52 genotype. The lactic acid retention capacity is indicative of forming ability of glutenin net and the strength of the gluten flour (Gaines, 2000). The glutenin are protein fraction of gluten, which most influences the quality of bread for flour (Brunori et al., 1989); therefore, as important as the quantity, the quality of proteins is critical for determining the technological wheat quality. Bushuk (1985) shows that the quality of protein is a genotypic characteristics inherent in each genotype, corroborating the results obtained in this study. The selection of wheat genotypes seeking better baking quality should consider protein quality as one of the genotypes selection criteria (Wrigley, 1994).
According to Gaines (2000), flour with SRC of water ≤ 57%, SRC of sodium carbonate ≤ 72%, SRC of sucrose ≤ 96% and SRC of lactic acid ≥ 100% is suitable for "sponge and dough" systems, that is, in the production of panettone, sweet bread and bread. Based on this classification, the TBIO Mestre was the only genotype that presented flour with the desired SRC profile for a good performance in "sponge and dough" systems. However, according to the criteria used by Pike and Mac Ritchie (2004), TBIO Mestre and TBIO Itaipu genotypes are demonstrated as sources of good quality flour for baking because they presented a SRC of lactic acid above 100%. No significant differences were found for water absorption by wheat flour depending on nitrogenous fertilizer applications (Table 2), implying that the applications studied provided no change in the total quantity of wheat flour constituents (AACC, 2000). Nevertheless, this effect does not mean that the quantities of grain components did not have varied individually. Thus, this parameter should be analyzed together with the SRC in other solvents in order to predict objectively the flour quality.
The sodium carbonate absorption estimates the level of damaged starch in the flour, indirectly indicating its hardness. Moreover, sucrose absorption is associated with the pentosan quantity present in the flour (AACC, 2000). The nitrogenous fertilizer application I exhibited greater absorption capacity of sodium carbonate and sucrose solution, with 86.08 and 100.81%, respectively. This result indicates that when nitrogen was not applied to cover, there was great damage to starch levels and pentosans present in the flour. The pentosans are components of plant cell, being present in the aleurone layer and in the bran layers, especially in wheat grains. During the milling of wheat grains, parts of cells (pentosans) can stay in the flour and change its composition and quality. Along with damaged starch, which also comes from the grinding, the pentosans absorb 100% of water. Therefore, the presence of pentosans and damaged starch increase the water absorption of the flour, being a desirable feature for bread production (Kweon et al., 2011).
Nitrogenous fertilizer applications II, III, and IV demonstrated greater lactic acid absorption, while the same did not differ among themselves. According to AACC (2000), the absorption of lactic acid is associated with glutenin and it can be used as a gluten indicator. The glutenins are reserve proteins, which together with gliadins form the gluten, being responsible for the functional properties of wheat flour. This result is supported by findings of Boehm et al. (2004). These authors emphasized that the increase in grain protein content is due to the use of nitrogenous fertilizer. Similarly, Pelegrin et al. (2016), emphasized that the technological quality is influenced by management and nitrogen sources as well as the genotypic attributes of used cultivars. This fact is justified because nitrogen is the basic component of proteins and amino acids (Malavolta, 1981). So, despite the fact that Bushuk (1985) stated that protein quality is a genotypic trait, nitrogen supplies of this study favored the expression of this trait by genotypes.
Pearson linear correlation between traits
The Pearson linear correlation analysis identifies the existing linear dependence between two traits, showing the magnitude of their positive or negative interrelations, ranging from -1.0 to 1.0, the closer to 1 the value, the stronger the degree of association between these two traits and the closer to zero, the smaller the linear dependence between them (Carvalho et al., 2004). The SRC of water demonstrated a strong positive correlation with the SRC of sodium carbonate and sucrose, obtaining coefficients of 0.76 and 0.63, respectively (Table 3). These results corroborate those of Antunes (2014), which also found a positive correlation between SRC of water and SRC of sodium carbonate, when two types of flour were studied in a physicochemical level. Similarly, Duyvejonch et al. (2012), Colombo et al. (2008) and Gaines (2000) observed a strong correlation in the values of SRC of water, SRC of sodium carbonate and SRC of sucrose.

The SRC of sodium carbonate presented a strong positive correlation with the SRC of sucrose. Moreover, Costa (2013) found the same correlation studying the industrial quality of wheat lines. Also, Barrera et al. (2007) evaluated two wheat genotypes and one triticale genotype in different milling conditions. These authors found positive correlation between the sucrose absorption capacity and sodium carbonate absorption capacity of the flour. Significant correlations of SRC of lactic acid with other solvents tested under the conditions of this research were not found. This result is similar to that found by Barrera et al. (2007), where there was no correlation between the SRC of lactic acid with the SRC of sodium carbonate and SRC of sucrose. Although, they found a strong correlation between the SRC of lactic acid and SRC of water.
Greater levels of solvent retention capacity were observed in TBIO Mestre, suggesting that the genotype has good baking quality. The application of nitrogen in coverage increases the retention capacity of lactic acid; however, the stage that is applied throughout the wheat crop cycle does not change this feature, under the conditions of this study.
The water retention capacity of the flour has a strong and positive correlation with the retention capacity of the sodium carbonate and sucrose, together with the associations between the solvents sodium carbonate and sucrose.
The authors have not declared any conflict of interests.
REFERENCES
|
AACC (2000). Approved methods of the American Association of Cereal Chemists. 10. ed. Saint Paul, Approved Methods Committee.
|
|
|
|
Almeida VA, Canesin EA, Suzuki RM, Palioto GF (2013). Qualitative analysis of proteins in foods by complexation reaction of cupricion. Quím. Nov. Esc. 35:34-40.
|
|
|
|
|
Antunes PIC (2014). Application of the method of solvent retention capacity in determining the quality of bread making flour. Lisboa 64 p.
|
|
|
|
|
Barrera GN, Perez GTP, Ribotta PD, Léon AE (2007). Influence of damaged starch on cookie and bread-making quality. Eur. Food Res. Technol. 225:1-7.
Crossref
|
|
|
|
|
Boehm DJ, Berzonsky WA, Bhattacharya M (2004). Influence of nitrogen fertilizer treatments on spring wheat (Triticum aestivum L.) flour characteristics and effect on fresh and frozen dough quality. Cereal Chem. 81(1):51-54.
Crossref
|
|
|
|
|
Brunori A, Galterio G, Zannettino C, Pogna NE (1989). Bread-making quality indices in Triticum aestivum progenies: implications in breeding for better bread wheat. Plant Breed.102:222-231.
Crossref
|
|
|
|
|
Bushuk W (1985). Flour proteins: structure and functionality in dough and bread. Cereal Foods World 30(7):447-451.
|
|
|
|
|
Carneiro LMTA, Biagi JD, Freitas JG, Carneiro M, Felício JC (2005).Harvest timing, drying and storage effects in the grain quality of common and hard wheat. Bragantia 64(1):127-137.
|
|
|
|
|
Carvalho FIF, Lorencetti C, Benin G (2004). Estimates and correlation implications in plant breeding. Pelotas, UFPEL. 142p.
|
|
|
|
|
Colombo A, Pérez GT, Ribotta PD, León AE (2008). A comparative study of physicochemical tests for quality prediction of Argentine wheat flours used as corrector flours and for cookie production. J. Cereal Sci. 48:775–780.
Crossref
|
|
|
|
|
Costa MS (2013). Evaluation of the industrial quality of wheat lines by physicochemical methods, rheological and baking. São José do Rio Preto 150 p.
|
|
|
|
|
Cruz CD (2013). GENES - a software package for analysis in experimental statistics and quantitative genetics. Acta Sci. Agron. 35(3):271-276.
Crossref
|
|
|
|
|
Cunha GR, Caierão E (2014). Informações técnicas para trigo e triticale – safra 2015. Brasília 229 p.
|
|
|
|
|
Duyvejonck AE, Lagrain B, Dornez E, Delcour JA, Courtin CM (2012). Suitability of solvent retention capacity tests to assess the cookie and bread making quality of European wheat flours. Food Sci. Technol. 47:56-63.
Crossref
|
|
|
|
|
Embrapa (2006). Brazilian system of soil classification. 2.ed. Rio de Janeiro 306 p.
|
|
|
|
|
Gaines CS (2000). Collaborative study of methods for solvent retention capacity profiles (AACC method 56-11). Cereal Foods World 45:303-330.
|
|
|
|
|
Gusmán C, Posadas-Romano G, Hernández-Espinosa N, Morales-Dorantes A, Pe-a RJ (2015). A new standard water absorption criteria based on solvent retention capacity (SRC) to determine dough mixing properties, viscoelasticity, and bread-making quality. J. Cereal Sci. 66:59-65.
Crossref
|
|
|
|
|
Gutkoski LC, Klein B, Pagnussatt FA (2007). Technological characteristics of wheat genotypes grown in the cerrado. Ciên. Agrot. 31(3):786-792.
Crossref
|
|
|
|
|
Kaur A, Singh N, Kaur S, Ahlawat AK, Singh AM (2014). Relationships of flour solvent retention capacity, secondary structure and rheological properties with the cookie making characteristics of wheat cultivars. Food Chem. 158:48-55.
Crossref
|
|
|
|
|
Kweon M, Slade L, Levine H (2011). Solvent retention capacity (SRC) testing of wheat flour: principles and value in predicting flour functionality in different wheat based food processes and in wheat breeding. Cereal Chem. 88(6):537–552.
Crossref
|
|
|
|
|
Malavolta E (1981). Elements of plant nutrition. São Paulo, Agron. Ceres P. 251.
|
|
|
|
|
Mandarino JMG (1993). Important aspects of the quality of wheat. Londrina, Embrapa – CNPSO. 32 p.
|
|
|
|
|
Miranda MZ, Guarienti EM, Tonon VD (2011). Qualidade tecnológica de trigo. In: Pires JLF, Vargas L, Cunha GR (ed.). Trigo no Brasil: Bases para a produção competitiva e sustentável. Passo Fundo: Embrapa Trigo pp. 371-389.
|
|
|
|
|
Morita N, Maeda T, Miyazaki M, Yamamori M, Mjura H, Ohtsuka I (2002).Dough and baking properties of high amylose and waxy wheat flours. Cereal Chem. 79:491-495.
Crossref
|
|
|
|
|
Pallarés MG, León AE, Rosell CM (2007). Trigo. In: Léon AE, Rosell CM (ed.). De tales harinas, tales panes: granos, harinas y produtos de panificación em Iberoamérica. Córdoba, Hugo Báez Editor, cap 1:17-71.
|
|
|
|
|
Pasha I, Anjum FM, Butt MS (2009). Genotypic variation of spring wheats for solvent retention capacities in relation to end-use quality. LWT – Food Sci. Technol. 42:418-423.
|
|
|
|
|
Pelegrin AJ, Carvalho IR, Nardino M, Ferrari M, Szareski VJ, Belle R, Meier C, Webber TA, Gutkoski LC, Souza VQ (2016). Technological quality of wheat under nitrogen management. Int. J. Cur. Res. 8(6):32932-32936.
|
|
|
|
|
Pike PR, Mac Ritchie F (2004). Protein composition and quality of some new hard White Winter wheats. Crop Sci. 44:173-176.
Crossref
|
|
|
|
|
Pimentel-Gomes F (2000). Experimental statistics course. 14th ed. Piracicaba 477 p.
|
|
|
|
|
Rcbptt (2011). Technical information for wheat and triticale - crop 2012.Dourados P 204.
|
|
|
|
|
Scheuer PM, Francisco A, Miranda MZ, Limberg VM (2011). Trigo: características e utilização na panificação. Ver. Bras. Prod. Agroind. 13(2):211-222.
Crossref
|
|
|
|
|
Sema (Secretaria Estadual do Meio Ambiente) (2005). Management plan TurvoState Park. Porto Alegre P 348.
|
|
|
|
|
Silva JGC (2007). Experimental Statistics: Design of Experiments. Universidade Federal de Pelotas: Pelotas P. 531.
|
|
|
|
|
Wrigley CW (1994). Developing better strategies to improve grain quality for wheat. Aust. J. Agric. Res. 45:1-17.
Crossref
|
|