Soil potassium is classified as unavailable, readily available and slowly available (fixed) K forms. A research was conducted to determine the distribution of forms of K (water soluble K, exchangeable K, non-exchangeable K and total K) and their relation with some soil properties under enset farming systems of Sidama zone in South Ethiopia. The soils were collected from ‘Qola’ (dry, hot tropical climate and moist to humid), ’Woinadega’ (warm subtropical climate) and ‘Dega’ (wet and cool temperate climate). In the study, coefficient of variance (CV%) for sand, soil organic matter (SOM), total nitrogen (TN), available phosphorus, water soluble K, exchangeable K, non-exchangeable K and percent potassium saturation were high (>30%). The high, medium and low proportions of acidic reaction were determined in Hula, Dale and Hawassa-Zuriya districts, respectively. The concentrations of total K in the soils ranged from 1358.9 to 3181.5 (mg/kg) where the Hula district soil show the lowest value. Water soluble K and exchangeable K concentrations in the soils ranged from 14.7 to 110.5 mg/kg and 130.9 to 1134.9 mg/kg, respectively, where the lowest values were indicated by Hula district. The Hawassa-Zuriya district soils had the highest concentrations in both exchangeable and water soluble K. The non-exchangeable K concentrations varied from 241.5 to 1714.9 mg/kg. It constituted the highest proportion of the total K measured in the soils, while the proportion of water soluble K in the total K measured was the lowest. Nearly all soils of Hula and Dale districts indicated low ratio of K:Mg. Almost all of the Hula district soils and about 50% of the Dale district soils had potassium saturation percent (KSP) values below critical level. Significant indirect and direct associations existed among soil physico-chemical properties. All forms of soil K correlated significantly and positively with pH, PBS and silt, and negatively correlated with SOM and Al+3.
Potassium (K) is a macro element in plant, animal and human nutrition (Simonsson et al., 2009). It is necessary for the functioning of all living cells, and is thus present in all plant and animal tissues. Potassium is required in large amounts by plants, animals and humans (Hamdallah, 2004) because it plays a critical role in plant nutrition and physiology. Many plants frequently absorb greater potassium than nitrogen and phosphorus. It is extracted in large quantities by intensive cropping systems (Panaullah et al., 2006) and hence regularly applied to agricultural lands in many areas (Rangel, 2008). Soil potassium is classified (based on its availability to plants) into relatively unavailable, readily available and slowly available or exchangeable K forms. Water soluble and exchangeable (K held on soil colloid) forms are known to be readily available K pools constituting 1 to 2% of the soil total K (Brady and Weil, 2002).
Over 95% of potassium in tropical soils occurs as relatively unavailable forms contained in primary and secondary minerals including feldspars, muscovites, biotites and illites (Olaitan and Lombin, 1984). Mineral (structural) K is unavailable form of potassium in the short-term periods and constitutes about 90-98% of all soil K (Hoeft et al., 2000). Defoer et al. (1998) noted that these minerals are quite resistant to weathering and so they release K very slowly. Non-exchangeable K is not readily available to plants. However it is in equilibrium with available forms and consequently acts as an important reservoir of slowly available K (Srinivasarao et al., 2010). Generally, the K held at inter-lattice positions is non-exchangeable K and it is not exchangeable by NH4OAc (Lalitha and Dhakshinamoorthy, 2013). Potassium forms distributed in the soil are in equilibrium with each other.
The equilibrium between them determines the status of K in the soil and the potential of its supply to plants (Pavlov, 2007). It is affected by physical, chemical, biological and climatic factors (Barre et al., 2008). This could be related to clay mineralogy (Barre et al., 2008), moisture (Zeng and Brown, 2000) and texture (Pal et al., 2001). Furthermore, soil K forms and their equilibrium in soil could be related to cation exchange capacity (Sardi and Csitari, 1998), pH (Uribe and Cox, 1988), and concentrations of other ions (Zawartka et al., 1999) of the soil. In addition to these soil properties, fertilization and cropping system are the most important management factors that influence potassium equilibrium in soils (Simonsson et al., 2007). In this way, an exceeded tillage and the abandonment of soil erosion could destabilize this equilibrium between soil physical and chemical properties (Bogunovic et al., 2017; Martínez-Hernández et al., 2017; Rodrigo-Comino et al., 2017).
Readily available pools of K are slowly depleted after prolonged periods of agricultural production and during removal of the agricultural products. Though, the dependence of plants on the release of fixed K to recharge the readily available pools when these are exhausted, the size of the fixed potassium pool in many soils, or the rate at which it is released, is insufficient to meet plant demand. This is common where crop production is intensive and/or when high-yielding production systems are established (Mikkelsen, 2007). Therefore, a clearer understanding of the distribution of potassium forms and their relationships with other physico-chemical properties are required to enable effective management of potassium supply and use. The main aim of the present study is to determine soil potassium forms, examine the relationships existing between the K forms and evaluate their relations with other soil physico-chemical properties under enset farming systems of Sidama zone, South Ethiopia. The results of this study are expected to shed light on the effects of some soil properties on the crop availability of potassium in the study area.
Study area
The study was conducted in Awassa-Zuriya, Dale and Hula districts of Sidama zone, Southern Ethiopia (Figure 1) in 2016. Sidama administrative zone is located within 5°45’- 6°45’N latitude and 38°-39° E longitude, covering a total area of 6,538.17 sq km of which 97.71% is land and 2.29% is covered by water (SZPEDD, 2004). It is bordered by Gedeo administrative zone in the south, North Omo administrative zone in the west and Oromiya regional state in the north and southeast. Sidama zone lies in the area varying from flat land (warm to hot) to highland (warm to cold). The regional and zonal capital, Hawassa, which is located in the northern tip of Sidama zone, has a distance of 275 km from Addis Ababa. In the present study, sample districts from the zone were randomly selected because nearly all areas in the zone have good potential for enset production irrespective of productivity variation due to rainfall and altitude discrepancy. The sites are located between 038°20'7.8" - 038°32'36.5"E and 06°28'15.5" - 07°04'50.3"N. A total of nine ‘Kebeles’ (peasant associations) were selected, of which 3 were from Awassa-Zuria, 3 from Dale and 3 from Hula district.
Soil sampling
Eighty one composite samples were collected in November 2015 from the three randomly selected districts in Sidama zone. Then, three ‘Kebeles’ in each district were also selected randomly. After selecting representative farmers’ enset farms in the ‘Kebeles’, each field was divided into three strata 12 m long in the direction from home vicinity to far located fields. Composite soil sample (12 cores) from each stratum was taken based on the method outlined by Hussen (2007). Twelve soil profiles of 50 cm depth were bored randomly using an auger and soils were collected in plastic pail. Samples collected from cores were placed on a plastic sheet with an area of 3 m2 and thoroughly mixed. Then, about 1 kg sample was taken and kept in a polyethylene plastic bag and labeled. Undisturbed samples were taken with a core sampler that is 10 cm long and 7.2 cm in diameter for bulk density determination. Before laboratory analysis, samples were air-dried at room temperature, ground using mortar and pestle, homogenized, and passed through a 2 mm sieve. Finally, samples were stored in clean and dry area at room temperature until the time of use.
Physico-chemical analysis
Selected soil physical and chemical properties were analyzed at Horticoop Ethiopia (Horticultural) PLC in Addis Ababa and at Hawassa College of Teacher Education. Particle size analysis was performed using the Bouyoucous hydrometer method (Bouyoucos, 1951). Bulk density was determined by core method (Black, 1965). Maximum water holding capacity was measured according to procedures in Piper (1996). The pH was determined in 1:2.5 soil-water suspension using a glass electrode (Jackson, 1973). Electrical conductivity (EC) was determined from the saturation extract (1:5 soil water ratio) of soils (Gupta, 2009). Organic carbon was determined by wet oxidation method (Walkley and Black, 1934). Total nitrogen (N) was determined by Kjeldhal method. Mehlich III extractant was used to extract phosphorus (P), potassium, calcium (Ca), magnesium (Mg), sodium (Na) and sulfur (S) (Mehlich, 1984). The concentration of nutrients was determined by inductively coupled plasma-atomic emission spectrometry (ICP-AES). Cation exchange capacity (CEC) was determined using ammonium acetate method (Sumner and Miller, 1996).
Water soluble K was extracted with deionized water (1: 5 w/v) after shaking for 30 min on a mechanical shaker and later, the contents were centrifuged to separate clear extract (Jackson, 1973). The exchangeable potassium was determined using Mehlich III extractant (Mehlich, 1984). The non-exchangeable potassium was extracted by adding 25 ml of 1 M HNO3 to 2.5 g of soil and boiling for 15 min (Helmke and Sparks, 1996). Total K was estimated by the digestion of soil samples (ground to pass through 0.17 mm sieve) in HF-HClO4-HNO3 acid mixture (McKeague, 1978). Potassium in different soil extracts was analyzed using the flame photometer. Soil organic matter (SOM) was estimated by multiplying the soil organic carbon by 1.72 (Baldock et al., 1999). The different values for the various soil fertility parameters were rated using the EthioSIS adopted critical levels (Ethiosis, 2014).
Statistical analysis
Data analyses were performed with the statistical analysis system (SAS Institute, 2012). The soil data generated were subjected to analysis of variance (ANOVA) using the general linear model procedure. Tukey’s Studentized Range (HSD) test was used to determine the differences among soil samples from different districts based on the measured K forms and other soil properties at P = 0.05. The simple correlation analysis of data was computed in relation to the potassium amount with physico-chemical properties of soil under study.
Soil physical properties
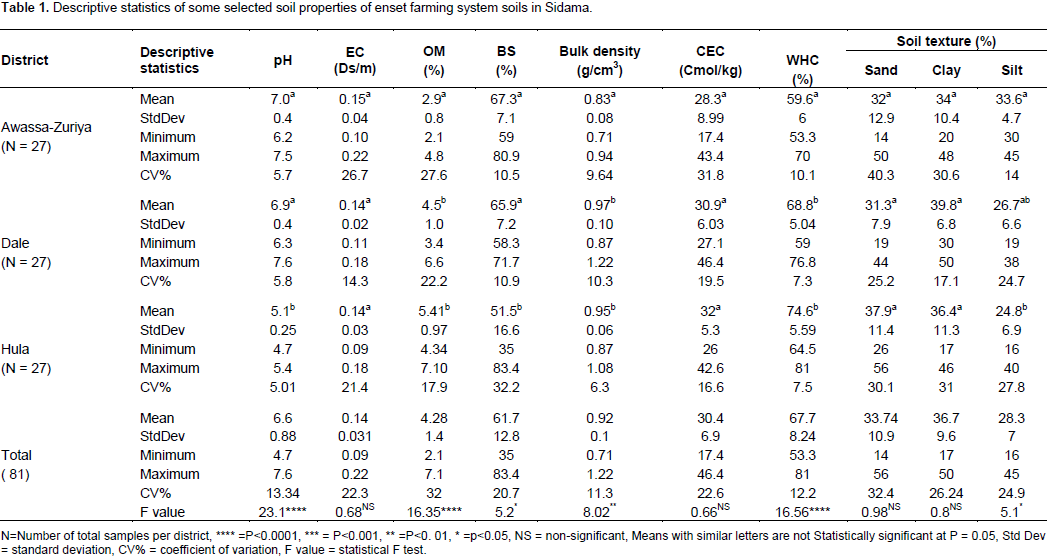
Selected physical and chemical properties determined in the soils are summarized in Tables 1 and 2. For all soil properties determined, Tukey’s (HSD) means comparison test was employed to show means that indicate statistically significant differences. The proportions of sand, silt and clay varied from 14 to 56, 16 to 45 and 17 to 50% for Awassa-Zuriya, Dale and Hula districts, respectively. Based on Gomes and Garcia (2002), CV value of sand for all district soils was very high (>30%) indicating wide variability in sand proportion. The results indicate that most of the soils contained relatively higher proportion of clay as compared to silt and sand, but among the districts, Hula district had highest sand contents (Table 1). Percentage of clay soils in Dale and Hula districts was high (55.6%) while only 22.2% of the studied soils were clay in Awassa-Zuriya.
Therefore, site specific K fertilizer recommendation is required to boost crop productivity since most soils of these areas are clay soils (Lelago et al., 2016) that could fix exchangeable K and reduce its availability for plants (
http://www.ata.gov.et/highlighted-deliverables). Bulk densities (g/cm
3) of the soils of Awassa-Zuriya, Dale and Hula districts varied from 0.71 to 0.94, 0.87 to 1.22 and 0.87 to 1.08, respectively. Mean bulk density of Awassa-Zuriya was lowest (P<0.01) and statistically different from that of Dale and Hula districts. The maximum percent water holding capacity (WHC) of the soils of Awassa-Zuriya, Dale and Hula districts varied from 53.3 to 70, 58.96 to 76.81 and 64.52 to 80.97, respectively. Among the districts, Awassa-Zuriya soils were found to hold less water (59.6%) as compared to Dale and Hula district soils (P<0.0001).
Soil chemical properties
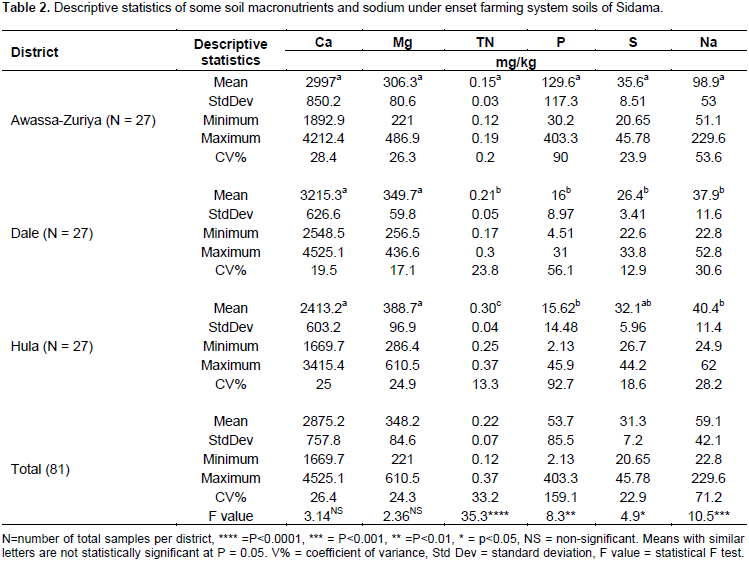
The pH values of the soils of Awassa-Zuriya, Dale and Hula districts varied from 6.2 to 7.5, 6.3 to 7.6 and 4.7 to 5.4, respectively. According to EThiosis (2014), it indicated wide range of variation from strongly acidic to moderately alkaline and all of the soil samples of Hula district were strongly acidic in reaction. Percent SOM of the studied soils were very variable (CV>30%) and shows high significant difference among the districts (P<0.0001) (Table 1). It ranged from 2.1 to 7.1% and was observed to increase with decrease in pH. Exchangeable Ca2+ and Mg2+ of the soils ranged from 1669.7 to 4525.1 and 221 to 610.5 mg/kg, respectively (Table 2) and increased with increase in soil pH (Van diest, 1978). The cation exchange capacity (CEC) varied from moderate to very high (Landon, 2014) and ranged between 17.4 and 46.4 meq/100g.

Base saturation (BS) of the soils ranged from 35 to 83.4 and it was low in Hula district as compared to the other districts (P<0.05) (Table 1) and increased with increase in soil pH. If BS is considered as a criteria for leaching, about 55.56% of Hula, 77.78% of Dale and 66.67% of Awassa-Zuriya districts soils were, moderately leached (30 to 50% BS), weakly leached (50 to 70% BS) and very weakly leached (70 to 100% BS), respectively (Pam and Murphy, 2007). Electrical conductivity (EC) of Awassa-Zuriya, Dale and Hula districts soils ranged from 0.1 to 0.22, 0.11 to 0.18 and 0.09 to 0.18 dSm-1, respectively (Table 1). According to EthioSIS (2014), all the soil samples analyzed were salt free.
Available phosphorus, sulfur and total nitrogen (TN)
The TN status of the study area ranged from 0.12 to 0.37 mg/kg and was noticeably variable, CV>30% (Gomes and Garcia, 2002) (Table 2). The results showed that available phosphorus content varied from 2.13 to 403 mg/kg and decreased with decrease in soils pH. Moreover, extremely high variation (CV% =159) in available phosphorus was found among the districts, while maximum within the district variability was recorded for the Hula (high land) soils. The result is in line with the findings of Mamo et al. (1998) who reported the variable P status for Ethiopian highland soils. The available S ranged from 20.65 to 45.78 mg/kg in soils of the study area and significant difference between means was indicated for Dale and Awassa-Zuriya districts (P<0.05).
Forms of potassium in the soils and percent potassium saturation (KSP)
Data of various forms of K determined in the soils and percent potassium saturation are presented in Table 3. For all samples, coefficient of variation (CV%) values of water soluble K, exchangeable K, non-exchangeable K and percent potassium saturation were 75.6, 82.13, 48.99 and 68.2%, respectively. This indicated that the distribution of the different K forms and percent K saturation in the soils varied considerably (Gomes and Garcia, 2002). It may be attributed to the differences in the chemical properties of the soils and possibly the extent to which K ions in the different agro-ecologies have leached due to variations in the rain intensity among the districts (Jones, 1982) and variations in the amounts of animal manure applied from district to district. Total soil K contents give an indication of the relative amounts of K-containing minerals in soils. In the study, total K values ranged from 1358.9 to 3181.5 mg/kg (Table 3). Wild (1971) reported total potassium that varied between 596.7 and 39799.5 mg/kg in 31 soils from the savanna zone of Nigeria. He noticed the dependence of total K content on the nature of parent material from which the soil was formed.
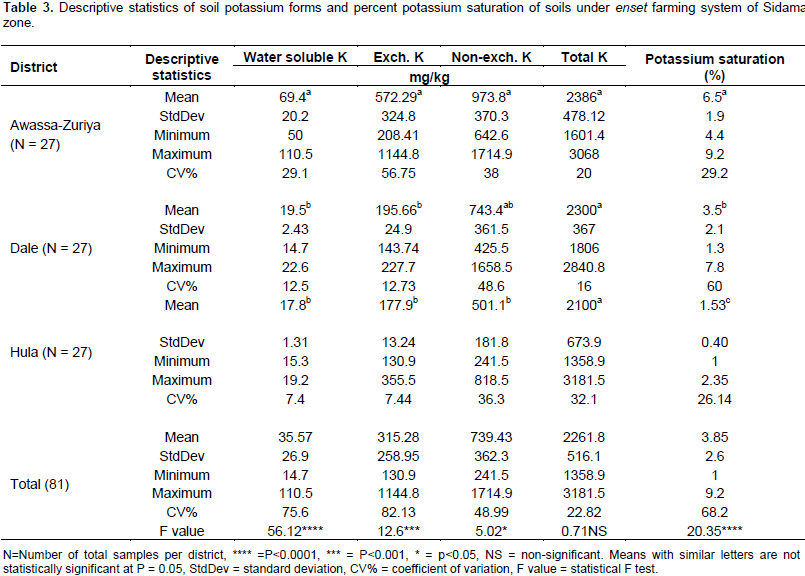
The present results are far below this range, indicating narrow range and that the soils are from somewhat related mineralogy. When each district was considered separately, total K ranged from 1601.4 to 3068, 1806 to 2840.8 and 1358.9 to 3181.5 mg/kg in enset farming system soils of Awassa-Zuriya, Dale and Hula districts, respectively (Table 3). The mean values for the soils of Awassa-Zuriya, Dale and Hula districts were found to be 2386, 2300 and 2100 mg/kg, respectively with the highest range observed in Hula which was followed by Awassa-Zuriya. The high ranges in Hula and Awassa-Zuriya shows variations in the soils’ mineralogy, while comparatively narrow range in Dale was observed, indicating little mineralogical variation among the Dale soils. The Hula district, which had higher mean percentage clay content (36.4%) and lowest mean soil pH (5.1), showed the lowest mean (2100 mg/kg) total K content. This is in good agreement with Suddhiprakarn et al.(2010) who noted that high soil clay contents with low soil pH are often associated with low total K concentration.
It indicates that the Hula soils are highly weathered and leached of basic cations. According to Gomes and Garcia (2002), distribution of total K in Hula district showed very high variations (CV% > 30) probably due to variations in the amounts of manure applied and differences in the chemical properties of the soils. Over all, there were no significant differences in total K means among the studied districts. Potassium present in soil solution as soluble cation is termed as water soluble K. It is readily absorbed by the plants and relatively unbound by cation exchange forces and invariably subject to leaching losses in relation to soil properties (Lalitha and Dhakshinamoorthy, 2013). In the present study, it ranged from 50 to 110.5, 14.7 to 22.6 and 15.3 to 19.2 mg/kg for Awassa-Zuriya, Dale and Hula districts, respectively. The mean values were 69.4, 19.5 and 17.8 mg/kg for Awassa-Zuriya, Dale and Hula districts, respectively. In proportion, about 55.6 and 100% of Dale and Hula districts were low in soil solution K status, respectively.
The values in these areas were lower than the critical value of 19.5 mg/kg which was proposed by International Potash Institute (IPI, 2001) for water extractable potassium. These low values do not retard the release of exchangeable K, but are not enough to support plant growth. However, the release of exchangeable K is not fast enough to meet the requirement for rapidly growing crops (Bhaskarachary, 2011). The soil solution K status of Awassa-Zuriya (district with comparatively high sand and least clay proportion) was above the critical value indicating high probability of its leaching (Jones, 1982) (Table 1). The result is in line with the findings of Moraes and Dynia (1992) who found that sandy soils have greater K concentrations in solution than clayey soils. In sandy soils, a greater proportion of exchangeable K is present on planar (loose) sites which release K more readily than edge or interlayer positions (Sadusky et al., 1987). The exchangeable K status ranged from 208.41 to 1144.8, 143.74 to 227.7 and 130.9 to 355.5 mg/kg in enset farming system soils of Awassa-Zuriya, Dale and Hula districts, respectively (Table 3).
The mean values for the soils of Awassa-Zuriya, Dale and Hula districts were found to be 694.7, 428.1 and 189.8 mg/kg, respectively. According to the critical level adopted by EthioSIS (2014), 33.33 and 88.89% of Dale and Hula districts fall in low (90 to 190 mg/kg) exchangeable K status, respectively. The exchangeable K status of 55.56, 66.67 and 11.1% of Awassa-Zuriya, Dale and Hula, respectively was found to fall within the optimum range (190 to 600 mg/kg). The other 22.22% of Awassa-Zuriya district soils was high (600 to 900 mg/kg) in exchangeable K status with the remaining 22.2% very high (>900 mg/kg) in exchangeable K. As with the low total K concentrations measured in the Hula district soils, the exchangeable and water soluble K concentrations were also low in almost all the samples. This observation can be attributed to the lowest mean soil pH (5.1) since most of the K+ ions are displaced into the soil solution where leaching loss is high. The higher available K concentration measured in the higher pH (7.0) in Awassa-Zuriya appears to confirm this conclusion.
Here, the higher content of exchangeable K may be due to the predominance of potassium rich minerals such as mica containing minerals (Patil et al., 2011). Over all, the status of available K indicated the need for site specific K management for Dale district, while Hula requires K recommendation for all its areas. When the Awassa-Zuriya district is considered, the high solution K could be lost through leaching in summer seasons (Jones, 1982) and hence K recommendation could also be required as a soil management alternative. Potassium: magnesium ratio of the Awassa-Zuriya district soils were greater than 0.7. This indicates that there is no interference of Mg in K uptake (Mg induced K deficiency) (Loide, 2004). On the other hand, potassium : magnesium ratio was found to be less than 0.7 for nearly all soils of Hula and Dale districts indicating Mg induced K deficiency. Similarly, Hailu et al. (2015) reported lower ratio of K to Mg (less than 0.7) and added that Mg might induce K deficiency in soils of southern and central highlands of Ethiopia, respectively. This pointed out that both Dale and Hula districts require recommendation for K fertilizers to boost crop productivity.
The non-exchangeable K measured in the soils varied from 241.5 to 1714.9 mg/kg. It ranged from 642.6 to 1714.9, 425.5 to 1658.5 and 241.5 to 818.5 mg/kg for Awassa-Zuriya, Dale and Hula districts, respectively. The mean values were 973.8, 743.4 and 501.1 mg/kg for Awassa-Zuriya, Dale and Hula districts, respectively. According to the critical level adopted by Srinivasarao et al. (2007) for nitric acid extractable potassium, 3.7, 25.9 and 70.4% of the studied soils were low (<300 mg/kg), medium (300 to 600 mg/kg) and high (>600 mg/kg), respectively in non-exchangeable K. From this, it can be said that nearly all soils were good in K supplying power. Moreover, the results indicated that water soluble, exchangeable and non-exchangeable K concentrations measured in the soils accounted for 0.6 to 4.6, 5.3 to 55.8 and 14.1 to 66.8% of total K concentrations; respectively, indicating that the non-exchangeable K concentrations in the soils constituted the highest proportion of the total K, while the water soluble K accounted for the lowest proportion of the total K.
Considering the proportions of all the various forms of K to the total K in the Hula district, the value for the non-exchangeable K pool was the highest (32.9%). This observation might also be explained by the low pH of the soil in the Hula district. The percentage of CEC saturated with K (KSP) for all the soils ranged between 1 and 9.2%, with a mean of 3.9%. Although, the KSP mean value of all soils is higher than the critical value (2.3) proposed by FAO-UNESCO (1997), 44.4% of Dale and 88.9% of Hula district soils were found to be below the critical level. This indicated the saturation of CEC with other cations while the proportion of potassium ions is very minimal particularly in Hula district. On the other hand, all soils in Awassa-Zuriya district contained KSP above the critical value.
Correlations among forms of soil K and some selected soils properties
Results of simple correlation analysis between different forms of K and some soil chemical properties are given in Table 4. All the K forms negatively correlated with organic matter while significant correlation existed between SOM, water soluble K (r= 0.5141, P<0.01) and exchangeable K (r= 0.4370, P<0.05). This indicated that the experimental soils are not characterized by variable charge systems (pH dependent charges) (Van Ranst, 2006). Thus, the charge generated could be negative and does not depend on the pH of the soil and created due to isomorphous substitution of cations in clay minerals. Positive and significant correlations occurred between pH and water soluble K (r= 0.5496, P<0.01), exchangeable K (r= 0.7034, P<0.0001), non-exchangeable K (r= 0.5833, P<0.01), but insignificantly correlated with total K (Table 4). The correlation observed between soil pH and K forms (water soluble and exchangeable K) is in agreement with Kozak et al. (2005) who reported positive correlation of available K forms with pH. The study demonstrated that K forms correlated positively with PBS where non-exchangeable (r= 3892, P<0.05) and total K (r= 0.5429, P<0.01) indicated significant correlation.
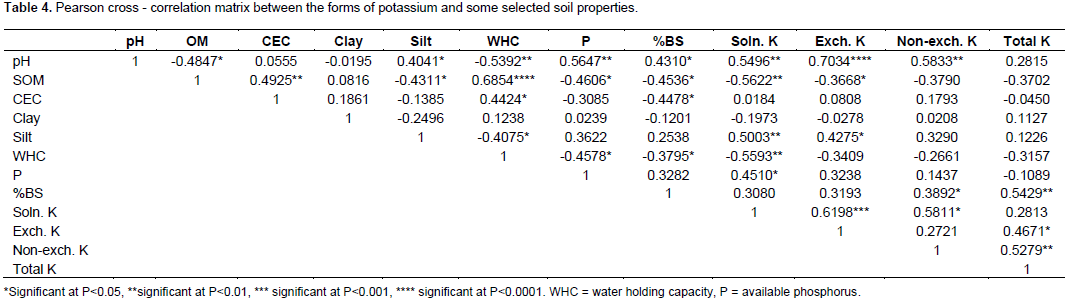
Furthermore, water soluble K significantly (P < 0.05) and negatively (r = -0.5593) correlated with WHC, while exchangeable, non-exchangeable and total K correlated negatively and insignificantly. The present finding agreed with the finding of Barber (1978) who observed that high moisture content adversely affected the mobility of K into the soil solution. The study showed that the Hula district with mean clay of 36.4%, which had the highest percentage gravimetric soil moisture content (74.6%), recorded the lowest levels of all the K forms determined. This was in line with Greg et al. (2011) who noticed less mobility of potassium from the exchangeable site into the soil solution in fine textured soil with high proportion of water held. All the K forms positively correlated with silt proportion while only significant correlation existed between water soluble K (r= 0.5003, P<0.01) and exchangeable K (r= 0.4275, P<0.05). This suggested that K status of the soils is largely governed by finer fraction of soil. Lastly, there occurred significant (P<0.05) and positive (r= 0.4510) correlation between water soluble K and available phosphorus.
The study showed the existence of significant (P < 0.001) positive correlation (r = 0.6198) between water soluble and exchangeable K, and between water soluble K and non-exchangeable K (r = 0.5811, P < 0.05). This observation is in agreement with Ghiri et al. (2011) who reported positive and significant associations among available and fixed K. It was not unexpected because exchangeable potassium is usually released into the soil solution from the exchange complex when plants and/or leaching deplete the soluble potassium since they are in equilibrium. Exchangeable K pool is also in equilibrium with fixed or non-exchangeable K and as K is depleted from exchange site due to the equilibrium position shift tosoil solution, non-exchangeable K pool starts to replenish the exchangeable K pool. Further, there occurred significant (P<0.05) and positive correlation (r= 0.4671) between exchangeable and total K, and between non-exchangeable and total K (r= 0.5279, P<0.01), while positive but insignificant correlation existed with water soluble K. Similar results were reported by Venkatesh and Sathyanrayan (1994) in some black soils of North Karnataka, India. Generally, all the forms of soil potassium in this study were inter-correlated, indicating the existence of dynamic equilibrium among them and release of K from non-exchangeable pool to available pool for crop uptake (Venkatesh and Sathyanarayana, 1994).
Wide variability among the districts was observed in water soluble K, exchangeable K, non- exchangeable K and percent potassium saturation, indicating potassium fertility gaps. The high clay soils percent (55.6%) in Dale and Hula districts indicated the need for site specific K fertilizer application since exchangeable K could be fixed by clay and its availability may be reduced. The high proportion of acidic reaction in Hula with medium at Dale district, and low at Awassa-Zuriya reveals variations in leaching of exchangeable bases where increased leaching loss is expected in soils of low pH. This agreed with the lowest mean total K content (2100 mg/kg) in Hula. The total K content in Hula might also be affected by its high mean clay percentage (36.4%).
The study also showed the moderate leaching of base cations in Hula if PBS is considered as criteria for leaching. Over all, the water soluble and exchangeable K pools at Hula were low and high at Awassa-Zuriya. At Dale, nearly half of the soils studied had low water soluble and exchangeable K pools. The low status of both K pools particularly in Hula may be due to the lowest mean soil pH (5.1). Soils of Hula and Dale districts were not only low in the available K status. They were also low in available P while most of the Awassa-Zuriya district soils had low TN. On the other hand, nearly all soils of Hula and Dale districts had less than 0.7 potassium : magnesium (K:Mg) ratio, indicating Mg induced K deficiency, while the potassium saturation percent (KSP) of almost all the Hula soils and some of the Dale soils was below the critical level (2.3).
It can therefore be concluded that site specific potash fertilization and all areas of potash fertilization would be required for Dale and Hula, respectively for sustainable crop production. Moreover, potash fertilizer recommendation may also be required as a soil management alternative in Awassa-Zuriya since water soluble K is high and could be lost through leaching in summer season. This study also indicated that the non-exchangeable K measured in the soils was sufficient. This indicated good capacity of soils in K supplying power. It also found that the proportion of non-exchangeable K was highest in the total K. Lastly, correlations study indicated positive effects of pH, PBS and silt% on K forms while SOM and WHC negatively affected them. The later indicates that the soils are not characterized by variable charge systems. Finally, positive relationships existed among soil K forms, indicating dynamic equilibrium between them.