Full Length Research Paper

ABSTRACT
Smallholder dairy farmers occupy high potential areas of Kenya and are a source of manure, crops and milk. There is need to use other means of characterising smallholder dairy farmers as they mostly practice mixed farming. The objective of this paper is to use cluster analysis method to characterize the smallholder dairy farmers with added farmer and activity data variables. Clusters of 336 farmers in this study were derived using 28 key variables. This paper demonstrates how to conduct farmer assessments for climate change adaptation activities, climate smart technologies implementation using knowledge of key farmer variables and their distribution in the smallholder dairy farmers of Nandi County, Kenya. This paper demonstrates the importance of integrating agricultural information for smallholder dairy farmers to machine models to characterize the groups and observe the natural groupings. This allows for policy managers to know the key characteristics and how to use them in policy implementation especially in designing climate change adaptation programs factoring education and training of farmers as demonstrated in this paper that they are practicing many activities on their farms.
Key words: Cluster analysis, smallholder dairy farmers, farm utilisation, climate change adaptation.
INTRODUCTION
Sub-Saharan Africa (SSA) has the fastest growth in agriculture and the greatest level of agricultural imports compared to other global regions (Livingston et al., 2011). This growth follows huge demand for food and thus the importance of smallholder agriculture to the food security is cemented for this SSA (Bellarby et al., 2014).Smallholder farmers play a key role in development in Africa especially in recent years (Hammond et al., 2015; Livingston et al., 2011; Salami et al., 2010). Smallholder farmers are always characterised in many studies based on land size (Bebe et al., 2002; Herrero et al., 2014; van Averbeke and Mohamed, 2006).
Climate change adverse impacts are heavily felt by the smallholder farmers such as changes on climate variables of rainfall and temperature (Altieri and Koohafkan, 2008; Koohafkan et al., 2012). There exists great diversity in smallholder farmers despite the key variable used for characterizing smallholder farmers, that is farm size (Bebe et al., 2002; Brandt et al., 2018). This diversity is observed as smallholders farmers do mix livestock and crop production and such diversity is seen in smallholder dairy farmers in SSA (Bebe et al., 2002; Oborn et al., 2017; Staal et al., 2002). One of the main reasons climate change affects smallholder farmers is the extra mining of nutrients on their farms, which leads to lower production and also higher susceptibility to climate change effects (Bationo et al., 2004; Castellanos-Navarrete et al., 2015; Rufino et al., 2007).
Smallholder dairy farmers’ adaptation to climate change would need the characterization of these farmers with more variables other than farm size as the only limiting factor (Auburger et al., 2015; Herrero et al., 2014; van Averbeke and Mohamed, 2006; Vrieling et al., 2011). There is need for the characterisation of smallholder dairy farmers with additional variables such as land use sizes of the farms, labour, type of livestock housing and other key variables that define smallholders’ enterprise (Nyambo et al., 2019; Staal et al., 2002; Waithaka et al., 2007; Zake et al., 2010). These characterisation should use robust unsupervised models and integrated systems research to show natural groupings of smallholder dairy farmers to allow the policy makers to promote climate change adaptation practices (Nyambo et al., 2019; Oborn et al., 2017; Thompson, 2016). The lack of a characterisation of smallholder farmer with robust inclusion of key variables based on land survey limits options for policy makers as farm size reduces over time (Bebe et al., 2003). This paper seeks to use cluster analysis to characterize smallholder dairy farmers of Nandi County Kenya.
MATERIALS AND METHODS
Study area
The field study was conducted within Nandi County, Kenya (0.565°N, 34.736°E, 0.565°N, 35.437°E, 35.437°E, 0.118°S, 34.736°E, 0.118°S). Mean annual temperatures ranges from 18-22°C, with temperatures at lower elevations (< 1400 m) going as high as 26°C. Altitude ranges from approximately 600 m a.s.l. in the South to over 2200 m a.s.l. in the North east of the county. The highlands are recognized for their high agricultural potential (GOK, 2015; Mudavadi et al., 2001). Nevertheless, livestock and crop farming is mainly subsistence with average land sizes of approximately 4.5 ha per household. Dairy production is common throughout the county, with tea as a major cash crop, and maize as the primary staple crop (GOK, 2015).
Experimental design
Site classification
Agro-ecological zones (AEZ) were identified on the basis of altitude, rainfall, temperature and predominant land use (GOK, 2015). This resulted in three major AEZs: lower highland 1 (LH1: 1900-2400 m a.s.l., area of 934.3 km2, high seasonal variation in rainfall and thus having distinct long and short rains, main crops tea and maize). Lower highland 2 (LH2: 1400-1900 m a.s.l., area 1100.7 km2, low seasonal variation in rainfall characterized by bimodal rainfall – November-January as the short rains and May-July as the long rains, main crops tea and maize); upper midlands (UM: 1200-1400 m a.s.l. and an area of 364.7 km2 with high seasonal variation in rainfall, main crops Sugarcane and maize). A participatory mapping exercise was conducted using experts’ knowledge of personnel from the International Livestock Research Institute (ILRI) and Nandi county government to predict whether there were differences in dairy production systems across the AEZs. Thirty-six sampling points were generated with QGIS based on nearness to road infrastructure and masked away from forested areas with the assumption of no households on roads or in forests. The sampling points were kept away from forests since forests are legally gazetted by section 64 (1) of the Forest Conservation and Management Act, number 34 of 2016, prohibiting grazing (Republic of Kenya, 2016). The number of sampling points assigned to each of the three AEZ was weighted by the area of each individual AEZ (cluster), resulting in 15 sites each being located in LH1 and LH2 and six sites being located in the UM (Figure 1). At each of the 36 randomly selected points nine farmers were interviewed to generate a sample size of 336 households.
Household surveys and questionnaire
The household surveys were done using a questionnaire tool customized from the Integrated Modelling Platform for mixed Animal Crop systems (IMPACTlite) (Rufino et al., 2013). IMPACTlite was modified from IMPACT (Herrero et al., 2007) to collect household-level data, which was detailed enough to capture within-site variability on key farm performance and livelihood indicators. It was initially developed to encourage data sharing through standard protocols, and allowing tools to be linked to facilitate evaluations of various farming systems (Rufino et al., 2013). The household questionnaire was completed through face-to-face interviews with the household head using the Open Data Kit (ODK) platform (ODK, 2017). In case of absence of the household head, the most senior member available or the household member responsible for the farm was interviewed. A determination of the primary income categories (crop, dairy, poultry and others) as well as farm size and other farmer demographic data on literacy, age and gender were collected. From this, four animal confinement systems were defined: ‘fence only (F)’, ‘fence and floor (FF)’, ‘fence and roof (FR)’ and ‘fence, roof and floor (FRF)’. The animal confinements formed the base for manure management systems so as to be able to relate the confinement with the manure management systems in use.
Manure management systems were classified according to Table 10.18 provided in the guidelines for GHG emission estimates [26]Manure management systems were classified according to Table 10.18 provided in the guidelines for GHG emission estimates (IPCC, 2006) and were characterized based on the state of manure being deposited, the location where the manure is stored as well as the duration of storage. The state of manure was either defined as ‘fresh’- period less than 24 h from excretion, ‘dry’ - period more than 24 h from excretion, or ‘bioslurry’ – that is from biodigesters or farms with pit or lagoon, where liquid manure is collected. Manure handling and storage was characterized as: ‘heap for composting’, ‘pit for fresh or dry manure’, ‘heap of botheither fresh or dry manure’ and ‘pit/lagoon for slurry’. The duration of manure storage before utilization on farm is a proxy for manure quality. Therefore, classification of manure storage was done according to three periods: less than 1 month equalingequalling good quality, 3-4 months meaning reduced quality, and greater than four months equalling least manure quality.
Cluster analysis
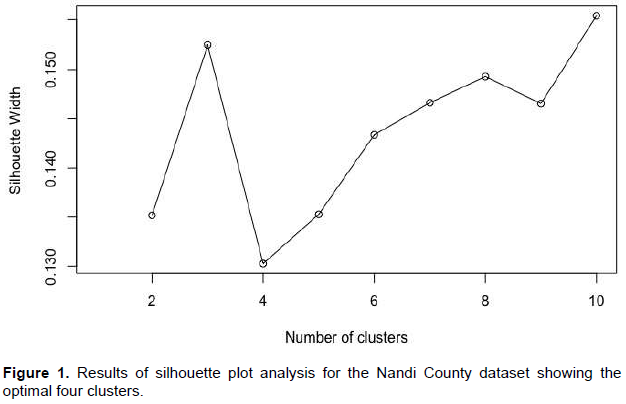
Unsupervised learning algorithm was used for cluster analysis. This algorithms was K-means (Chibanda et al., 2009; Nyambo et al., 2019). In the analysis, the number of groups (K) represented how many farm typologies (clusters) could be defined for each dataset. The number of clusters that best represented the data was determined using the Elbow method (where a bend or elbow in a graph showing decline of within cluster sum of squares differences as the number of clusters increases provides the best solution) (Nyambo et al., 2019) The elbow method examines the percentage of variance explained by the clustering as a function of the number of clusters k (Kingrani et al., 2017; Syakur et al., 2018). The K-means algorithm has been widely used in non-hierarchical clustering and characterizing smallholder dairy farms (Kingrani et al., 2017; Nyambo et al., 2019; Tittonell et al., 2010). The algorithm uses Euclidean distance measures to estimate weights of data records. The algorithm is presented as Equation 1, with a segment of the Euclidean distance as in Equation 1.
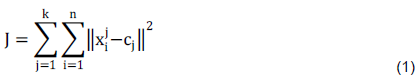
where  computes the Euclidean distance as in Equation 1; k =
number of clusters, n=number of observations, j=minimum number of clusters, i= minimum number of observations, xi=Euclidean vector for any ith observation, and cj =cluster centre for any jth cluster. Production cluster outputted from the clustering algorithm was validated in three ways: (1) assessment of cluster robustness, (2) comparison of the cluster membership reallocation (differential allocation of households to clusters for training and testing datasets), and (3) evaluation of the proportion of variation explained by the clusters.
Feature selection
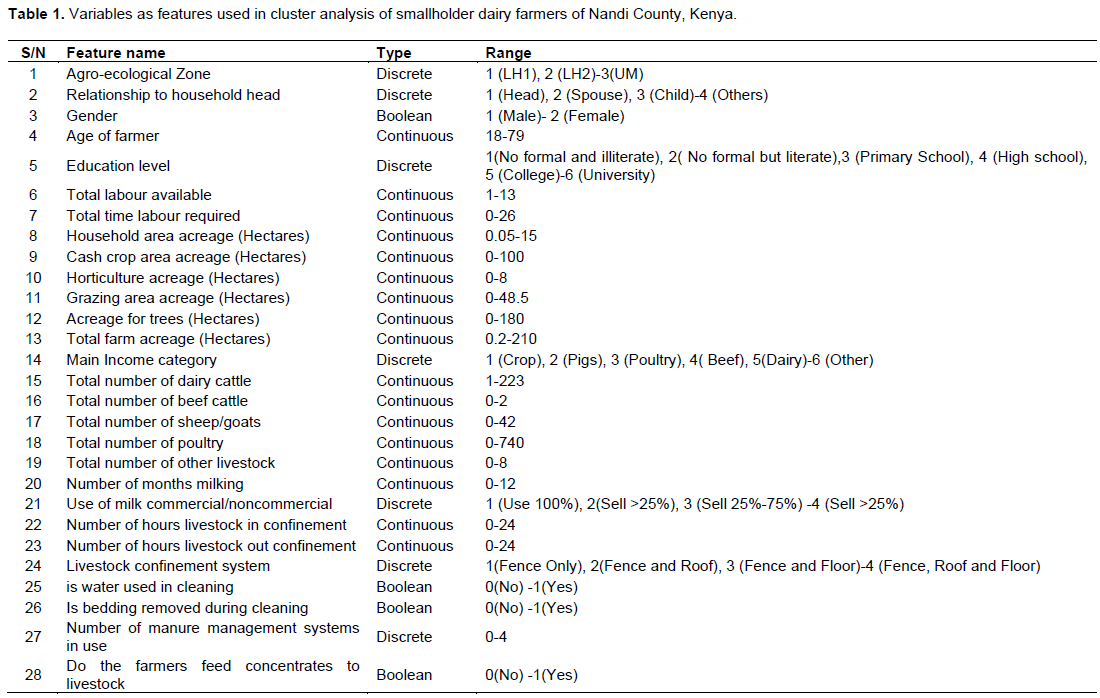
The top 28 features synthesised from literature on smallholder dairy farmers were tabulated (Table 1). These variables have been known to influence productivity in smallholder dairy farming based on experts’ domain knowledge. These features and their amounts were Boolean, Discrete and continuous and derived from household survey of 336 smallholder dairy farmers in Nandi County. These variables would be used to identify ‘natural groupings’ of these 28 features to derive the number and type of clusters [17], [27], [29]. This was done by minimising the squared Euclidean distance within a decreasing number of clusters containing an increasing number of positively related variables and using Base R Package (RStudio V 1.1.442) within which dendrogram and plot showing optimal number of clusters using k means was generated [27]. Each of the variables used in clustering was described as percentages (gender, education level, income category) and means (age, acreage under grazing, total acreage, household labour numbers, household dairy numbers and number of manure management systems in use per household). Prediction accuracies were obtained by developing the clustering model in a training dataset (70% of all records) and the resulting model reapplied to a testing dataset (remaining 30%) [17]. Rank analysis using the spearman correlation coefficient was used to evaluate the level of features reallocation between clusters. Hierarchical clustering was applied and It works in a bottom-up manner. That is, each variable object is initially considered as a single-element cluster (leaf). At each step of the algorithm, the two clusters that are the most similar are combined into a new bigger cluster (nodes). This procedure is iterated until all points are member of just one single big cluster (root). Quality control was achieved by using Cross clustering is a partial clustering algorithm that combines the Complete Linkage algorithms and Ward’s minimum variance providing automatic estimation of a suitable number of clusters and identification of outlier elements [31].(Chibanda et al., 2009; Nyambo et al., 2019; Syakur et al., 2018). This was done by minimising the squared Euclidean distance within a decreasing number of clusters containing an increasing number of positively related variables and using Base R Package (RStudio V 1.1.442) within which dendrogram and plot showing optimal number of clusters using k means was generated (Chibanda et al., 2009). Each of the variables used in clustering was described as percentages (gender, education level, income category) and means (age, acreage under grazing, total acreage, household labour numbers, household dairy numbers and number of manure management systems in use per household). Prediction accuracies were obtained by developing the clustering model in a training dataset (70% of all records) and the resulting model reapplied to a testing dataset (remaining 30%) (Nyambo et al., 2019). Rank analysis using the spearman correlation coefficient was used to evaluate the level of features reallocation between clusters. Hierarchical clustering was applied and it works in a bottom-up manner. That is, each variable object is initially considered as a single-element cluster (leaf). At each step of the algorithm, the two clusters that are the most similar are combined into a new bigger cluster (nodes). This procedure is iterated until all points are member of just one single big cluster (root). Quality control was achieved by using cross clustering in a partial clustering algorithm that combines the Complete Linkage algorithms and Ward’s minimum variance providing automatic estimation of a suitable number of clusters and identification of outlier elements (Tellaroli et al., 2016).
RESULTS AND DISCUSSION
Clustering
Based on the Elbow method, a four-cluster solution was found to be optimal for Nandi County dataset and was fitted in the clustering model (Figures 1 and 2). This was confirmed even by quality control using cross clustering and outliers. Cluster analysis was used to classify the smallholder farmers and examine how key variables of acreage for grazing, total acreage, education level, number of dairy cattle in the households and manure management affect their labour practices and major income categories and also classify them (Table 2). This agrees with observations from other studies on smallholders where such variables were enumerated (Nyambo et al., 2019). The study found that there are four classes split by gender and major income categories.
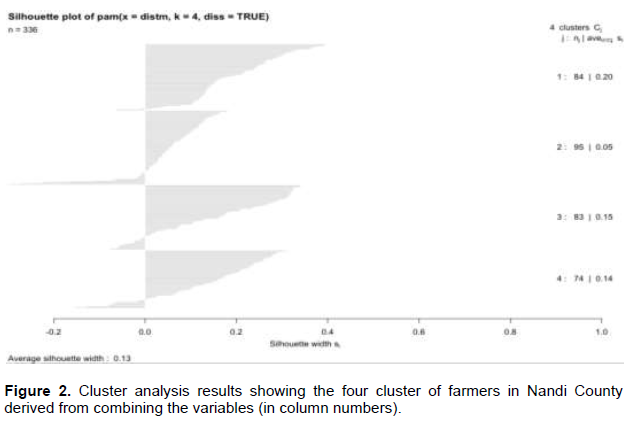
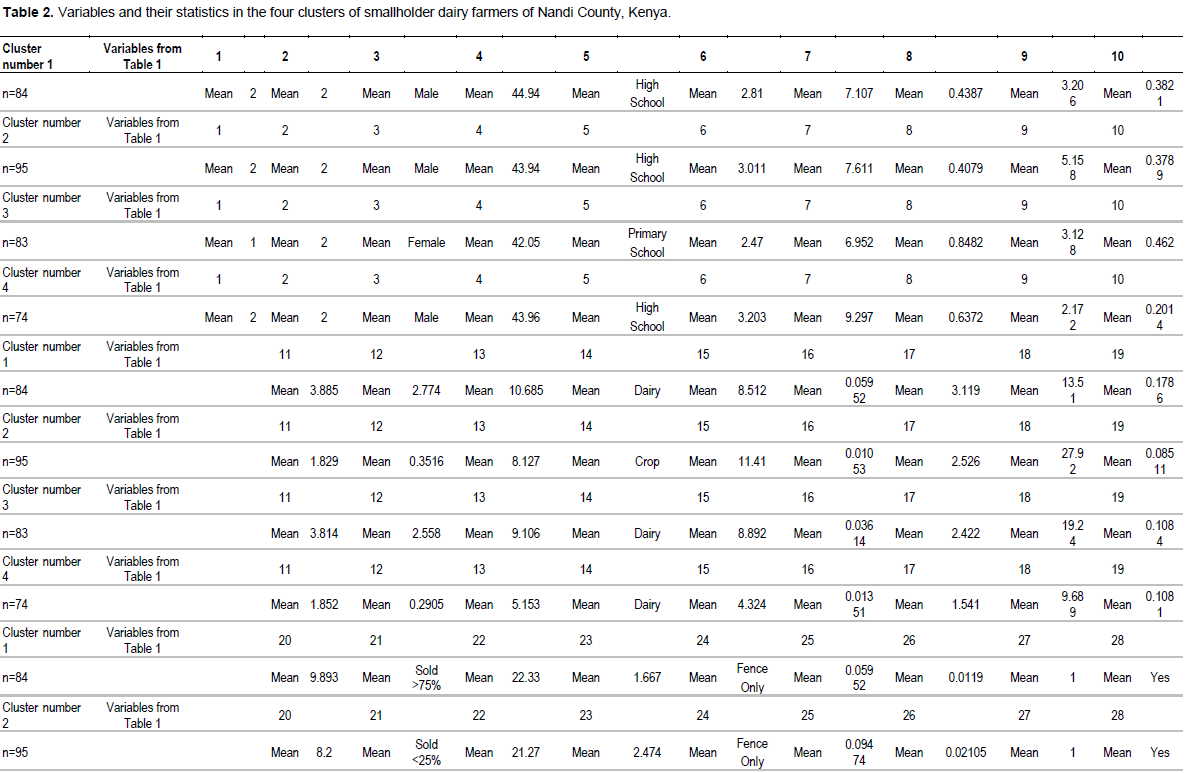
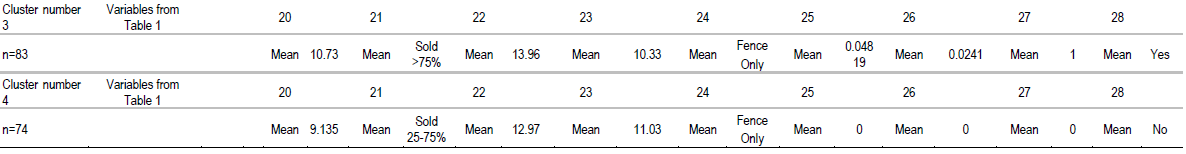
These clusters when using discrete variables showed focus areas such as the low education level of farmers and they were majorly male dominated. These clusters had total low acreage, as well as areas available for grazing, the farmers had less labour and high dairy livestock numbers. This finding agrees with Chibanda et al. (2009), Tittonell et al. (2010) and van Averbeke and Mohamed (2006) whose studies found that cluster analysis gave the key variables of note to define the components for practice change. There has been studies showing how farmer education can improve various farm practices and subsequently make climate change adaptation (Ausden, 2014; Boswell et al., 2010; Waithaka et al., 2007; Zake et al., 2010). The basic aim of cluster analysis is to find the “natural groupings”, if any, of a set of individuals (cases or variables). This was an objective of this study and also agreed with other studies where the advantages of using cluster analysis were extolled (Adeyemo et al., 2019; Chibanda et al., 2009; Kwale, 2013). This study found that after running the analysis, the variables main income category, labour numbers, dairy livestock populations and grazing area acreage were key driving forces for the smallholder farmers. This leads to four clusters based on gender and education levels with differences occurring on the quantities for the other variables. Thus, this study’s four clusters were the natural groupings of the smallholder dairy farmers.
CONCLUSION AND RECOMMENDATION
There are many ways to use cluster analysis. The kind of cluster analysis utilised in this study is how to form similar sets of variables. The purpose of this analysis in this study is, therefore, to draw inferences about natural groupings of smallholder dairy farmers and the nature of the key variables used in these groupings. Hierarchical clustering was appropriate for and could also be applied to qualitative variables (Kwale, 2013; Nyambo et al., 2019). The major result of this study was that with as many as 28 variables the cluster analysis revealed only four distinct natural groupings. In this study, cluster analysis is used to test the proposition that there are simple natural groupings of smallholder dairy farmers and they are mirrors with realisation that the analysis yielded distinct groupings (Chibanda et al., 2009; Condliffe et al., 2008). The study recommends there should be future research to give a detailed characterisation of other areas and types of farmers using cluster analysis to compare the counties and also scenarios if scaled to the region.
CONFLICT OF INTERESTS
The authors have not declared any conflict of interests.
REFERENCES
|
Adeyemo T, Amaza P, Okoruwa V, Akinyosoye V, Salman K, Abass A (2019). Determinants of intensity of biomass utilization: Evidence from cassava smallholders in Nigeria. Sustainability (Switzerland) 11:9. |
|
|
Altieri M, Koohafkan P (2008). Enduring Farms: Climate Change, Smallholders and Traditional Farming Communites. In Third World Network Penang, Malaysia. |
|
|
Auburger S, Wustholz R, Petig E, Bahrs E (2015). Biogas digestate and its economic impact on farms and biogas plants according to the upper limit for nitrogen spreading-The case of nutrient-burdened areas in north-west Germany. AIMS Energy 3(4):740-759. |
|
|
Ausden M (2014). Climate Change Adaptation: Putting Principles into Practice. Environmental Management 54(4):685-698. |
|
|
Bationo A, Nandwa SM, Kimetu JM, Kinyangi JM, Bado BV (2004). Sustainable intensification of crop - livestock systems through manure management in eastern and western Africa : Lessons learned and emerging research opportunities Africa, pp. 173-198. |
|
|
Bebe BO, Udo HMJ, Rowlands GJ, Thorpe W (2003). Smallholder dairy systems in the Kenya highlands: Cattle population dynamics under increasing intensification. Livestock Production Science 82(2-3):211-221. |
|
|
Bebe BO, Udo HMJ, Thorpe W (2002). Development of smallholder dairy systems in the Kenya highlands. Outlook on Agriculture 31(2):113-120. |
|
|
Bellarby J, Stirling C, Vetter SH, Kassie M, Kanampiu F, Sonder K, Smith P, Hillier J (2014). Identifying secure and low carbon food production practices: A case study in Kenya and Ethiopia. Agriculture, Ecosystems and Environment 197:137-146. |
|
|
Boswell MR, Greve AI, Seale TL (2010). An Assessment of the Link Between Greenhouse Gas Emissions Inventories and Climate Action Plans. Journal of the American Planning Association 76(4):451-462. |
|
|
Brandt P, Hamunyela E, Herold M, de Bruin S, Verbesselt J, Rufino MC (2018). Sustainable intensification of dairy production can reduce forest disturbance in Kenyan montane forests. Agriculture, Ecosystems and Environment 265:307-319. |
|
|
Castellanos-Navarrete A, Tittonell P, Rufino MC, Giller KE (2015). Feeding, crop residue and manure management for integrated soil fertility management - A case study from Kenya. Agricultural Systems 134:24-35. |
|
|
Chibanda M, Ortmann GF, Lyne MC (2009). Institutional and governance factors influencing the performance of selected smallholder agricultural cooperatives in KwaZulu-Natal. Agrekon 48(3):293-315. |
|
|
Condliffe K, Love C, Porter M (2008). Kenya Coffee : A Cluster Analysis. Harvard Business School Microeconomics of Competitiveness P. 2. |
|
|
GOK (2015). Nandi County Development Profile. Government of Kenya. |
|
|
Hammond J, Fraval S, van Etten J, Suchini JG, Mercado L, Pagella T, Frelat R, Lannerstad M, Douxchamps S, Teufel N, Valbuena D, van Wijk MT (2015). The rural household multi-indicator survey (RHoMIS) for rapid characterisation of households to inform climate smart agriculture interventions: Description and applications in East Africa and Central America. Agricultural Systems, May. |
|
|
Herrero M, González-Estrada E, Thornton PK, Quirós C, Waithaka MM, Ruiz R, Hoogenboom G (2007). IMPACT: Generic household-level databases and diagnostics tools for integrated crop-livestock systems analysis. Agricultural Systems 92(1-3):240-265. |
|
|
Herrero M, Thornton PK, Bernués A, Baltenweck I, Vervoort J, van de Steeg J, Makokha S, van Wijk MT, Karanja S, Rufino MC, Staal SJ (2014). Exploring future changes in smallholder farming systems by linking socio-economic scenarios with regional and household models. Global Environmental Change 24(1):165-182. |
|
|
IPCC (2006). Guidelines for national greenhouse gas inventories. Chapter 10: Emissions from livestock and manure management. |
|
|
Kingrani SK, Levene M, Zhang D (2017). Estimating the number of clusters using diversity. Artificial Intelligence Research 7(1):15. |
|
|
Koohafkan P, Altieri MA, Holt Gimenez E (2012). Green Agriculture: Foundations for biodiverse, resilient and productive agricultural systems. International Journal of Agricultural Sustainability 10(1):61-75. |
|
|
Kwale FM (2013). A Critical Review of K Means Text Clustering Algorithms. International Journal of Advanced Research in Computer Science 04(09):27-34. |
|
|
Livingston G, Schonberger S, Delaney S (2011). Sub-Saharan Africa: The state of smallholders in agriculture. IFAD: International Fund for Agricultural Development: Conference on New Directions for Smallholder Agriculture, pp. 1-36. |
|
|
Mudavadi PO, Otieno K, Wanambacha JW, Odenya JO (2001). Smallholder dairy production and marketing in western Kenya: A review of literature. |
|
|
Nyambo DG, Luhanga ET, Yonah ZO, Mujibi FDN (2019). Application of Multiple Unsupervised Models to Validate Clusters Robustness in Characterizing Smallholder Dairy Farmers. Scientific World Journal, 2019. |
|
|
Oborn I, Vanlauwe B, Phillips M, Thomas R, Brooijmans W, Atta-Krah K (2017). Sustainable Intensification in Smallholder Agriculture. |
|
|
ODK (2017). Open Data Kit. |
|
|
Republic of Kenya (2016). The Forest Conservation and Mangement Act. Kenya Gazette Supplement. |
|
|
Rufino MC, Tittonell P, van Wijk MT, Castellanos-Navarrete A, Delve RJ, de Ridder N, Giller KE (2007). Manure as a key resource within smallholder farming systems: Analysing farm-scale nutrient cycling efficiencies with the NUANCES framework. Livestock Science 112(3):273-287. |
|
|
Rufino MC, Quiros C, Boureima M, Desta S, Douxchamps S, Herrero M, Kiplimo J, Lamissa D, Mango J, Moussa AS, Naab J, Ndour Y, Sayula G, Silvestri S, Singh D, Teufel N, Wanyama I (2013). Developing generic tools for characterizing agricultural systems for climate and global change studies (IMPACTlite - phase 2) (Issue January). |
|
|
Salami A, Kamara AB, Brixiova Z (2010). Smallholder Agriculture in East Africa: Trends, Constraints and Opportunities. In Working Paper No.105 African Development Bank (Issue April). |
|
|
Staal SJ, Baltenweck I, Waithaka MM, DeWolff T, Njoroge L (2002). Location and uptake: Integrated household and GIS analysis of technology adoption and land use, with application to smallholder dairy farms in Kenya. Agricultural Economics 27(3):295-315. |
|
|
Syakur MA, Khotimah BK, Rochman EMS, Satoto BD (2018). Integration K-Means Clustering Method and Elbow Method for Identification of the Best Customer Profile Cluster. IOP Conference Series: Materials Science and Engineering 336:1. |
|
|
Tellaroli P, Bazzi M, Donato M, Brazzale AR, Drăghici S (2016). Cross-Clustering: A Partial Clustering Algorithm with Automatic Estimation of the Number of Clusters. PloS One 11(3):e0152333. |
|
|
Thompson D (2016). Restoring Fire to Grasslands: An Overview in Fire Management and Restoration in Rangelands. Proceedings of the 10th International Rangeland Congress, July, pp. 454-455. |
|
|
Tittonell P, Muriuki A, Shepherd KD, Mugendi D, Kaizzi KC, Okeyo J, Verchot L, Coe R, Vanlauwe B (2010). The diversity of rural livelihoods and their influence on soil fertility in agricultural systems of East Africa - A typology of smallholder farms. Agricultural Systems 103(2):83-97. |
|
|
van Averbeke W, Mohamed SS (2006). Smallholder farming styles and development policy in South Africa: The case of Dzindi Irrigation Scheme. Agrekon 45(2):136-157. |
|
|
Vrieling A, Beurs KM, Brown ME (2011). Variability of African farming systems from phenological analysis of NDVI time series. Climatic Change 109(3):455-477. |
|
|
Waithaka MM, Thornton PK, Shepherd KD, Ndiwa NN (2007). Factors affecting the use of fertilizers and manure by smallholders: The case of Vihiga, western Kenya. Nutrient Cycling in Agroecosystems 78(3):211-224. |
|
|
Zake J, Tenywa JS, Kabi F (2010). Improvement of manure management for crop production in Central Uganda. Journal of Sustainable Agriculture 34(6):595-617. |
|
Copyright © 2024 Author(s) retain the copyright of this article.
This article is published under the terms of the Creative Commons Attribution License 4.0


