Elephant grass is a plant of tropical origin with high biomass-production potential that stands out today as an alternative energy source. The potential of its genotypes depends on the genotype × environment interaction. The objective of this study was to estimate the genotype × environment interaction and compare stability methods in elephant grass for biomass production in a biannual cutting regime. The experiment was conducted in a randomized block design with two replicates and evaluations of 73 elephant-grass genotypes in six cuts. The trait dry matter yield was utilized for the analysis of the genotype × environment interaction and the stability. The stability analysis methods employed were those of Yates and Cochran, Plaisted and Peterson, Wricke, Annicchiarico, Lin and Binns, and Huehn. Kang and Phan’s ranking was adopted for all the methods. Spearman’s coefficient was utilized to evaluate the degree of agreement between the different methods employed. Significant differences were observed for the genotype × environment interaction. Non-parametric Lin and Binns’ and Annicchiarico’s methods were more discriminating than the analysis of variance methods in the evaluation of stability and productivity of the tested genotypes.
In the last decades, energy demand has become a global problem, and the search for alternative energy sources is ever increasing (Rossi et al., 2014). Because the biomass combustion recycles the CO2 taken from the atmosphere by photosynthesis, in the long term, it will be one of the energy alternatives to overcome the environmental crisis and the dependence on oil faced by the world today (Morais et al., 2009).
Elephant-grass species has desirable qualitative traits with regard to its percentage of fiber, this fiber’s components (cellulose, hemicellulose, and lignin) and the carbon-to-nitrogen (C:N) ratio of these materials, because the higher this ratio is, the better the plant is for combustion. These features validate it as an alternative energy source (Morais et al., 2009). The breeding of elephant grass has always aimed at forage qualities, high protein contents, and low fiber levels, which requires a change in the selection of genotypes of this species for use as a source of bioenergy (Flores et al., 2013).
The genotype × environment interaction (G × E) is one of the greatest challenges faced by breeders of any species. Among the alternatives to optimize it, in the phase of selection or recommendation of cultivars, is the choice of varieties with high adaptability and good stability (Cruz et al., 2012). Therefore, different methodologies should be applied for safer genotype recommendations (Peluzio et al., 2010).
Several methods, based on different principles, have been described to evaluate the G × E interaction and to determine the phenotypic stability of cultivars. Among the most commonly used methods are those based on analysis of variance, the non-parametric, and the regression-based ones. In those based on analysis of variance, the stability estimates are expressed in quadratic components, whereas those based on non-parametric statistics evaluate the performance of each genotype in relation to the maximum response of each environment. Lastly, in the regression-based methods, the dependent variable is expressed as a function of an environmental index that measures the quality of the evaluated environments (Cruz et al., 2014).
This study aimed to estimate the genotype × environment interaction (biannual cuts) and compare stability methods based on analysis of variance and non-parametric methods in elephant grass for biomass production in a biannual cutting regime.
Location and characterization of the experimental area
This experiment was conducted in an area belonging to the partnership between Centro Estadual de Pesquisas em Agroenergia and Aproveitamento de Resíduos, from PESAGRO-Rio, in Campos dos Goytacazes-RJ, Brazil, and the State University of Norte Fluminense “Darcy Ribeiro” (UENF), located at 21°19’23’’ S and 41°19’40’’ W, at an altitude varying from 20 to 30 m. The climate of the region is classified as a hot wet tropical, Aw Köppen type, with annual precipitation around 1,152 mm (Köppen, 1948). The soil is classified as a Yellow Latosol, and the analysis showed the following characteristics: pH 5.5; phosphorus (mg dm–3) 18; potassium (mg dm–3) 83; Ca (cmolc dm–3) 4.6; Mg (cmolc dm–3) 3.0; Al (cmolc dm–3) 0.1; H + Al (cmolc dm–3) 4.5; and C (%) 1.6.
Design and genotypes evaluated
The experimental design was organized as randomized blocks with two replicates. The plot was formed by one 5.5 m row spaced 2 m apart, totaling 11 m2. Each replicate contained 73 elephant-grass genotypes from the Active Germplasm Bank (AGB) of UENF (Table 1). Planting was on February 23 and 24, 2011, using whole stems arranged with the base touching the apex of the other plant, distributed into the furrows at the rate of two per furrow. After the establishment phase, on December 15, 2011, all treatments were cut near the soil level (plot-leveling) and another planting was made concomitantly to reduce flaws in the planting rows. The environments consisted of six cuts that were made in June 2012, December 2012, August 2013, February 2014, August 2014, and February 2015. The evaluated characteristic was dry matter yield (DMY) per cut, in t.ha–1. Shortly after, two tillers were collected and placed in a 5 kg paper bag to be dried in an oven at 65°C for 72 h, until they reached constant weight (air-dried sample). The dried material (leaf and stem) was ground in a Wiley mill with 1-mm sieve and conditioned in a plastic bottle. Next, the samples were dried again in an oven at 105°C for 12 h (oven-dried sample).
During fertilization at planting, each row received 60 g of single superphosphate, and 50 days after planting, each row was top-dressed with 70 g urea and 40 g potassium chloride (KCl), corresponding to 28.6 kg nitrogen (N) and 24 kg potassium oxide (K2O) per hectare. This topdressing was also performed after each one of the evaluation cuts. The fertilization practices adopted were based on the results of the soil chemical analyses and recommendations for culture in Rio de Janeiro State.
Statistical analyses
The computer resources of the GENES program version 1.0 were used for the genetic-statistical analysis (Cruz, 2013). The analysis of variance for the evaluated trait was conducted based on the average of the plots considering all effects random (random model), employing the following statistical model:
Stability methodologies
The stability methods adopted were based on analysis of variance and non-parametric.
Yates and Cochran’s (traditional) method (1938)
The method consists of the combined analysis of the experiments, considering all environments and the subsequent breakdown of the sum of squares of the environment effects and of the genotype × environment interaction into effects of environments within each genotype. The genotypes that show the lowest θi values are the most stable. Its estimator is:
Huehn’s (1990) method
Huehn (1990) suggested the non-parametric evaluation of phenotypic stability based on the classification of genotypes in each environment, utilizing the principle of homeostasis to characterize the genotype. In this method, a genotype is considered stable if the classification presented by the genotype × environment interaction effect is similar. In this case, the parameters that measure the stability (S1, S2, and S3) are equal to zero.
The satiability parameters were estimated from:
By this method, the genotype with maximum stability will express S1, S2, and S3 estimates equal to zero.
Kang and Phan’s method
The genotypes were ranked based on the estimators of Yates and Cochran (1938) and Plaisted and Peterson (1959); Wricke’s (1964) ecovalence; Annicchiarico (1992); Lin and Binns (1988); and Huehn (1990).
For the ranking of the genotypes, they were classified in ascending order based on the aforementioned stability estimators, except for Annicchiarico’s method, in which the clones were ranked in descending order, and subsequently descending order, based on the estimates of the dry-matter-yield means. The ranking values of each genotype were summed, generating the sum of classifications, which constituted Kang and Phan’s (1991) estimator.
Thus, the genotypes with the lowest values in the sum of classifications are the most stable and productive.
Spearman’s correlation coefficient
The results of the individual analyses of variance detected significant differences at 1 and 5% probability between the genotypes in all the evaluated cuts for dry matter yield. These different performances between the elephant-grass genotypes indicate that there is genetic variability in the Active Germplasm Bank of elephant grass of UENF (Table 2). In the study conducted by Oliveira et al. (2014), Pennisetum purpureum genotypes at 12 months of age showed significant differences at 1% probability for dry matter yield. Menezes et al. (2014) also found significant differences in dry matter yield in 40 genotypes of P. purpureum.
The experimental coefficients of variation ranged from 24.98 to 36.53%, because dry matter yield is a quantitative trait largely influenced by the environment. In other studies with elephant grass (Oliveira et al., 2014; Rossi et al., 2014), the coefficients of variation were high for dry matter yield: 22.96 to 36.95%.
The coefficient of variation, obtained from the analysis of variance of an experimental trial, indicates its degree of precision. However, the particularities of the studied culture should be considered, and one should epecially distinguish the nature of the evaluated trait (Costa et al., 2002). This classification may vary depending on the soil-climatic conditions or reproductive cycle of the culture (Scapim et al., 2010).
The values obtained in the individual analyses of variance (per cut) of dry matter yield in t.ha–1 resulted in a ratio between the highest and lowest residual mean squares (RMS) of 5.91 (Table 2). This ratio is in agreement with Daher et al. (2003), who evaluated P. penissetum in eight environments whose ratio of homogeneity of variances (Hartley’s test) was 4.94, which allowed the inclusion of all environments in the combined analysis.
Pimentel-Gomes and Garcia (2002) commented on the use of the maximum F test, concluding that if the ratio between the highest and the lowest RMS is lower than seven, the combined analysis can be performed with no major problems. However, when this ratio is greater than seven, it is recommended to consider the subgroups of the experiments with not-very-heterogeneous RMS separately.
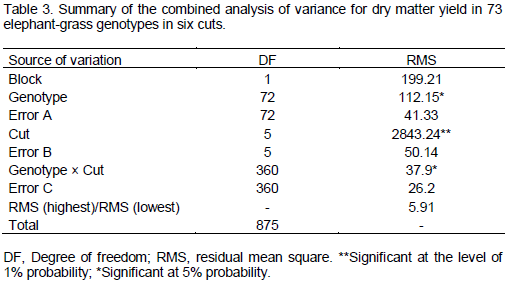
The combined analysis of variance demonstrated significant effects of cuts (p<0.01), genotypes (p<0.05), and cut × genotype interaction (p<0.05) on dry matter yield, indicating that the genotypes had different performances in the biannual cuts evaluated (Table 3). The significant effect of the genotype × environment interaction indicates inconsistent performance of the genotypes according to the environmental variables. The evaluation of this interaction is essential for plant breeding, because the best genotype in a certain environment may not have the same response in another, so it would be necessary to evaluate the stability of the genotypes.
The genotype × environment interaction is unfavorable to researchers’ work because of the magnitudes of differences between the genotypes and cuts, and so the classification of the genotypes is changed with the cuts (Daher et al., 2003). Thus, a more detailed study of the performance of genotypes in view of these variations was undertaken by stability analysis.
The stability parameter of Yates and Cochran’s method is shown in Table 4. This methodology indicated genotypes 8, 14, 70, 15, 45, 58, 43, 17, 30, and 62 as the 10 most stable genotypes of the evaluated group. On the other hand, the corresponding classifications of these genotypes concerning the mean in the six evaluation cuts were not satisfactory (70th, 34th, 41st, 62nd, 20th, 59th, 71st, 17th, 57th, and 47th), corroborating Cruz et al. (2014) assumption that genotypes with a consistent response in a number of environments are, in general, not very productive.
The evaluation of genotype performance stability by Plaisted and Peterson (1959) method (based on analysis of variance) demonstrated that, because they showed lower values for the estimate of θ (%), the 10 most stable genotypes were 63, 41, 6, 2, 21, 49, 33, 30, 57 and 7 in ascending order of magnitude.
According to this method, in general, there was no agreement between stability and productivity, that is, the most productive genotypes were not necessarily the most stable. Daher et al. (2003), who evaluated 17 clones of elephant grass for forage production, stated that the stability estimates of Plaisted and Peterson also proved that there was no agreement between stability and productivity; in other words, the most productive genotypes were not necessarily the most stable ones.
Wricke’s method considers the genotype with the lowest estimate of ωi (%) as the most stable, similarly to Plaisted and Peterson. The conclusions were identical for both stability methods.
The results of the stability analysis obtained by Annicchiarico’s (1992) method indicated genotypes 47, 31, 11, 7, 61, 44, 3, 42, 65, and 32 as superior, with confidence indices higher than 100% when all environments were considered, which shows that they have good stability, with a predictable response in different cuts.
The methodology of Annicchiarico (1992) expresses the genotypic stability, facilitating the decision-making process (Cruz et al., 2014). Considering the dynamics and recurrence of the processes in breeding programs, it is a methodology that can be applied in the moment of determining the permanence or removal of a certain genotype from the program, safely and quickly.
The application of Lin and Binns’ (1988) method made it possible to identify individuals with high dry matter yield and phenotypic stability (lower Pi values). Table 4 shows that genotype 47 is the most adaptable and stable, with the lowest Pi value in the six cuts, followed by genotypes 31, 11, 44, 65, 32, 54, 7, 46, and 45, with respective increases in dry matter yield. These results agree with Daher et al. (2003), who found an inverse relationship between the stability parameter Pi and the clones’ dry-matter-yield means, indicating the applicability of these stability estimates for the evaluation of perennial-cycle genotypes subjected to successive cuts.
The ability of this parameter to detect the genotypic behavior of clones is based on the use of deviations between the evaluated genotype and the maximum productivity in each environment. Thus, low Pi values for a given genotype demonstrate that it was near the maximum in the cuts made (Daher et al., 2003).
The results obtained for the stability parameters, according to Huehn’s (1990) methodology, for dry matter yield, are shown in Table 4. According to the results, genotype 61 was considered the most stable of all, with the lowest estimate of parameters S1, S2, and S3, and good classification of the mean in all cuts.
Genotypes 63, 17, 51, 32, and 5 also obtained good parameter estimates for dry matter yield, in which genotype 63 was the second most stable, according to S1 and S2. By this methodology, the genotypes that showed the lowest variance in the ranks are considered the most stable.
The results referring to the ranking method, according to the performance of the genotypes and their respective estimates of the phenotypic-stability parameters, are shown in Table 5.
The stability parameter of Yates and Cochran’s method indicated genotypes 8, 14, 70, 15, 45, 58, 43, 17, 30, and 62 (Table 4) as the most stable and with unsatisfactory means. With Kang and Phan’s ranking associated with Yates and Cochran’s method (Table 5), these genotypes were better ranked with their means as 35th, 4th, 10th, 25th, 2nd, 24th, 43rd, 1st, 26th, and 16th, respectively. In general, it can be observed that the most stable clones started to occupy the means positions after Kang and Phan’s weighting.
The 10 best genotypes resulting from the methodology of Kang and Phan (1991) associated with the methods of Plaisted and Peterson (1959) and Wricke (1964) were 7, 31, 36, 32, 3, 44, 42, 49, 55, and 11. Among them, genotypes 31, 11, 7, 44, and 42 stood out as the most productive. The results for the methods are equal, because they are perfectly correlated with each other.
For Annicchiarico’s method, the clones with the highest confidence indices were those of the greatest stability. This method, associated with that of Kang and Phan (1991), did not show alterations in the ranking of genotypes. Therefore, groups 47, 31, 11, 61, 7, 44, 3, 54, and 45 prevailed as the most productive and stable. Thus, both methodologies displayed good agreement in identifying the cultivars of greater stability and dry matter yield.
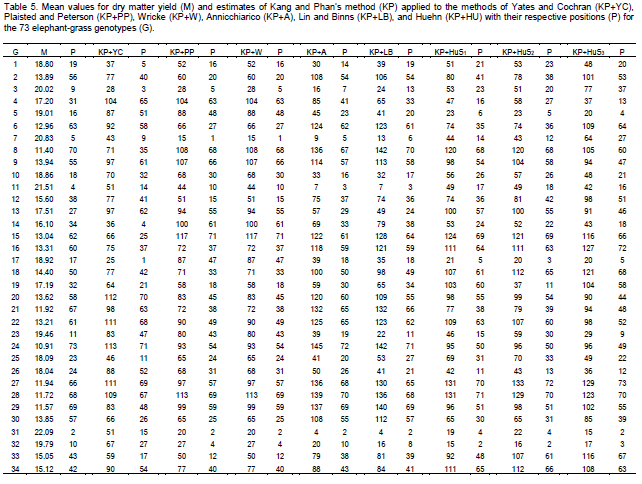
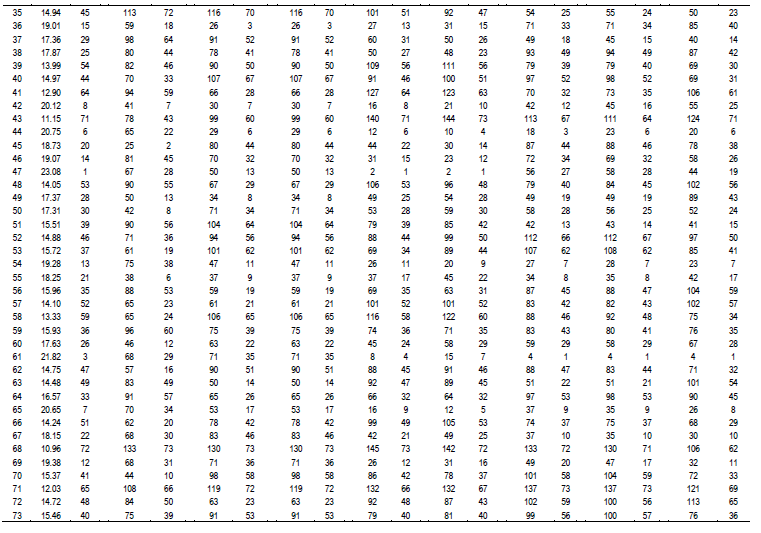
Genotypes 47, 31, 11, 44, 65, 32, 54, 7, 46, and 45 stood out as very promising according to Lin and Binns’ method. Nevertheless, the association between Kang and Phan’s and Lin and Binns’ methods led to a slight change in the ranking of 47, 31, 44, 65, 7, 61, 32, 54, and 42, keeping the same positions with high stability and dry matter yield (Table 5). These results indicate that these genotypes showed high stability, and most importantly for elephant-grass breeders, high dry matter yield. Therefore, the non-parametric Annicchiarico’s and Lin and Binns’s methods, associated with Kang and Phan’s method, were efficient in indentifying genotypes with high stability and dry matter yield.
Kang and Phan’s (1991) approach, associated with Huehn’s method, kept genotypes 61, 31, 32, 17, 44, and 54 in the best positions for stability. Despite the simplicity in obtaining the statistics that evaluated stability, Huehn’s (1990) method is criticized for not taking into account the magnitude of the obtained mean values, which is another aspect that stability comprehends, regardless of whether the classification was good or bad. Thus, the statistics will only be useful if the mean performance of the evaluated genotypes is considered simultaneously (Cruz et al., 2014).
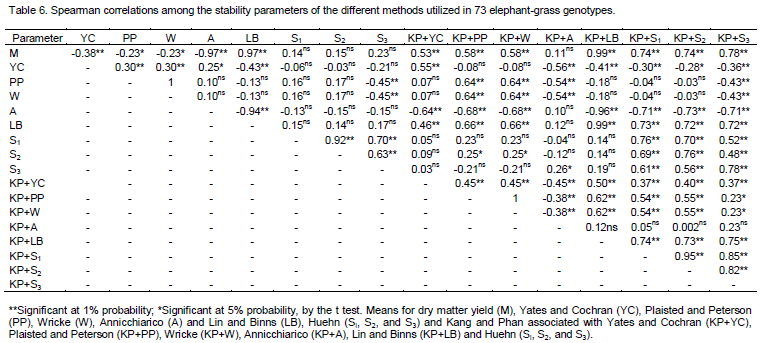
The correlations between the different stability methods for the trait dry matter yield, according to Spearman’s correlation coefficient (r), revealed statistical significance at 5 and 1% of probability by the t test, indicating that these methods agree partially (Table 6).
The mean was highly correlated with Lin and Binns’ and Annicchiarico’s methods, positively and negatively, respectively. Regarding Kang and Phan’s (1991) associated method, there was a change in the ranking of Yates and Cochran (1938), in which Plaisted and Peterson (1959), Wricke (1964) and Huehn became positively correlated, but with a low coefficient.
The methods that were highly correlated with each other were Plaisted and Peterson and Wricke (r = 1), and Kang and Phan associated with the latter. Daher et al. (2003) also obtained the same result for dry matter yield in studies on the stability of elephant grass.
Kang and Phan’s method associated with Lin and Binns’ had high negative and positive correlations, respectively, with Annicchiarico’s (r = –0.96) and Lin and Binns’ methods (r = 0.99). The results of the methodology of Lin and Binns and Annicchiarico were similar, which is in agreement with the results obtained by Cunha (2012) regarding the similarity in the recommendation of the genotypes by these methodologies.
Also in the comparison of the estimates of the algorithms of the non-parametric methods, it is observed that Huehn’s (1990) parameters S1, S2, and S3 have a high agreement (P < 0.01) with each other, and associated with Kang and Phan’s (1991). Additionally, S1 and S2 (r = 0.92) and Kang and Phan’s associated with S1 and S2 (r = 0.95) showed a noteworthy high correlation. Scapim et al. (2010) investigated the correlations between stability parameters of some methods such as those of Huehn (1990) and Kang (1988), aiming to identify the most reliable method to select popcorn cultivars. According to these authors, S1, S2, and S3 were correlated positively and significantly, indicating that only one of these statistics is sufficient for the selection of stable genotypes.


