Full Length Research Paper
ABSTRACT
Proper handling of the wheat crop is crucial to obtain the full expression of the genotype potential. Among the various management techniques, the spatial distribution of plants and the disposal of the same plant in agriculture deserve attention. It is known that the distribution may alter the productivity; however, it is uncertain, the technological changes it might entails. With this in view, the aim of this study was to evaluate in two wheat cultivars, characteristics of agronomic interest and the technological quality of flour depending on the spacing. The experimental design was a randomized block with four replications in a factorial 4 × 2. The first factor refers to the spacing: 20, 28, 36 and 40 cm and the second factor refers to the cultivars:CD 150 and BRS Tarumã. The experiment was carried out in Santa Tereza do Oeste, western region of Parana state, in May 2011. The yield and grain moisture were reduced with increased spacing of 3.98 and 26.18%. The hectolitre weight, thousand grain weight, the moisture of the flour, ash content dry basis, the falling number, and flour color were not affected by increasing spacing. Cultivar CD 150 presented lighter color, higher weight hectolitre, lower ash content and fewer drop from the BRS Tarumã.
Key words: BRS Tarumã, CD 150, Triticum aestivum.
INTRODUCTION
The price paid to the farmer for wheat produced is directly linked to the technological qualities it has. Thus, to plant a crop expecting to get good productivity and quality, it is necessary to evaluate and determine which soil conditions will be most suitable; what the climatic condition of the region is; which is the most suitable cultivar; what cultural practices will be adopted; the number of plants per unit area as well as the spacing between lines; and finally, the collection and evaluation of flour quality. These assumptions which lead to productive crops are also crucial in influencing the nutritional and technological characteristics of wheat flour. The technological quality of flour after the grain has been grinded directly influences the quality of the final food product which it is used for. There is therefore an increase in quality demand by customers from the mills (Zardo, 2010).
According to Fontoura (2005), after choosing the best genotype for the desired purpose, proper crop management is crucial for the genotype to reach its full potential. Among the various management techniques, the spatial distribution of plants and their arrangement deserve special attention. When creating a microclimate with certain characteristics, such conditions can affect productivity, either by encouraging direct competition between plants, or by indirectly favoring or disfavoring the development of disease-causing pathogens. However, there are no reports linking the spatial distribution of plants and the technological quality of flour. The objective of this study was to evaluate the characteristics of agronomic interest and the technological quality of flour of two wheat cultivars based on the spacing.
MATERIALS AND METHODS
The experiment was conducted under field conditions during the growing season of 2011, in Santa Tereza do Oeste, western region of Parana state, Brasil (25°03'08"S, 53°37'59"W and 749 m asl). The soil of the experimental area is classified as eutrophic red latosol (EMBRAPA, 2006) and the climate is Cfa according to Köppen classification.
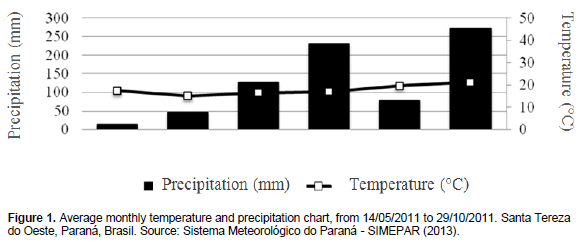
The experiment was conducted in a managed area of ​​tillage on corn stover. The area soil from from 0.0 to 20.0 cm presented the following: pH (CaCl2): 5.8; C: 34.0 g dm-3; P (Mehlich 1): 10.3 mg dm-3; H + Al: 3.97 cmolc dm-3; K +: 0.22 cmolc dm-3; Ca2 +: 5.4 cmolc dm-3; Mg 2+: 4.0 cmolc dm-3; CTC (pH 7.0): 13.59 cmolc dm-3; base saturation (V%): 70.8%. Climate rainfall data and monthly average temperature during the growing season, were obtained from the meteorological station of Simepar (Figure 1).
The experimental design was a randomized block design with four replications in a factorial 4 x 2 design. The first factor refers to the spacing: 20, 28, 36 and 45 cm while the second factors were cultivars CD 150 and BRS Tarumã. Each plot had 4 x 2.5 meters totaling 10 m2. The plots were composed of different numbers of rows; 20, 14, 11 and 9 in accordance with the spacing described above. However, the length was the same for all plots (2.5 m) and plant density per meter remained between 75 and 80 plants per meter. For the evaluations, useful areas of ​​each plot were used, neglecting two extreme lines of the portion and 50 cm from each end portion, the useful area of ​​each experimental plot varied according to the line spacing adopted: 8 9, 7.9, 7.6 and 7.2 m2 respectively to the line spacing described above).
The NPK fertilizer was applied during seeding and this was done based on the result of soil analysis. This followed the techniques established by the Brazilian Commission indications of Wheat Research and Triticale for the state of Paraná, 2011. The fertilizer was applied in the following distribution: 300 kg ha-1 of 08-20-20 formula, corresponding to 24 kg ha-1 N, 60 kg ha-1 of P2O5 and 60 kg ha-1 K2O.
The cultivars BRS Tarumã and CD 150 were used. To carry out seeding, the seeds were treated with imidacloprid insecticide and fungicide triadimenol at doses 0.13 and 0.27 L per 100 kg seed respectively. Sowing was carried out on 14/05/2011, with 85 seeds per meter in order to obtain the density of approximately 75 to 80 plants per meter. There was no soil preparation, because the area had been used in direct seeding system for 8 years in succession cultures planting corn in summer and oatmeal in the winter. Desiccation of the experimental area was performed 15 days before sowing with the use of glyphosate at a dose of 480 g a.i. L-1. The seedling in both cultivars emereged six days after sowing. Nitrogen fertilization was performed at the beginning of tillering which was 35 days after emergence (DAE). It was used as top dressing, and urea broadcasting was done with doses of 30 kg N ha-1.
Harvest was done on 17/09/2011 and 29/10/2011. By this time, the plants were at the point of harvest. The CD 150 cultivars were harvested on 122 days after seedling emergence while the BRS Tarumã was harvested on 162 days after seedling emergence. The agronomic characteristics evaluated were: grain yield (PRO), thousand grain weight (MMG), grain number spike-1 (NGE), spike number m-2 (NEM) and plant height (Al). The grain weight test (PH) was measured for quality. For the quality of the meal, the following factors were considered: (NQ), color (L *, a * and b *), ash on a dry basis (CIN), flour moisture (UF) and grain moisture (UG).
The harvested wheats were measured in order to determine the weight (PRO) kg ha-1. At the same time, the plant’s height was evaluated at three random points per plot. The plant was measured from the ground to the stalk apex including the awn. The number of grains per spike-1 (NGE) was determined with an average of 10 randomly sampled spikes per plot. The number of spike m-2 (NS) was determined by a frame with an area of 1 m2 released at random in the useful area of each plot.
After the threshing quality parameter tests were performed, the hectoliter weight (pH) was determined with scale marks Dalle Molle®, corrected to 13%, according to manufacturer's methodology. The thousand grain weight (MMG) was determined by the Seed Analysis Rules (Brazil, 2011).
Wheat conditioning (pre-grinding humidification) was performed according to the 26-10A - AACC (2000) method and wheat flour was obtained by grinding the grain mill pilot aid mark Chopin. The color was determined using the method 14-22 - AACC (2000). The grain moisture (UG) and flour (UF) were determined by the method. 44-15A - AACC (2000). The ash content of dry basis (CIN) was measured using the method. 08-01 - AACC (1995). The falling number (NQ) was performed using the method. 56-81B - AACC (2000). The data were subjected to variance analysis by applying the F test at 5% probability.
RESULTS AND DISCUSSION
No significant differences were observed between treatments with respect to spacings (productivity), cultivars (plant height, grain number spike -1, thousand grain weight and productivity) and interaction between spacing x cultivar (number of spikes per m-2). The summary of the analysis of variance is shown in Table 1.
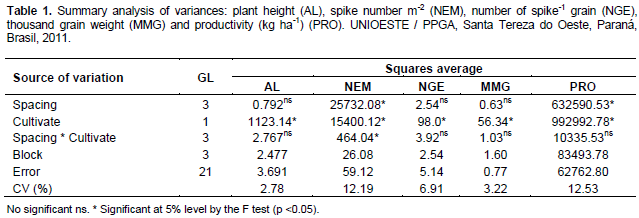
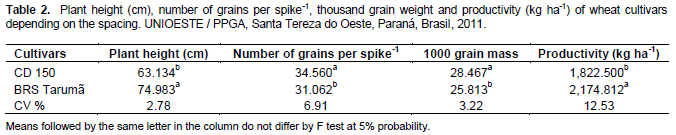
The plant height, leaf number, the thousand grain weight and productivity can vary in magnitude depending on the development conditions. When the plant grows in low density, generally it becomes greater than a similar plant at high density, and often has a different morphology. Despite that the wheat plant showed high phenotypic capacity, there was no interaction between spacings of x cultvars and plant height. However, there were significant differences among cultivars (Table 1), and BRS Tarumã showed greater height (74.98 cm) when compared to the cultivar CD 150 that had an average height (63.13 cm), (Table 2). Sources et al. (2000) confirms the results of the spacing, however, the height differs with increase in density in the plantation line.
The number of m-2 cultivars of wheat was influenced by the interaction spacing of x cultivar. For BRS Tarumã there was a linear decrease of the spike number m-2 in relation to the spacing (Figure 2). The highest average m-2 for this cultivar of wheat was obtained at 421.75 spacing of 20 cm, while the lowest average (299, 50) was obtained at a spacing of 45 cm. For the cultivar CD 150, the curve that best fit the points was the quadratic polynomial. According to the data presented in Figure 2, it is observed that for the cultivar CD 150, the largest number of spikes m-2 (382.25) was obtained at a spacing of 20cm while the smallest number of spikes (242.25) was obtained at a spacing of 45 cm. Thus, it is evident that the number of grains per area decreases as spacing increases. Among the cultivars, the averages found for BRS Tarumã were higher than CD 150 in all analyzed spacings. The difference found in the number of spike m-2 can be explained by genetic differences in the cultivars. The dual purpose capability found in BRS Tarumã demonstrated high ability to tillering compared to cultivar CD 150. Since the quadratic found for cultivar CD 150 shows that there was compensation in the number of spikes m-2 (spacings 28 and 36 cm) the issue of wheat was visibly limited to genetic factors of cultivar.
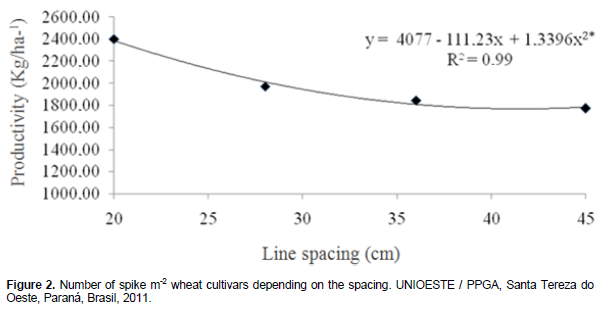
Results obtained by Wendt et al. (2006) and Fontes et al. (1997) corroborates the results of this test on the straight reduction in the number of m-2 ears. Gross et al. (2012) and Alvarenga et al. (2009) also observed linear reduction. The number of grains per ear (Table 2) of BRS Tarumã and CD 150 cultivars was not influenced by increase in space; however, there were significant differences between cultivars. The highest average was obtained by cultivar CD 150 (34.56) while BRS Tarumã obtained an average of 31.06.
Results obtained by Fioreza (2011), Sources (1997) and Silva and Gomes (1986) corroborate these findings, however, increase in density resulted in a decrease in the number of grains in the ears. Moreover, Valério et al. (2008) obtained similar results with increased spacing; however, there was no effect on plant density. The thousand grain weight of BRS Tarumã and CD 150 was not affected by the change in spacing (Table 2). The best average was obtained by cultivar CD 150 (28.467) while BRS Tarumã showed a value of 25.813 (Table 3). The results observed in this study for the thousand grain weight are similar to those obtained by Fontes et al. (1997) and Gross et al. (2012), which showed no correlation between spacing and thousand grain weight. However, the study found reduction of this variable with increase in plant density.
In the 2011/2012 harvest, the wheat yield reached an average of 2399 kg ha-1 in the state of Paraná, while the national productivity average was 2672 kg ha-1 (Conab, 2012). In this research, the average productivity considering the spacing of 20 cm, was up to 2,400 kg ha-1 and, therefore, similar to the Paranamese average for the same crop (Figure 3).
The grain yields were not affected by the spacing between cultivar. However, there were significant differences among cultivars (Table 1), and, BRS Tarumã showed better grain yield (2174.8 kg ha-1) when compared to cultivar CD 150 which showed a productivity of 1822.5 kg ha-1 (Table 2).
On the effect of spacing on the productivity of both cultivar grains, there was a quadratic polynomial response, which was a decrease in grain yield as there was increase in the spacing between rows of cultivation. Figure 3 shows maximum productivity of 2401.87 kg ha- in the spacing of 0.20 m and minimum yield of 1773.12 kg ha-1 in the spacing of 45 cm. The results show that the wheat plant has a high ability to compensate for voids. The tiller offsets the least amount of plants thus causing changes in other physiological variables which account for grain fillings and such feature is strongly limited by the plants genetic ability to issue tillers.
The results show that although the wheat plant has a high ability to compensate for voids by means of the tiller emission offsetting the least amount of plants and causing changes in other physiological variables, which together, account for the grain filling and such feature is strongly limited by the genetic ability of the plant has to issue tillers. Thus, a significant increase in space relates to the adopted does not imply greater emission of tillers to compensate for production.
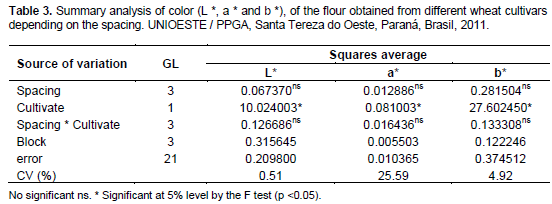
Zagonel et al. (2002) and Silva and Gomes (1990) found no effect of density on productivity. Moreover, Provenzi et al. (2012) found no effect of spatial arrangement in grain yield. Since Wang et al. (1997) and Fontes et al. (1997) found no quadratic reduction in productivity, but rather linear reduction. Table 4 shows the values ​​of lightness (L*) and chromaticity coordinates a* and b* of wheat flour samples. It can be seen that the flour of CD 150 showed a greater average value of L* of 90, 44 while BRS Tarumã showed an average value of 89.32 (Table 4). Cultivar CD 150 showed a higher chromaticity coordinate a*, than BRS Tarumã while the result was reversed for b* chromaticity coordinate (Table 4).
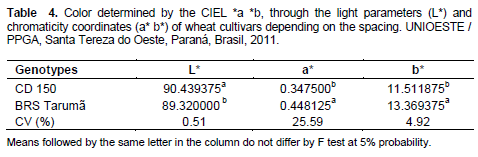
In general, flour is considered white if the L* value is equal to or greater than 93; a* value less than or equal to 0.1 and b* value less than or equal to 8.0 (Gutkoski, 1999) considering these values, cultivar CD 150 is whiter than BRS Tarumã.
In this study, BRS Tarumã and CD 150 cultivars showed different result despite that the pigmentation values ​​handling and environmental conditions which they were exposed to were identical. This result can be explained by the fact that the genetic characteristics of the cultivars were different. Cultivar CD 150 is classified by breeders as improver wheat (flour lighter than other types), while BRS Tarumã is classified as bread type. For this variable, there were no studies found that relate to different row spacing or planting densities. Rodrigues (2012) and Miranda et al. (2011), in managements function adopted for culture, they found different colorations values, which were affected by wheat conditioning method prior to grinding, grinding method and storage of flour and storage time. The test weight of BRS Tarumã and CD 150 was not influenced by increase in spacing, although significant differences between cultivars (Table 5). The ash content of the CD 150 cultivars and BRS Tarumã showed no difference in the interaction spacing x (Table 5). The BRS Tarumã showed a value of 0.62% which is higher than CD 150, which showed a value of 0.61% (Table 6).
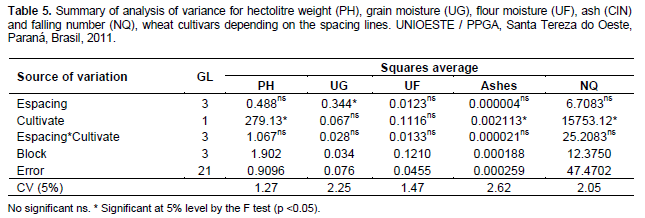
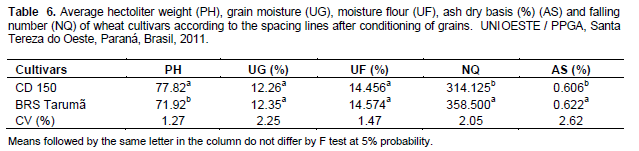
According to Pasinato et al. (2009), high ash content can be a result of high extraction, or presence of bran in flour, which is indicated by dark colored flour, less cooking time and an increase in gluten. Dick and Youngs (1988) reported that the ash content as well as moisture, protein and falling number values ​​is strongly influenced by the growing conditions and harvesting of the crop. Such results as the ash content do not corroborate this research because the results were not influenced by the management system of culture, but, by the cultivars. The best average was obtained by cultivar CD 150 (77.8) while BRS Tarumã obtained a value of 71.9 (Table 6). It can be said that the pH difference between the cultivar CD 150 and BRS Tarumã is related to the genetic characteristics of each cultivar.
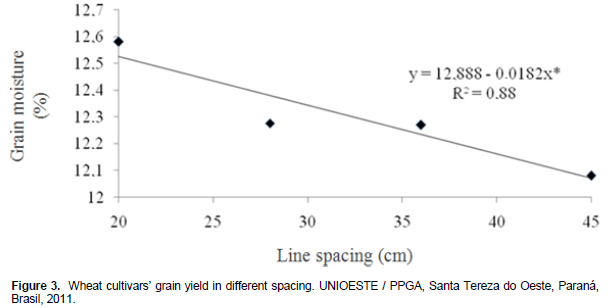
Sources et al. (1997) corroborate the results found in this study, however, Fontes et al. (2000) found a significant difference in pH which was higher in the spacing of 24.3 cm. Penckowski (2006) corroborates this research and explains that the test weight can be attached to the intrinsic characteristics of each cultivar. According to the F test for grain moisture (Table 6), there was significant difference at 5% probability between treatments with respect to spacings. However, there was no significant difference in the interaction of cultivar x spacing. The observed values ​​as the predicted are shown in Figure 4.
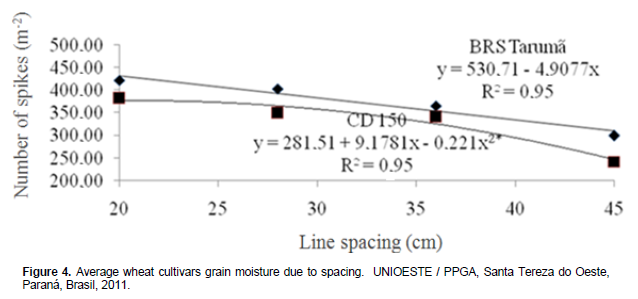
The behavior of grain moisture content compared to the spacing were linear (R2 = 0.88). The presented regression equation shows that on average, there is a decrease of 1.8162% in crop grain moisture for each increase of 1.0 cm row spacing. Under the conditions of this test, the decision was taken when harvesting the beans, in general, met near 12% humidity to avoid production losses. According to the values ​​found, it can be said that the spatial distribution of the crop plants with the added provision in agriculture can lead to microclimate changes between plants. Thus, as the moisture of the grain is influenced by moisture from the ear, it can be said that the microclimate generated between plants due to the increased spacing was changed. To date, no studies were found to correlate moisture grain spacing.
The degree of flour moisture after the trial grinding and before performance of color tests, ash content and falling number are shown in Table 6 which shows that the grain conditioning method before grinding was adequate, because humidity levels suffered no significant difference between treatments. Maintaining the humidity was important in the storage of samples and their level did not exceed the level permitted by Brazilian legislation (Brazil, 2011), that is, none of the samples was greater than 15%.
The overall average falling number of BRS Tarumã was 358.50 the 2nd being more than cultivar CD 150, which showed a value of 314.12 seconds (Table 6). According to the classification of cultivars on tolerance to germination in the ear, according to breeders, BRS Tarumã is moderately resistant while the cultivar CD 150 is moderately susceptible to moderately resistant. This may explain the possible differences between cultivars. Increasing row spacing probably modified the microclimate generated between the wheat plants to help reduce moisture in the ear more quickly, thus contributing to the high number of fall in both cultivars.
The interpretation of the falling number, equal to or greater than 300 s are ideal for the production of pasta and bread. Falling number between 250 to 300 s are tolerable, but less than 250 s Number featuring low quality flour and are used for the manufacture of biscuits. These flours have a market price lower than flours marketed for bread and pasta. According to the given parameters, both cultivars decreased number greater than 300 s and can be marketed as flour for bread and pasta. As mentioned earlier, the type of wheat is classified according to pH values ​​(kg / hl) and NQ (seconds). Neglecting the pH values ​​already discussed, the 4 types of wheats conditioned to NQ values ​​are: Type 1: NQ equal greater than 250; Type 2: NQ equal largest 220; Type 3: NQ equal greater 180 and Type 4: NQ equal greater 62. In this test, the genotypes NQ than 250, therefore, the classification of the type is related to the values ​​observed for PH presented earlier. To date, no studies were found relating the number of fall with different row spacings. Overall, this study showed that increasing the spacing does not influence the technological quality of grain and flour produced; however, it significantly reduces the grain yield.
CONCLUSION
The grain yield and grain moisture were reduced by 26.18 and 3.98%, respectively, with increasing spacing. The hectolitre weight, thousand grain weight, the moisture of the flour, ash content dry basis, the falling number and flour color were not affected by spacing. Cultivar CD 150 presented lighter color (1.24%), higher hectolitre weight (7.58%), lower ash content (2.57%) and higher number of loss (12.38%) in relation to farming BRS Tarumã.
CONFLICT OF INTERESTS
The authors have not declared any conflict of interests.
ACKNOWLEDGEMENT
The work received financial support from Coordernação de Aperfeiçoamento de Pessoal de Nível Superior - CAPES.
REFERENCES
|
Alvarenga CB, Sobrinho JS, Santos EM (2009). Comportamento de cultivares de trigo em diferentes densidades de semeadura sob irrigação indicadas para a região do Brasil Central. Biosci. J. 25:98-107. |
|
|
BRASIL (2011) . Ministério da Agricultura, Pecuária e Abastecimento. Instrução Normativa n° 38, de 30 de novembro de 2010. Regulamento técnico do trigo. Diário Oficial da República Federativa do Brasil, Brasília, DF. 229, 1 dez. 2010. Seção 1. |
|
|
CONAB (2012). Companhia Nacional de Abastecimento. Custo de produção – Culturas de inverno – Série histórica. Disponível em: |
|
|
Dick JW, Youngs VL (1988). Evaluation of durum wheat, semolina, and pasta in the United States. Durum wheat: chemistry and technology. Am. Assoc. Cereal Chem. 13:237-248. |
|
|
EMBRAPA Trigo: Empresa Brasileira de Pesquisa Agropecuária (2006). Sistemas de Produção: trigo. 269p. |
|
|
Fioreza SL (2011). Comportamento produtivo do trigo em função da densidade de semeadura e da aplicação de reguladores vegetais. Dissertação (Mestrado em Agronomia-Agricultura). Universidade Estadual Paulista, Botucatu. P 78. |
|
|
Fontes JR, Cardoso AA, Sousa MA, Cruz CD (2000). Relação do espaçamento e da densidade de semeadura com o rendimento de grãos e outras características agronômicas do trigo. Rev. Ceres 47:1-13. |
|
|
Fontes JRM (1997). Efeito de espalhamentos e densidades de semeadura sobre o rendimento de grãos e outras características agronômicas do trigo. Rev. Ceres 44:249-252. |
|
|
Fontoura SMV (2005). Adubação nitrogenada na cultura do milho em Entre Rios, Guarapuava, Paraná. Fundação Agrár. Pesqui. Agropec. 94p. |
|
|
Gross TF, Dias AR, Kappes C, Schiebelbein LM, Anselmo JL, Holanda HV (2012). Comportamento produtivo do trigo em diferentes métodos e densidades de semeadura. Sci. Agrar. Paranaensis 11:50-60. |
|
|
Gutkoski LC, Antunes E, Roman IT (1999). Avaliação do grau de extração de farinhas de trigo e de milho em moinho tipo colonial. Boletim Ceppa 17:153-166. |
|
|
Miranda MZ, Guarienti EM, Bassoi MC, Scheeren PL, Silva MS, Caierão E (2011). Qualidade tecnológica de cultivares de trigo da Embrapa indicadas para o Paraná na safra 2011. V Reunião da Comissão Bras. Pesqui. Trigo e Triticale. 5p. |
|
|
Pasinato A (2009). Oficina sobre trigo no Brasil. Passo Fundo: Embrapa Trigo112b p. |
|
|
Provenzi FD, Régis B, William D, Antonio BJ (2012). Arranjo espacial de plantas em duas cultivares de trigo. Unoesc & Ciência – ACET. 3:31-36. |
|
|
Penckowski LH (2006). Efeitos do trinexapac-ethyl e do nitrogênio na produtividade da cultura do trigo. Ponta Grossa. Dissertação (Mestrado em Agronomia) – Universidade Estadual de Ponta Grossa, Ponta Grossa P. 84. |
|
|
Rodrigues TRD (2012). Características agronômicas, qualidade da farinha e avaliação de genótipos de trigo duplo propósito submetidos a diferentes manejos de corte. Dissertação (Mestrado em Agronomia) – Universidade Estadual do Oeste do Paraná, Marechal Cândido Rondon P. 98. |
|
|
Silva DB, Gomes AC (1990). Espaçamento e densidade de semeadura em trigo irrigado na região dos cerrados. Pesqui. Agropec. Bras. 25:305-315. |
|
|
Silva DB, Gomes AC (1986). Efeito da densidade de semeadura sobre o trigo irrigado na região dos cerrados. In: Reunião sobre trigo irrigado, Dourados. pp. 25-31. |
|
|
Valério IP, Carvalho FIF, Oliveira AC, Machado AA, Benin G, Pedro Luiz Scheeren PL, Souza VQ, Hartwig I (2008). Desenvolvimento de afilhos e componentes do rendimento em genótipos de trigo sob diferentes densidades de semeadura. Pesqui. Agropec. Bras. 43:319-326. |
|
|
Wang Z, Jinmin FU, Mingrong HE, Yanping YIN, Hongming CAO (1997). Planting density effects on assimilation and partitioning of photosynthates during grain filling in the late-sown wheat. Photosyntetica 33:199-204. |
|
|
Wendt W, Del Duca LJL, Caetano V (2006). Avaliação de cultivares de trigo de duplo propósito, recomendados para cultivo no Estado do Rio Grande do Sul. Embrapa Clima Temperado, Pelotas. 2p. (Comunicado Técnico, 137). |
|
|
Zagonel J, Venancio WS, Kunz RP, Tanamati H (2002). Doses de nitrogênio e densidade de plantas com e sem um regulador de crescimento afetando o trigo, cultivar or-1. Ciênc. Rural 32:25-29. |
|
|
Zardo FP (2010). Análises laboratoriais para o controle de qualidade da farinha de trigo. Dissertação (Mestrado) – Instituto Federal de Ciência e Tecnologia do Rio Grande do Sul, Bento Gonçalves. P. 92. |
|
Copyright © 2024 Author(s) retain the copyright of this article.
This article is published under the terms of the Creative Commons Attribution License 4.0


