Full Length Research Paper

ABSTRACT
A comparative quasi-experimental analysis was made on the impact of small-scale irrigation interventions on household food security, taking irrigation water and farm extension users and non-users in persisting drought contexts in South West Ethiopia. A cross-sectional survey was employed to collect data from randomly selected respondents from both groups. The daily calorie intake was significantly different for the two groups and this was revealed by employing a descriptive statistic, probit model and a propensity score matching. The study concluded with the policy concern that while expanding small scale irrigation supported by productive farm extension packages improves household food security and food surplus for marketing, it also enhances: (1) inequality; (2) conflict over water triggered by the new arrangements; and (3) decline in water yield; risking sustainability of the use of the irrigation water. Such interventions thus demand environmental and land restoration measures.
Key words: Irrigation water, food security, land restoration, droughts.
INTRODUCTION
Food security refers to whether or not people have access to sufficient quality and quantity of food at all times to lead a healthy and productive life (Baldwin, 2006; Hoddinott, 2002; Maxwell, 1994). Devereux (2006) noted that unstable natural contexts, socio-economic and political interventions affect food security status at various levels. The availability, access to, utilization and stability of food (Shirsath et al., 2016) and its entitlement failures determine food security at household and broader levels (Sen, 1981).
Cochrane and Anne (2020), Josephine and Leulseged (2011) and Tesfaw (2018) associate rural transformation, small-scale irrigation (SSI), smallholder farming (SHF) and food security. They argue that in rural farm settings, availability and use of water (rainwater and irrigation) have impact on food security status of smallholder farm households. Specifically, irrigation farming (IF) enhances food availability and stability of famer household by improving food availability, access, utilization and stability over time. Ali (2015) and Wiggins (2016) note over the contrubution of IF farm expansion, food and fibber production; increased food and dietary for the growing world population. However, Masresha et al. (2020), Biruk and Birhane (2017), Shirsath et al. (2016) and Anmut (2020) documented the unintended consequences of IF on the environment .
Rural farm households in Ethiopia faced various shocks and received food aid for decades (UNRISD, 2016). In Ethiopia, the variability in food production is related to the reliance of smallholder farmers on natural rainwater and seasonal farming (MoFED, 2012; CHF, 2010). In average, about 45% of the rural population of Ethiopia faced food shortage (Ali, 2015; Dereje and Desale, 2016) and mostly relied on food aid (Wiggins, 2016; Temesgen et al., 2018). To improve food security status of rural farmers, the government of Ethiopia, with donors such as WFP and World Bank, initiated a productive safety-net program (PSNP) from 2000 to 2009 (MoFED, 2012); during this period and the subsequent first growth and transformation program (GTP I) from 2010 to 2015, Ethiopia maintained continuous growth in agriculture (Anmut, 2020). However, smallholder farmers faced critical food shortage in the years 2003, 2008/9, 2014/2015, etc. (OECD, 2014; Wiggins, 2016; Temesgen et al., 2018; Anmut, 2020). After assessing the causes of food shortage, policy solutions focused on SSI programs; yet droughts and food shortage remained critical challenge in the years from 2003 to 2015 (Wiggins, 2016; Temesgen et al., 2018) and vulnerability to rainfall variability effects remained pervasive (OECD, 2014; Shirsath et al., 2016; Temesgen et al., 2018).
Scholarly studies in various parts of Ethiopia by Wakuma and Wagari (2020), Yilma et al. (2021), Temesgen et al. (2018) and Dereje and Desale (2016) show that IF has positive impact on household food security. In the study locations, smallholder farmers have benefitted from SSI program since 1995. Though positive program impact is observed, SSI beneficiary households in these locations receive food aid; face food shortage and frequent damage to their assets (MoFED 2012; Temesgen et. al., 2018). Also, the frequency of dry spells increased despite the SSI program support (Temesgen et al., 2018; OECD, 2014). The understanding of food security evolved over time (Neef, 2009; Krishnaraj, 2005) and the impact SSI program is linked with food security and rural transformation (Cochrane and Anne, 2020; Tesfaw, 2018; Josephine and Leulseged; 2011). Food entitlements determine food access and utilization (Wiggins, 2016; Devereux, 2006; Campbell, 2012). Household food security has multiple indicators and measures (Campbell, 2012; Masresha et al., 2020; Biruk and Birhane, 2017; Anmut, 2020) and thus, studies at various level and context are essential.
Food security at rural smallholder farm setting considers growing food crops, purchase and transfers (such as aid and reciprocal supports) (Tesfaw, 2018; Temesgen et al., 2018; Dereje and Desale, 2016). Droughts (variability of water availability) are critical factor for growing food crops and entitlements from purchase and transfers (Wiggins, 2016; Tilahun, 2015; Bitew, 2013; Doko et al., 2016; Markose et al., 2019). IF offsets the variability in natural rainfall and provides moisture for plant growth in all seasons and enhance frequency and productivity of the farms (Abera, 2004; Tilahun, 2015; Bitew, 2013; Doko et al., 2016; Markose et al., 2019). Supplies of adequate irrigation water for farms are instrumental for producing enough food and nutrients (Devereux, 2006; Campbell, 2012; Biruk and Birhane, 2017). SSI initiatives aim at boosting agricultural production in all seasons, overcome negative effects of rainfall variability and water constraints for smallholder farms and contribute to food security of smallholder farmers (Heinrich et al., 2010). SSI systems are considered as social protection mechanisms reaching populations and remote locations with cost effective investment as well as less damage to the environment (Assefa et al., 2016). Due to the topography and subsistence nature of the smallholder farms, as well as its low environmental impacts, SSI scheme has been considered convenient for food security in Ethiopian highlands (MoFED, 2012; Masresha et al., 2020).
In Ethiopia, rural cereal farmers (non-cash crop) constitute 45% of the nation’s poorest category, in terms of head count poverty; and this figure was reduced to 29% in 2014/2015 and 23% in 2015/16 (MoFED, 2010a, b; UNRISD, 2016; Biruk and Birhane, 2017; Tesfaw, 2018). Though this is not solely the result of SSI scheme, the scheme contributed to agricultural growth, farm productivity and household food security. The positive impact of SSI on household food security is confirmed by studies conducted by Wakuma and Wagari (2020), Yilma et al. (2021), Temesgen et al. (2018) and Dereje and Desale (2016). Also, previous studies by Ali (2015) confirmed the contribution of SSI on farm production, income and diet diversification in Ethiopia. Heinrich et al. (2010), Cherre (2010), Tadesse (2009), Shumiye (2007) and Abonesh (2006) confirmed the positive impact of SSI on adoption of new technologies and farm intensification, increase in farm productivity and marketed surplus. Neef (2009) and Gulilat (2015) identified the positive impact of SSI on household food security. Thus, there is a theoretical and methodological evidence that SSI schemes have positive impact on food security of smallholder farm households.
However, scholars such as Assefa et al. (2016), Biruk and Birhane (2017), Anmut (2020) and Masresha et al. (2020) identified the problems of SSI schemes. These are the loss of water through seepage, upstream-down-stream tensions and limitations to scale economy, and costs on the environment. Besides the negative impacts of SSI schemes mentioned earlier, there are unanswered questions as to why food shortage is persistent among beneficiaries of SSI schemes in the study area and inquiries whether the positive findings are related to the use of appropriate research approaches, models and estimations. This study thus questioned the positive impact of SSI schemes on household food security of the program beneficiaries.
MATERIALS, METHODS AND ESTIMATION
Two functional small-scale irrigation schemes from two drought-prone locations from Demba Gofa District, South West Ethiopia were selected to measure the impact of the schemes on household food security. The grouping was designed to conduct PSM. A mixed method approach and cross-sectional survey design were used. Both quantitative and qualitative data types and sources were used. The survey was administered for 150 respondents who were selected randomly from 1048 households. Both descriptive analysis (using T and Pearson X-square tests) and econometric analysis (using PSM) were conducted.
The PSM method was applied because it is suitable for policy evaluation researches (Heinrich et al., 2010) and cross-sectional studies that lack basline data for comparon of changes (Sarah and Kevin, 2014; Carolyn et al., 2010; Tri-Long et al., 2017). The use of PSM captures the counterfactual evidence (Caliendo et al., 2008) and offsets the lack of baseline data (Heinrich et al., 2010). After estimating the unobserved effects, econometric model was employed to measure the probability of the impact of the schemes on users as compared to non-users. After finding the estimate of propensity score for covariates, matching qualifiers for user and non-user groups were tested. Then, the impact of the scheme on outcome variable was analysed taking the average annual income.
The basics of PSM estimate refer to the interlinkage between evaluation framework, matching basics and theoretical assumptions behind the model (Caliendo and Kopeining, 2005). The main pillars of the analysis were sampled households (individual users and non-users), treatment (irrigation scheme users) and the potential outcomes (household food security status represented by Y). In the binary treatment, the treatment indicator Di is 1 if individual i uses the irrigation scheme and 0 otherwise. The potential outcomes were then defined as: Yi (Di) for each individual i, where i = 1, … N and N denotes the sample size. The treatment effect for an individual i can be written as:
τi = Yi (1) − Yi (0) (1)
In the equation τi refers to the treatment effect, Yi(1) refers to the income of ith household per adult equivalent and Yi(0) refers to the incomes of the non-users. The fundamental evaluation problem arises because only one of the potential outcomes is observed for each individual i. The unobserved outcome is taken as the counterfactual outcome. Hence, estimating the individual treatment effect τi is not possible at the same time and the average treatment effects of the population were considered (Heinrich et al., 2010). Therefore, the most prominent evaluation parameter is the average treatment effect on the treated (ATT), which focuses explicitly on the effects on those for whom the program is actually intended, in this paper, irrigation water users. Thus, the equation in, this case can be written as:
τATT = E(τ |D = 1) = E[Y (1)|D = 1] − E[Y (0)|D = 1] (2)
where the τATT refers to the average effect on the irrigation water users and E[Y (1)|D = 1] refers to the income of ith scheme user household and E[Y (0)|D = 1] refers to non-users. The expected value of ATT is defined as the difference between expected outcome values in the treatment group. Here, the parameter focuses directly on actual scheme users and determines the realized gross gain from the program as impact indicator (Caliendo et al., 2008). As the counterfactual mean for those being treated – E[Y (0)|D = 1] – is not observed, a substitute was chosen for it in order to estimate ATT. The outcomes of individuals from the treatment and comparison groups were expected to differ even in the absence of treatment leading to a ‘selection bias, thus the ATT can be noted as:
E[Y (1)|D = 1] − E[Y (0)|D = 0] = τAT T + E[Y (0)|D = 1] − E[Y (0)|D = 0] (3)
where the E[Y (0)|D = 0 here refers to the income of ith household per adult equivalent, the difference between the left-hand side of Equation 3 and τATT denote the ‘selection bias’. Therefore, the true parameter τATT is only identified if:
E[Y (0)|D = 1] − E[Y (0)|D = 0] = 0 (4)
In order to solve the selection bias problem stated in Equation 4, a conditional independence assumption (CIA) and overlap assumptions (Heinrich et al., 2010) were invoked. Having the CIA being constant and assuming that there is an overlap in both groups, the PSM estimator for ATT can assume τPSM and be re-written as:
ATT= EP(X)|D=1{E[Y (1)|D = 1, P(X)] − E[Y (0)|D = 0, P(X)]} (5)
In this equation, the PSM estimator is simply the mean difference in outcomes over the common support where the propensity score distribution is appropriately weighed. The estimation of the PSM was explained by outlining the matching estimators by taking two choices into account. The first choice was the model for the estimation, and the second choice was the variable (s) to be included in the model. Considering these two choices, available literature is scanty regarding the functional forms of the choices (Caliendo and Kopeining, 2005).
In principle, any discrete choice model can be used to bit the preference for the logit or probit models (compared to linear probability models) derived from the gaps of the linear probability models, especially the unlikeliness of the functional form and when the response variable is highly skewed and predictions that are outside the [0, 1] bounds of probabilities. For the binary treatment case, where the probability of irrigation users vs. non-users was estimated, logit and probit models usually yield similar results (Caliendo et al., 2008). Hence, probit model was used for estimating the impacts of the scheme on household food security.
The PSM strategy of this study was built on the CIA, requiring that the outcome variable(s) must be independent of treatment conditional on the propensity score. The matching considered choosing a set of variables X that credibly satisfy the CIA. Caliendo and Kopeining (2005) indicated that omitting important variables can seriously increase bias in the estimation results. Only variables that influence simultaneously the treatment (irrigation scheme users) and the outcome (impact on household food security) variable should be included. This study is guided by previous research practices by Caliendo and Kopeining (2005), Caliendo et al. (2008), Jeffrey (2012) and Creswell (2014). These scholars prescribe how economic theory informs the probit model and its assumptions (values of 0 and 1 for the variable Y). There is a latent, unobserved continuous variable Y* that determines the value of Y; presented as:
Y i* = B0 + B1x1i +B2x2i + ::: + Bkxki + ui (6)
In this equation, Yi = 1 if Yi > 0, for treatment and Yi = 0 otherwise, and Y refers to irrigation scheme users, and Xi refers to the explanatory variables. Also, Bki = the parameter coefficient of the variables and determine the decision to grow crops and ui refers to the error terms following the normal distribution with zero mean and constant variance; presented as:
Pr(Yi = 1) = Pr(B0 + B1x1i +B2x2i + ::: + Bkxki + ui > 0) (7)
The Pr(Yi=1)=Pr(ui>-(Bo+B1x1i+…BKxki)) = 1-Pr(ui<(Bo+B1X1i+B2x2i+…+BKxki)) = 1-F(-(Bo+B1x1i+B2x2i+…+Bkxki)) considered F as cumulative density function of the variable u. Assuming normal distribution of u, Pr(Yi = 1) = 1 - ?(-B1x1i +B2x2i + ::: + Bkxki) = 1 - ? (-XiB) = ? (XiB) and ? represents the cumulative normal distribution function. The cumulative normal of Y* was computed to transfer Y* into a probability estimate for Y. In order to substantiate the associations of the test results with independent and dependent analytic grids, the directions of associations were defined and the response categories in the questionnaires were designed. After calculating the propensity score, the algorithm to match (matching estimators) of the user with non-user group were identified. This match is based on the closeness of the propensity scores and the most common estimators are Nearest Neighbour (NN), Caliper and Radius, Stratification and Interval, and Kernel and Local matching. The impact of the irrigation scheme on household food security was evaluated using the Nearest Neighbour, Caliper and Radius, and Kernel and Local matching estimators. A supporting region (region of common support condition) with similar estimates of PSM was used to decide on the association and direction.
Implementing the common support condition ensures that any combination of characteristics observed in the treatment group can also be observed among the control group. Violation of the common support condition is a major source of evaluation bias. Comparing the incomparable must be avoided, that is, only the subset of the comparison group that is comparable to the treatment group were used in the analysis (Caliendo et al., 2008; Jeffrey, 2012). Hence, the overlap and the region of common support between treatment and comparison group was checked and this was checked by comparing the minima and maxima of the propensity scores in both groups or in estimating the density distribution in both groups. ATT and ATE were defined in the region of common support. For ATT the existence of potential matches in the control group was checked. Whereas for ATE, the combinations of characteristics in the comparison group were additionally observed in the treatment group (Ibid).
In order to prove whether the scores were substantive for further analysis and interpretation to answer the research questions and inform policy, balancing test was employed. The basic idea in balancing test was to compare the situation before and after matching and check if there remain any differences after conditioning on the propensity score. This was made to ensure that if there are differences, the matching on the score was not successful and remedial measures have to be done (Caliendo and Kopeining, 2005). The quality of match was assessed by performing tests that check whether the propensity score adequately balances characteristics between the two group units (Heinrich et al., 2010). The objective of these tests was to verify that treatment is independent of unit characteristics after conditioning on the observed characteristics (as estimated in the PSM). The equation in this case will be Di⊥X | p(X) where X refers to the set of characteristics that are believed to satisfy the conditional independence assumption.
After conditioning on p(X), no other variable that could be added to the conditioning set of the propensity score model was left and that step was taken to improve the estimation. After matching, the process was checked to ensure that no statistically significant difference between covariate means of the treatment and comparison units manifested (Caliendo et al., 2008). In examining the results after matching balancing tests, the difference in the covariate means between the two groups in the matched sample was eliminated. Thus, the likelihood of unbiased treatment effects was expected and refinements to the propensity score model specification were made to improve the resulting balance. In this study the balancing test is conducted by t-Test and Pseudo-R2 test, and mean absolute standardized bias test as recommended by Caliendo and Kopeining (2005), Jeffrey (2012), Sarah and Kevin (2014) and Tri-Long et al. (2017).
Household food security was assumed as outcome variable to estimate the impact of the irrigation schemes on the food security status of the beneficiaries. A food energy intake measurement is used by scholars in food security literature and this study also employed it as measure of household food security. This measurement considers food poverty line which is the minimum amount of food (RDA of 2200 kcal) intake per adult equivalent to stay healthy and productive. The total calorie consumed by irrigation user and non-user households was computed by food types consumed by each household multiplied with their calorie contents for seven days. The procedure used by Neef (2009) and its suitability was methodologically tested.
A step-by-step procedure was employed to calculate the threshold (cut off) point for the food poverty line; the steps are: (1) total value of food consumed (Xj) by each household, which is equal to the sum of the value of purchased food (Vj) and the value of own production consumed (Kj) was determined: hence, X j =Vj+Kj. The value of purchased food consumed (Vj) by each household was established by multiplying the quantities of different food types purchased (Dij) by the prices per unit: (Pij): Vj = ΣDijPij, where Vj = value of purchased food consumed by the jth household, Dij = the quantity of the ith food items purchased by the jth household and Pij = the local price paid by the jth household for the ith item. The value of the own output or donated food consumed by the household, Kj is the product of own production including donation (Mij), remittance and the local price (Pij). The quantity Mij is the computed value of consumption: Kj = ΣMijPij. (2) The adult equivalent (Hj) for each household (with the conversion scale). (3) Total value of food consumed per adult equivalent was derived by dividing the total value of food by household adult equivalent: F = Xj/Hj, where Xj = total value of food consumed by jth household, Hj = adult equivalent for jth household and F = total value of food consumed per adult equivalent units. (4) The different types and quantities of food consumed by the different households were converted to calories: Cj. (5) A regression model was fitted to estimate parameters to be used in determining food poverty line (threshold point): LnXj = a+bCj, where Xj = Total food expenditure per adult equivalent by household J, Cj = Total calorie consumption per adult equivalent by household J, and a and b are parameters to be estimated. (6) The food poverty line, Z which was the estimated cost of acquiring the calorie recommended daily allowance (RDA) was estimated as: Z = e(a+bR), where Z = Food poverty line, and R = Recommended daily allowance (RDA) of calories per adult equivalent of 2,200 Kcal. Using this step-by-step procedure, a household who does not meet the minimum food expenditure or below food poverty line was categorized as food insecure and thus challenge whether a positive link exists between irrigation water use and household food security status in drought prone areas.
DATA RESULTS AND DISCUSSION
The data analysis was conducted in four steps considering explanatory variables. These are:
(1) Socio-demographic characteristics of the respondents;
(2) Socio-economic characteristics of the respondents;
(3) Access to SSI schemes and policy support services;
(4) Assessment of the impact of SSI on household food security of users and non-users.
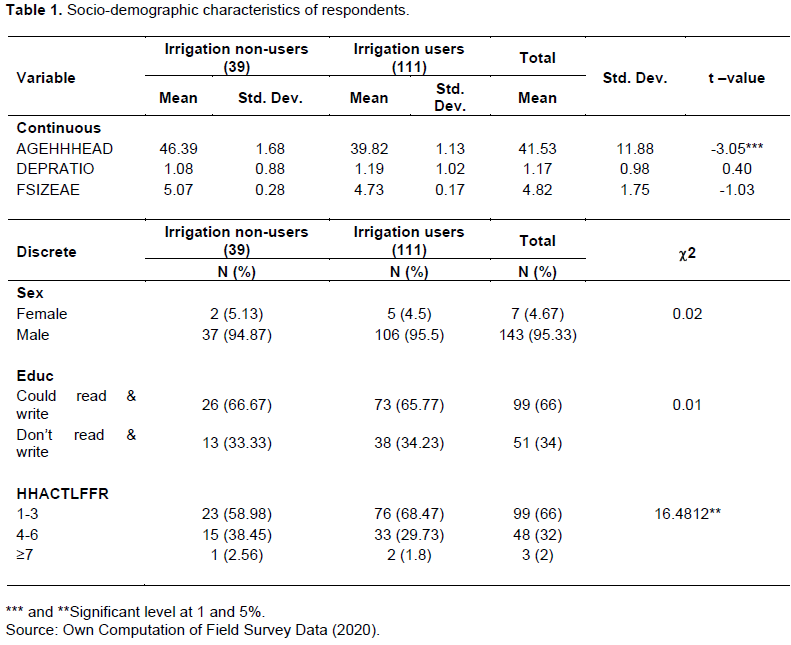
The variables considered in the first category were age, family size, dependency ratio, sex and education level of the respondents. Age was proposed as variable that influences the adoption of technology. The older the age, the more conservative to adopt new technology. The data in Table 1 shows that age of the beneficiary is associated with the adoption of new farm practice techniques introduced by the program; and the mean difference varies by more than 6 points (46.39 for non-users and 39.82 for users). In terms of dependency ratio, though the average dependency ratio of users of irrigation water (1.02) was smaller than that of the non-users (1.08), the association was not significant; and in both cases, it is less than the national (1.15) and regional averages (1.17) (Tesfaw, 2018; Bitew, 2013). The average family size is 5.07 for non-users and 4.73 for users of the scheme. In both cases, the average family is slightly more than the national average (5) for non-users; but in both cases, the family size is below the regional average of 6 (CSA, 2020). However, also in the case of average family size, the association is not significant. Education level was considered important in technology adoption, improving productivity of labour, farm management and marketing (Josephine and Leulseged, 2011; Markose et al., 2019). From sampled household heads, most could read and write (66%). However, association is statistically insignificant. In the literature, sex of household head determines food security status, new technologies adoption and participation in off-farm labour activities (Temesgen et al., 2018). Male heads of households have better opportunities to pool labour than female heads of households. The sex composition of the total sampled households revealed that most households in the irrigation sites are males; confirming that rural farm service provision such as access to irrigation schemes favours males (Doko et al., 2016). However, the chi-square test result is insignificant; confirming that only few female farmers have access to the scheme. About 59% of households have one in three adult equivalent labour. In male headed households, the adult equivalent labour is greater than for those in female headed households. The chi-square test result indicated that having active labour significantly determines access to irrigation water at 5%.
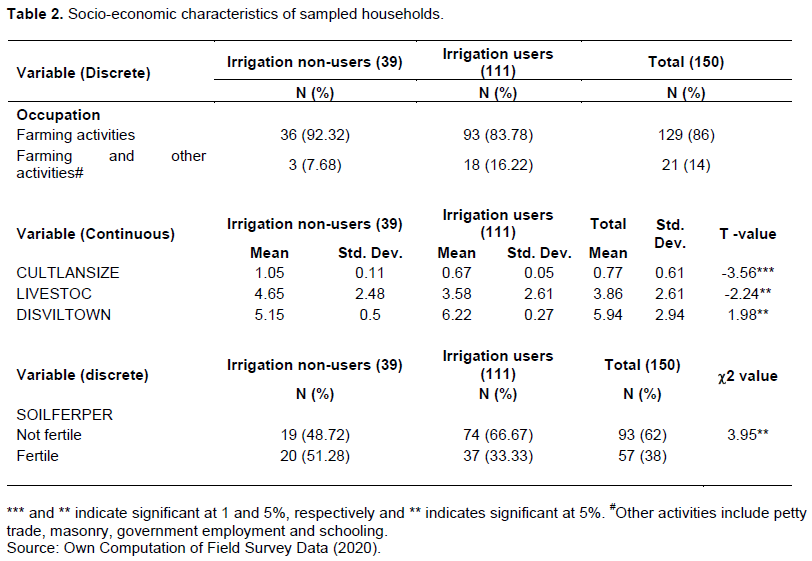
Socio-economic characteristics of sample households were analysed in the second category of variables. Rural people in Ethiopia, irrespective of location, mainly make their living from agriculture and face risks related to vulnerability to drought shocks (Dereje and Desale, 2016). As indicated in Table 2, most households were engaged in agriculture (86%) and the rest 4% in both agriculture and off-farm activities. The share of irrigation users that were mainly engaging in agriculture was found to be nine in ten; the rest in off-farm and farm activities. From the responses, land and livestock are critical factors in both growing crops and harvesting as well as improving their food security status. In this respect, those with larger farm size and oxen produce more times and diversify their income sources. Households with livestock have alternative nutrition and sale income. For these variables, the association is significant at 5%. According to the responses, for 62% of the beneficiaries, their farm land is not fertile; and the rest 38% own fertile land. Regarding market access, the nearest market place is in 5.15 km for non-users and 6.22 for the users. In both cases, the association to the scheme is significant at 5% level. Therefore, farm land size, livestock, distance from market and fertility of soil determine access to irrigation scheme as well as food security status of household in the study area.
At the third step, access to the scheme and the related policy support services by the users and non-users were analysed. From literature, credit fills financial constraints of rural farmers both to invest and consume; it expands opportunities of access to agricultural inputs (Amarech, 2019). The credit services provided as policy support are improved seeds, inorganic fertilizers and expert supervision. As indicated in Table 3, about three in five use credit and the remaining two in five do not use credit. In the study season, only 18% (users) and 45% (non-suers) did not get credit. The Chi-square test result was found to be significant at 1% significance level.
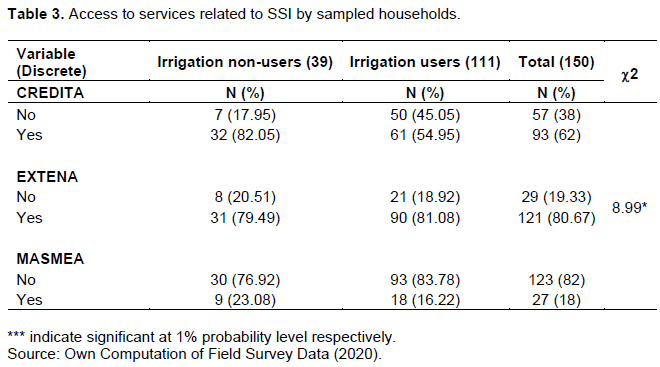
In Table 3, four in five households mostly access extension services. Here agricultural extension service refers to advice, training and demonstration of agricultural techniques and displaying its productivity as compared to local farming techniques that the households were using for years. The frequency of visits of extension agents to sampled households was associated with changes in techniques of farming and thus increases in yields per hectares. Though irrigation users were being visited frequently, non-users of irrigation water were not. The Chi-square test result revealed that the relationship between access to irrigation water and the extension service was not found to be statistically significant. Mass media have supposed to benefit useful information in agricultural technologies and market information. Table 3 has shown that four in five of the households observed had no access to one of mass media mentioned. Most of the households relied on word-of-mouth and visits of the extension workers. From the aforementioned data results, the majority of sampled households lacked access to mass media outlets; since the village is in remote location. Even if users of irrigation have a better access to mass media than non-users, were found to be statistically insignificant.
The fourth category was related to assessing the impact of SSI on household income comparing the two groups. As explained in the literature review, access to irrigation water is opportunity for farm households to grow different crops, increase harvest by increasing frequency, increase crop production by controlling variability of rainfall and improve annual income (Tesfaw, 2018; Markose et al., 2019). The income from crop production also improves the food security of the farmers (Temesgen et al., 2018; Amarech, 2019). As shown in Table 4, the average total income per annum derived from crop production, sale of livestock (and its products) and off farm income was found to be 6587 Birr. The average income for irrigation users and non-users of irrigation was also 10996 and 5037 Birr, respectively. In comparing the mean income between the users and the non-users, the mean income of irrigation users was twofold greater than that of the non-users. The mean income difference between the groups was also statistically significant at 1%. The per capita income of sampled household was also found to be statistically significant at 1%. In this case access to and use of SSI water improve income. The income for both groups is relatively greater than the national relative poverty line by MoFED (2010/2011); and the irrigation users, it is considerably higher. The mean income difference derived from crop production between the users and non-users of irrigation was different (5473 for users and 2985 for non-users); and the association between crop income, irrigation use and household food security is statistically significant at 1%.
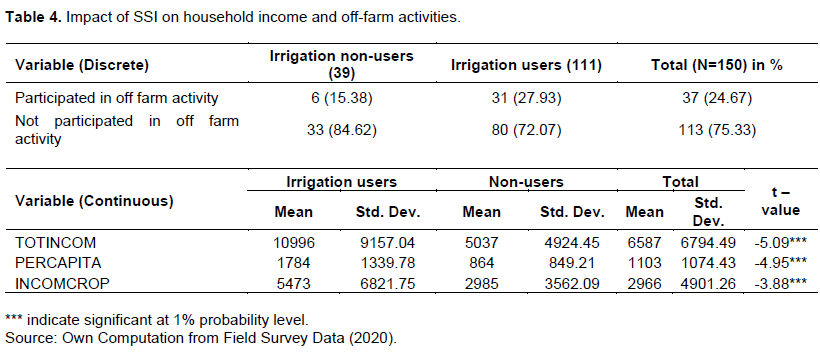
The irrigation facility and the changes in farming practices triggered off farm activities in the locations. The off-farm activities the sampled households were engaging were hired out labour, petty trading, sales of local drink and food, manual worker (carpenter, masonry), barber and contractual level temporary government employments. From qualitative interviews and discussion with farmers in the field, off-farm income earning activities emerged after the introduction of the SSI and the increase in the yield and harvests. Value added farm produce such as local drink and food were the results of the improvements in the grain surplus produced. Table 4 shows also that the participation rate in off-farm activities from the users and non-users of irrigation was found to be 15, and 28%, respectively. Hence, irrigation users have a better opportunity to ensure food security than the non-users of the irrigation water. This is because the access to irrigation water and the changes in farming practice increased food production, grain outputs and stabilized the availability of food.
The impact of SSI on crop production is associated with food availability and surpluses for sale to the beneficiary households (Temesgen et al., 2018). One of the advantages of irrigation water is improving the availability of water to increase crop production both in dry seasons and in terms of frequency of harvest. It is explained in the literature review that using irrigation water enhances crop farming via intensification and diversification including cash crop production and increase in productivity for the users than the non-users. In doing so, irrigation improves the availability of food for households and then stabilizes household food supply – both staple and cash crops. The main cash crops for non-users of the irrigation were water maize, teff and groundnut. Cash crops such as onion, pepper, tomato, head cabbages were produced by irrigation water users while maize as a dominant staple food and cash crop simultaneously grown by both. In group discussion majority of irrigation users agree that they prefer to cultivate two times a year because of two reasons. The first reason is that the volume of river water declines at dry season and not sufficient to feed water to the irrigation canals. The second reason is that the quantity of production in the third cultivation round is significantly reducing. The plots need more compost. The third is that, in the group discussion, farmers explained that though it is possible to produce three times a year by making crop rotation to protect yield loss, the activity was tiresome and labour-saving policy support is needed. In addition, they explained that, the cause for declining of the river water is due to a severe deforestation due to farm expansion along the river banks. Therefore, for them, irrigation schemes should be aligned to the intensification of farming and degradation of land in the catchment. For the majority of users of the irrigation water, even if the frequency of cultivation is two times per annum as that of non-users of the irrigation water, farmers do not deny that the productivity and yields are higher than that of the non-users of the irrigation water.
The impact of SSI on food utilization of sample households was also associated with the increased and diversified food production or surplus sale incomes. Food utilization is food security indicator measured by numbers of meals the household eat per day, the number of food insecure months and the number of meals utilized containing meat and protein rich beans other than the special holidays in Ethiopia as proxy for nutrition. In Table 4 above, the frequency of meals consumed by households per day was three to four times. The more the frequency of meal consumed, the better food security assumed ceteris paribus. From the results in Table 4, meal consumption as a measure of food security indicator did not explain a difference in food security situation between the users and the non-users. Number of meat and protein rich beans consumed as an ordinary meal (not festivity and ceremonial days) in the last twelve months in recall data and in the last seven days as part of calorie intake data collection, were considered to measure food security. The response from the total sampled household heads was classified into three categories: those who ate meat and protein rich beans sometimes, those who ate meat rarely, and those who did not eat meat and protein rich beans at all were observed. In terms of eating meat and protein rich beans rarely as the second food security indicator, households from the users of the irrigation water were greater by more than 25% than those of the non-users. This implies that access to irrigation has helped households from the users of the irrigation water to eat food with better nutrition than those households from the non-users of the irrigation water. The third, food security measure employed was the number of food insecure months for the sampled households during the last twelve months. The total sampled households responded that the food insecure months ranged between none to seven. Zero months referred to households that did not encounter a food shortage in the last twelve months. This data result, in Table 4, implies that users of the irrigation water were less vulnerable and susceptible to food insecurity in terms of encountering food short months; as compared to non-users of the irrigation scheme.
After the demographic and socioeconomic descriptive data analysis, the study analysed the PSM results. The main objective of the econometric PSM analysis was to find the net effect of the irrigation scheme by establishing a statistical comparison group of irrigation water users and non-users in growing crops in all seasons. In evaluating the effect of the scheme from cross-sectional data, it is difficult to get data simultaneously before and after the intervention. Evaluations of the effect of the scheme to actual program participants have a sample selection and bias estimation problem. In this section, to avoid a self-selection problem and a biased estimation of the effect of the scheme to food security, the PSM method of analysis was employed. To conduct the analysis, two main steps were followed. First, using STATA 11 Software Package, probit estimate of the propensity to irrigation use by all sampled households was estimated. Second, in order to arrive at the average treatment effect of irrigation users (household food security), annual income per adult equivalent and food consumption expenditure of each participant in the irrigation group was matched with non-users having similar predicted propensity score values. As indicates in the methods and materials section, three matching algorithms were used in order to offset the trade-offs in biases of each algorithm and enhance the efficiency of the estimation effects.
To obtain a robust result of the effect of the program intervention, the two main assumptions of the PSM requirements were checked before conducting the PSM. The assumption of strong reluctance that is, the assumptions of conditional independence and overlap conditions were tested before matching of the treated and the untreated. The balancing test of conditional independence assumptions of observable variation between the two groups were tested using Psuedo R2, the p value of likelihood ratio test, and the mean absolute standardized bias difference of the groups were checked. The mean standardized bias difference showed less than 20% after matching; specifically in this study, it was less than 5%. After matching it was checked that no difference in the distribution of covariates is observed insignificant and the pseudo R2 is considerably lower after the matching.
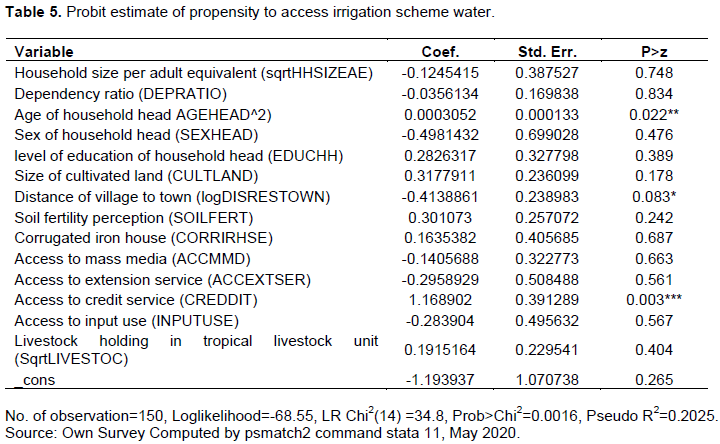
The overlapping conditions of the supporting regions were checked by the minimum and maximum range of predicted propensity score between the two groups. The observations of the two overlapping regions in the treatment and control group was discarded and was not used for estimation of average treatment effects of irrigation on household food security. After confirming the basic assumptions of PSM method, the evaluation of the treatment effect probit model was employed. Finally, the sensitivity analysis of the average treatment effect on the treated was done. This analysis was done to check the magnitude of the influence of unobservable variable that could simultaneously change the outcome variable (household food security) and the average treatment effect on the treated to hidden bias was also tested. In terms of analysis of the conditionality of the PSM, first overlapping and supporting regions of the propensity scores were observed and interpreted. Before finding the overlapping and supporting regions of each covariate observations between treatment and control groups, predicted propensity scores of probit estimate were found. The probit estimate of propensity score was done by radius matching with calliper of 0.03; this algorithm was used for the analysis because of its relatively better matching quality in reducing the mean standardized biases. Table 5 indicates the probit estimates of the propensity of impact of the scheme on household food security.
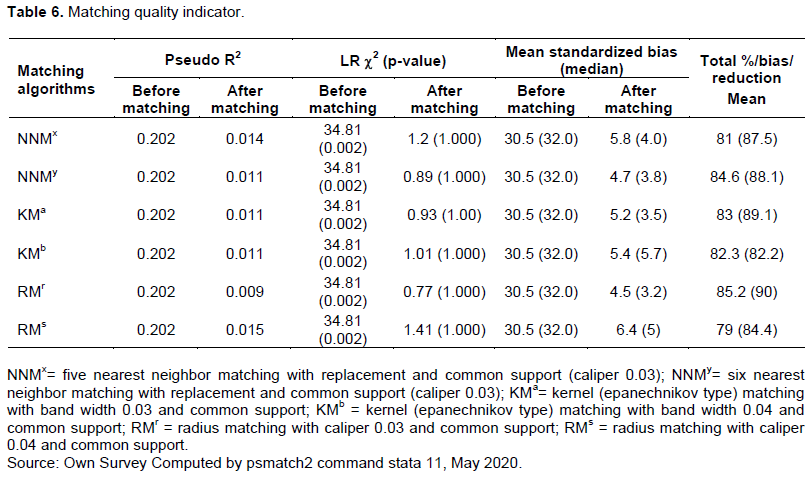
The propensity score balanced the covariates across the observation. After probit estimate of propensity score, a considerable overlap in the common supporting region was found. From Table 6, the propensity score for users ranged from 0.060 to 0.8926 with a mean of 0.4243; and for non-users, the score ranged from 0.0041 to 0.7617 with mean of 0.2028. The overlapping and common support assumption was satisfied in the region of [0.060, 0.7617]. The intersection of the common support region was also demonstrated and the overlapping and common support conditions were met. The matching quality indicators were observed by checking the quality of covariates matched between the groups. Thus, one of the main assumptions to be fulfilled before estimating the average treatment effect of the outcome variables was met. Using the three matching algorithms, in Table 6, the quality of matching was tested in the probit estimation. The mean standardized bias difference of covariates between users and non-users before matching was around three in ten (31%) and this was reduced to about 4.5 to 6.5% after matching. The total mean standardized bias reduction was reached at a range of 81 to 85%. In addition, the median standardized bias difference before matching was 32% and was reduced to 3.2 and 5.7% after matching. The pseudo R2 before matching was about 20% and was reduced to about a range of 0.0 to 1.7%. The p value of likelihood ratio test in percentage also indicated that the significance of covariates before matching was significant and this has become insignificant after matching. Therefore, with all nearest neighbour, kernel, and radius matching algorithms, the total reduction in pseudo R2, the mean standardized bias and the insignificant p value shows that the proposed propensity score estimation was successful in balancing the distribution of covariates.
The aforementioned figure indicates that the observations in the irrigation user group have a suitable comparison group. Treated off support indicates that the observations in the irrigation user group do not have suitable comparison. Before starting the analysis of average treatment effects, the covariate balancing test was observed. As indicated in Table 7, the standardized bias before matching was 62% and this was reduced to about less to than 5% for ten covariates out of the fourteen covariates fitted to the model. In addition, all covariates have shown insignificant difference. Hence matching was satisfied in group wise as well as each covariates balance between the treated and the control group.
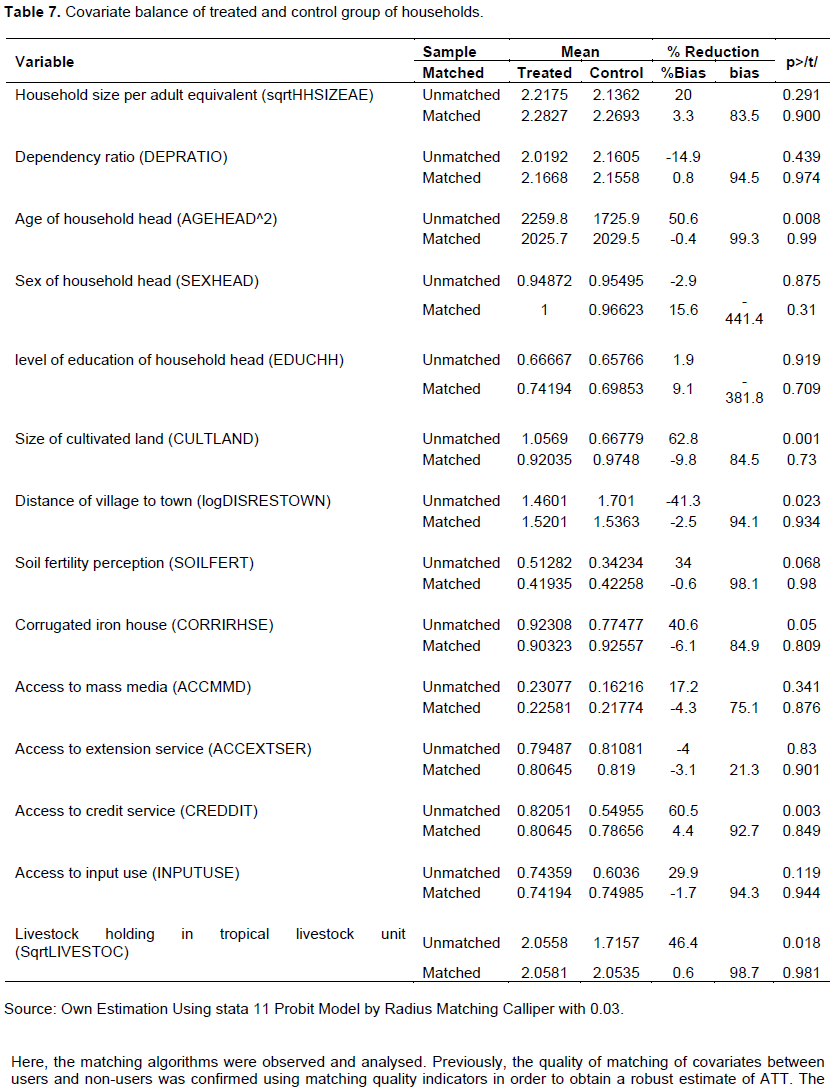
Here, the matching algorithms were observed and analysed. Previously, the quality of matching of covariates between users and non-users was confirmed using matching quality indicators in order to obtain a robust estimate of ATT. The estimation of average treatment effects of irrigation on users (ATT) for both outcome variables was estimated using the three matching algorithms. All matching algorithms were conducted in the common supporting region after dropping mismatch of eight covariates.
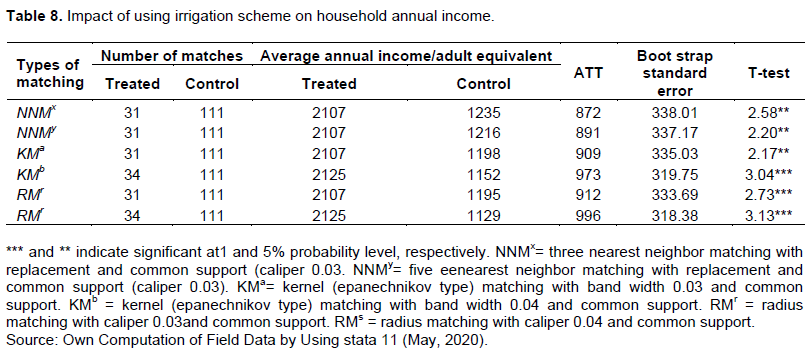
Average treatment effect on the treated was observed between the annual incomes of households per the adult equivalent. Table 8 shows the average annual income per adult equivalent of irrigation users (ATT) that was increased in the range of 872 to 996 Birr across the algorithms. In comparing the gain of ATT with households having the same characteristics, but do not use irrigation scheme, the difference was found to be statistically significant at 1%. The proportion of increment of ATT for irrigation users across the different matching algorithms ranged from 41 to 47%. As expected, the cause for increment of ATT is associated with access to irrigation schemes; this further confirms that access to irrigation scheme improves household food security.
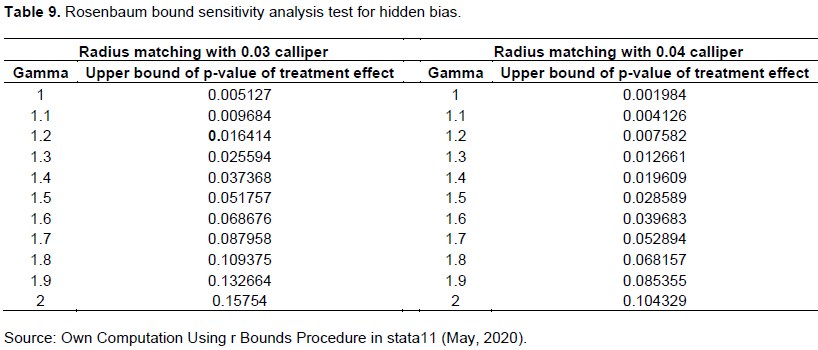
A sensitivity analysis was employed was to explore whether the matching estimates were robust to selection bias due to the unobservable (Rosenbaum, 2002); using r-bounds procedure and the result was indicated in Table 9. As observed in Table 9 using radius matching with 0.03 and 0.04 callipers, the effect of small-scale irrigation on the outcome variables was not sensitive to selection bias. The result was as much as 10 and 20% in terms of unobserved covariates, respectively. However, the critical value of gamma at which point the positive effect of irrigation participation has questionable starts at gamma 1.2 and 1.3 for the radius matching with 0.03 and 0.04 callipers, respectively. This implies that if individual with the same covariate differs in their odds of irrigation use by a factor of 20 to 30%, the significance of irrigation use on the outcome variable is questionable. Hence, the outcome was very sensitive to changes in unobservable variable and this concern was considered in the interpretation.
The data analysis and interpretation of findings using the earlier four steps of explanatory variables indicated that access to irrigation scheme has positive impact on household food security. From the earlier analysis, socio-demographic variables such as age, family size, dependency ratio, education and sex considerably determine the access to policy support such as irrigation scheme in drought-prone locations (Table 1). These results confirm the findings of previous studies by Amarech (2019). However, as hypothesized earlier, the findings do not show how the intervention increased the existing inequalities within the beneficiary and between the beneficiary and non-beneficiary groups. Also, the socio-economic variables such as income generating activities (farm/non-farm), land size in hectares, livestock in TLU, soil fertility and distance from market determine the outcome variable (household food security status of the beneficiary and non-beneficiaries of the irrigation schemes) (Table 2). In addition to the explanatory variables, policy supports such as provision of credits, expert advice and inputs such as improved seed and fertilizers improve the outcome variables (Table 3). The explanatory variables are therefore critical in shaping the difference between the users and non-users of the schemes, in terms of adopting new farm techniques, improving incomes and consumption as well as producing marketable surpluses. These results confirm previous study findings by Amarech (2019), Tesfaw (2018), Temesgen et al. (2018) and Markose et al. (2019).
In general, access to irrigation scheme improved household income (measures by annual income) and consumption (measured by kilo calorie intake and dietary diversity) above the national and regional averages for the beneficiary groups (Table 4). The descriptive statistical results were further scrutinized using probit model and PSM to conclude whether access to irrigation scheme has impact on household food security; and if so, whether the impact is statistically significant. The result in Tables 5 to 9 concretely indicated that the impact is statistically significant in the condition that adequate adult equivalent age, land size and access to credit facility is fulfilled (Biruk and Birhane, 2017). Under these conditions fulfilled, among others, access to irrigation scheme has significant impact on household income (in food availability and marketable surplus), dietary diversity (calorie intake) and resilience to drought effects (stability in production, mixing crop and livestock farming as well as engagement in off-farm activities). These results confirm the findings of the previous studies (Masresha et al., 2020; Biruk and Birhane, 2017; Anmut, 2020; Amarech, 2019; Tesfaw, 2018; Temesgen et al., 2018; Markose et al., 2019).
Rural households in dry and drought-prone areas of Ethiopia suffer from food insecurity. The causes relate to erratic rainfalls, land degradation, high population pressure and low productive subsistence farming system practiced in Ethiopia. Food insecurity exists even under good rainy seasons in Ethiopia due to lack of technology of the use of water. The government designed policies such as PRDSP, PASDP and GTPI&II under the long-term policy direction of ADLI. Development of Small-Scale Irrigation (SSI) schemes and water management has been one of the strategies for improving farm production, productivity and management of available water as well as reducing vulnerability of crops to climatic volatility and erratic rains at one hand and transforming the reliance on rain fed farming system which accounts for 90% in Ethiopia. This study explored the impact of SSI in reducing vulnerability of farms, improving food security in drought-prone areas as well as ensuring food surplus, marketable crops and sales of farmers. The descriptive and the regression results confirmed that the food security status of irrigation water users is higher by 14% compared to non-users of irrigation.
The result of propensity scores matching analysis showed that the proportion of increment of annual income per adult equivalent of ATT for irrigation users across the nearest neighbour, kernel and radius matching algorithms ranged from 35 to 40%. The per capita income of irrigation users was 1784 Birr which is above the national per capita income average of 1075 birr. This means irrigation water users’ poverty status has also improved. The food consumption expenditure has increased in the range between 23 and 31%. However, lack of improved water management, shortage of agricultural input, irregularities in extension support service and constraints in marketing of agricultural products reduced the positive impacts. The tensions between the upstream and downstream water users undermine cooperation and increased the tension. The exploitation of full potentials of the small-scale irrigation waters requires policy actions and coordination in respect to institutional and environmental factors. Thus, further empirical research and policy information is needed in the areas of: (1) the cost and benefit analysis of irrigation water investment, (2) the comparison of income derived by use of modern and traditional irrigation systems, (3) the constraints of non-functional small scale irrigation schemes and its institutional arrangements, 4) comparative cost and benefit analysis of crops planted in the irrigation sites in terms of marketability leading to commercialization of the farms.
CONFLICT OF INTERESTS
The author has not declared any conflict of interests.
ACKNOWLEDGMENTS
The author thanks all respondents that participated in this research and appreciates agriculture offices and experts that supported in providing materials (documents) during the study.
REFERENCES
|
Abera Y (2004). Problems of the solution: intervention into small-scale irrigation for drought proofing in the Mekele Plateau of northern Ethiopia, The Geographical Journal 10(3):226-237. |
|
|
Abonesh T (2006). The impact of small scale irrigation on household food securityand assessment of its managementsystems: the case of filtino and godino irrigationschemes in ada liben district, east shoa, ethiopia, an MSc thesis. Haramaya university. Available at Graduate Library of College of Development Studies, Addis Ababa Unversity, Ethiopia. |
|
|
Ali SN (2015). Prospects and Challenges of Structural Transformation in Ethiopia: Assessing the Performance of GTP I and Reflecting on GTP II, Conference Paper Presented at Ethiopian Economics Association with Ethiopian Economic Policy Research Institute, October 3, 2015, Addis Ababa, Ethiopia. Available at Graduate Library of College of Development Studies, Addis Ababa Unversity, Ethiopia. |
|
|
Amarech B (2019). Microfinance and Women Empowerment in Ethiopia, PhD Dissertation, UNISA 2019. Available at Graduate Library of College of Development Studies, Addis Ababa Unversity, Ethiopia. |
|
|
Anmut EK (2020). Challenges and Opportunities of Irrigation Practices in Ethiopia: A Review. Journal of Engineering Research and Reports 9(3):1-12. |
|
|
Assefa S, Biazin B, Muluneh A, Yimer F, Haileslassie A (2016). Rainwater harvesting for supplemental irrigation of onions in the southern dry lands of Ethiopia. Journal of Agricultural Water Management 17(8):325-334. |
|
|
Baldwin S (2006). Food Security In Developing Countries. The Parliamentary Office of Science and Technology 8(1):1-4. |
|
|
Biruk SD, Birhane AA (2017). A critical Review of Small-Scale Irrigation in Ethiopia: Prospects and Challenges. International Journal of Current Research 9(11):60916-60920. |
|
|
Bitew GT (2013). Status of Small-Scale Irrigation Projects in Amhara Region of Ethiopia. Nile Basin Water Science and Engineering Journal 6(1):1-6. |
|
|
Caliendo M, Kopeinig S (2005). Some Practical Guidance for the Implementation of Propensity Score Matching. The Institute for the Study of Labor 7(3):1-32. |
|
|
Caliendo M, Iza B, Kopeinig S (2008). Some practical guidance for the implementation of propensity score matching. Journal of Economic Surveys 22 (1):31-72. |
|
|
Campbell C (2012). Food Insecurity: A Nutritional Outcome or a Food Insecurity: A Nutritional Outcome, The Jouranl of Nutrition 7(3):1-8. |
|
|
Carolyn H, Alessandro M, Gonzalo V (2010). A Primer for Applying Propensity-Score Matching, IDB Impact-Evaluation Guidelines Technical Notes No. IDB-TN-161 August 2010. |
|
|
Cherre S (2010). Irrigation Policies, Strategies and Institutional Support conditions in Ethiopia. Available at Graduate Library of College of Development Studies, Addis Ababa Unversity, Ethiopia. |
|
|
CHF (2010). Impact Assessment of Small?Scale Pump Irrigation in the Somali Region of Ethiopia, PLI Policy Project September 2010. |
|
|
Cochrane L, Anne C (2020). Transformative Change in Rural Ethiopia: The Impact of Small and Medium-Scale Irrigation. Journal of Rural Social Sciences 35:1. |
|
|
Creswell J.W (2014). Research Design: Qualitative, Quantitative and Mixed Methods Approaches, 4th ed.. Calf: sage Publications: Thousand Oaks. |
|
|
CSA (2020). Ethiopia Demography & Health Survey July 2005, Addis Ababa, Ethiopia. Available at Graduate Library of College of Development Studies, Addis Ababa Unversity, Ethiopia. |
|
|
Devereux S (2006). Distinguishing between chronic and transitory food insecurity in emergency needs assessments. World Food Programme, Emergency Needs Assessment DN 1:5-6. Available at Graduate Library of College of Development Studies, Addis Ababa Unversity, Ethiopia. |
|
|
Doko H, Birhane E, Ulsido M (2016). Design of Jigessa Small Scale Irrigation in Dara Woreda, Southern Ethiopia. Open Access Library Journal 3(1):1-13. |
|
|
Dereje M, Desale K (2016). Assessment of the Impact of Small-Scale Irrigation on Household Livelihood Improvement at Gubalafto District, North Wollo, Ethiopia. Journal of Agriculture 6(27):1-22. |
|
|
Gulilat B (2015). Present and future water resources development in Ethiopia related to research and capacity building. Planning and Projects Department, Ministry of Water Resources, Addis Ababa, Ethiopia. Available at Graduate Library of College of Development Studies, Addis Ababa Unversity, Ethiopia. |
|
|
Heinrich C, Maffioli A, Vázquez G (2010). A Primer for Applying Propensity-Score Matching Impact-Evaluation Guidelines. Inter-American Development Bank DN 10:1-32. |
|
|
Hoddinott J (2002). Food Security in Practice Methods for Rural Development Projects, International Food Policy Research Institute Washington, DC 12:2-5. |
|
|
Jeffrey MW (2012). Introductory Econometrics: A Modern Approach, USA: Michigan State University Press. |
|
|
Josephine T, Leulseged Y (2011). Small-scale irrigation in the Ethiopian highlands What potential for poverty reduction and climate adaptation? UKAID/RiPPLE Briefing Paprt No. 3. |
|
|
Krishnaraj M ( 2005). "Food Security: How and for Whom? Economic and Political Weekly 5(2):2508-2512. |
|
|
Markose CZ, Michele M, Daregot BT, Zemen AA, Jan N, Enyew AT, Amare SM, Steven VP (2019). Agricultural Technical Efficiency of Smallholder Farmers in Ethiopia: A Stochastic Frontier Approach. Journal of Land 10(246):1- 22. |
|
|
Masresha T Tesfaye S, Agidew A (2020). Determinants of Small-Scale Irrigation Use and its Effect on Household Food Security in Mirab Abaya Woreda, Southern Ethiopia. International Journal of Research Studies in Biosciences 8(8):42-47. |
|
|
Maxwell S (1994). Food Security: A Post-Modern Perspective. Food Policy 21(2):155-170. |
|
|
MoFED (2010a). Performance Evaluation of the First Five Years Development Plan (2006-2010) and the Growth and Transformation Planning (GTP) for the Next Five Years (2011-20015), Addis Ababa, Ethiopia. Available at Graduate Library of College of Development Studies, Addis Ababa Unversity, Ethiopia. |
|
|
MoFED (2010b) .Ethiopia: Building on Progress: A Plan for Accelerated and Sustained Development to End Poverty (PASDEP)(2005/06-2009/10) Volume I: Main Text Addis Ababa. Available at Graduate Library of College of Development Studies, Addis Ababa Unversity, Ethiopia. |
|
|
MoFED (2012). Ethiopia's Progress Towards Eradicating Poverty:An Interim Report on Poverty Analysis Study (2010/11).Development Planning and Research Directorate. Ethiopia ,Addis Ababa. Available at Graduate Library of College of Development Studies, Addis Ababa Unversity, Ethiopia. |
|
|
Neef A (2009). Transforming rural water governance: Towards deliberative and polycentric models? Water Alternatives 2(1):53-60. |
|
|
OECD (2014). Existing Tools, Practices and Guidelines to Foster Governance in the Water Sector. OECD Water Governance Initiative, February 2014. |
|
|
Rosenbaum PR (2002). Sensitivity to Hidden Bias. In: Observational Studies. Springer Series in Statistics pp. 105-170. Springer, New York, NY. |
|
|
Sarah B, Kevin K (2014). An Introduction to Propensity Scores: What, When, and How. The Journal of Early Adolescence 34(1):66-92. |
|
|
Sen A (1981). Ingredients of Famine Analysis: Availability and Entitlements. The Quarterly Journal of Economics 6(1):433-464. |
|
|
Shirsath PB, Agarwal P, Thornton K, Dunnett A (2016). Prioritizing climate¬ smart agricultural land use options at a regional scale, Journal of Agricultural Systems: |
|
|
Shumiye A (2007). Determinants of Food Insecurity in Rural Households in Tehuludere Woreda, South Wello Zoneof the Amhara Region.MSc thesis. Addis Ababa University. Available at Graduate Library of College of Development Studies, Addis Ababa Unversity, Ethiopia. |
|
|
Tadesse B (2009). Agricultural Water Management National Situation Analysis, Policy Brief. Retrieved December 2011, from http://awm-solutions.iwmi.org |
|
|
Temesgen H, Mengistu K, Fekadu B (2018). Evaluating the impact of small-scale irrigation practice on household income in Abay Chomen District of Oromia National Regional State, Ethiopia, Academic Journal of Development and Agricultural Economics 10(12):384-393. |
|
|
Tesfaw M (2018). Small Scale Irrigation Development. Journal of Irrigation Drainage Systems Engineering 7(1):1-7. |
|
|
Tilahun A (2015). Technical and institutional attributes constraining the performance of small-scale irrigation in Ethiopia, Journal of Water Resources and Rural Development 6(2015):2212-6082. |
|
|
Tri-Long N, Gary SC, Jessica S, Jean-Pierre D, Devereaux PJ, Paul L, Yannick LM (2017). Double-adjustment in propensity score matching analysis: choosing a threshold for considering residual imbalance. BMC Medical Research Methodology 17(78):1-8. |
|
|
UNRISD (2016). Policy Innovations for Transformative Change: Implementing the 2030 Agenda for Sustainable Development, UNRISD 2016 Flagship Report 2016, Pachuca, Mexico. |
|
|
Wiggins S (2016). Agricultural and rural development reconsidered: A guide to issues and debates, OECD and, IFAD Research Series 01, ISBN 978-92-9072-604-3. |
|
|
Wakuma DT, Wagari G (2020). The Role and Significance of Small-Scale Irrigation in Improving Household Income in Ethiopia. International Journal of Research in Business Studies and Management 7(3):20-35 ISSN 2394-5931 |
|
|
Yilma J, Abera A, Workalemahu T (2021). Impact of small-scale irrigation on household food security in Ethiopia. Journal of Agriculture and Food Security 10(21):1-16. |
|
Copyright © 2024 Author(s) retain the copyright of this article.
This article is published under the terms of the Creative Commons Attribution License 4.0


