ABSTRACT
Classical geostatistic techniques and geostatistics are important tools to co-relate linearly and spatially vegetal productivity to the soil´s properties. Spatial and Pearson´s co-relationships between the attributes of the sunflower plant and the soil´s properties were used in Campo Novo do Parecis MT Brazil in 2013 to determine the most significant co-relationship between cause and effect (soil and plant). A geostatistic network was established to collect data from the soil and plant from 100 sample points in plot with sunflower plants. Soil was classified as Red-Yellow Dystrophic Latosol (Typic Tropudox) and the capacity for cation exchange by Pearson´s linear co-relationships was the sole attribute of the soil to estimate the productivity of achenes. Since it had a direct spatial relationship with APL, and, in its turn, APL with PR, the soil´s pH provided a better performance in the limitation of regions with distinct growth and productive potentials of sunflowers. Conservational managements of the soil that aim at raising organic matter rates which, in their turn, affect directly and positively cation exchange capacity, are required to obtain the highest productivity of sunflower achenes due to their close relationship with plant´s height and achene mass.
Key words: Soil fertility, Helianthus annuus L., regression, kriging map, semivariogram.
Sunflower crops (Helianthus annuus L.) have highly interesting agronomic characteristics for production systems in the Brazilian savannah. They comprise great tolerance to droughts, cold and heat when compared with most species cultivated in Brazil (Leite et al., 2005). Owing to its high demand by industrial and commercial sectors, the sunflower is a highly relevant economical alternative in crop rotation, intercropping and succession in grain-producing regions (Porto et al., 2007). According to data by Conab (2014), estimates on sunflower production in Brazil for the 2014/14 harvest amount to 108.8 thousand tons of grain, with the share of the state of Mato Grosso featuring 78.2%, or 85.1 thousand tons. Cultivated area occupies 68.7 thousands of hectares, with mean productivity of 1585 kg ha-1, with 1679 kg ha-1 for the state of Mato Grosso.
Research-provided information has been decisive for technological support in crop development with better productivity and competitive economic gains. Among the several technologies developed for the production of sunflower, the choice of the genotype is the main item for the crop´s production system (Porto et al., 2007). Further, increase in crop productivity also involves mineral nutrition and the correct supply of essential elements that comply with the requirements at each phenologic stage. The sunflower´s nutritional requirements (Zobiole et al., 2010) are higher than those of other second harvest crops, such as corn (Pinho et al., 2009) which is the main crop cultivated in autumn in the Parecis region in the state of Mato Grosso, Brazil.
Geostatistics analyzes the spatial dependence of geo-referenced data from which a semivariogram is derived, represented by a semi-variance graph due to distances between observations. A kriging map may be thus prepared for each soil or plant attribute which represents the data´s spatial variability. However, a co-kriging maps may also be provided for the main attribute, more interesting, albeit more difficult to obtain, due to the secondary attribute which is normally easier to obtain (Molin et al., 2007; Montanari et al., 2010; Dalchiavon et al., 2011). The secondary attribute may spatially provide estimates for the first attribute and eventual interventions of soil management targeting the primary attribute.
Research has recently been developed to discover the relationship between the soil´s chemical attributes (secondary) and the crop´s productivity (primary), with special reference to Lima et al. (2010), Dalchiavon et al. (2011,2013a,b), Carvalho et al. (2012) and Montanari et al. (2013a) respectively for eucalyptus, jack beans, eucalyptus, sugarcane, rice and beans. Since the studies above reveal the scantiness of research on the sunflower, it is highly relevant that research co-relates its development with the soil´s chemical characteristics, with special focus on the regions in which the crop may be employed during autumn to replace corn. In fact, producers in the Parecis region may minimize production costs and the social and environmental impacts of monoculture. Current research utilizes spatial and Pearson´s co-relationships to investigate the sunflower plant´s productivity as a function of the soil´s chemical attributes.
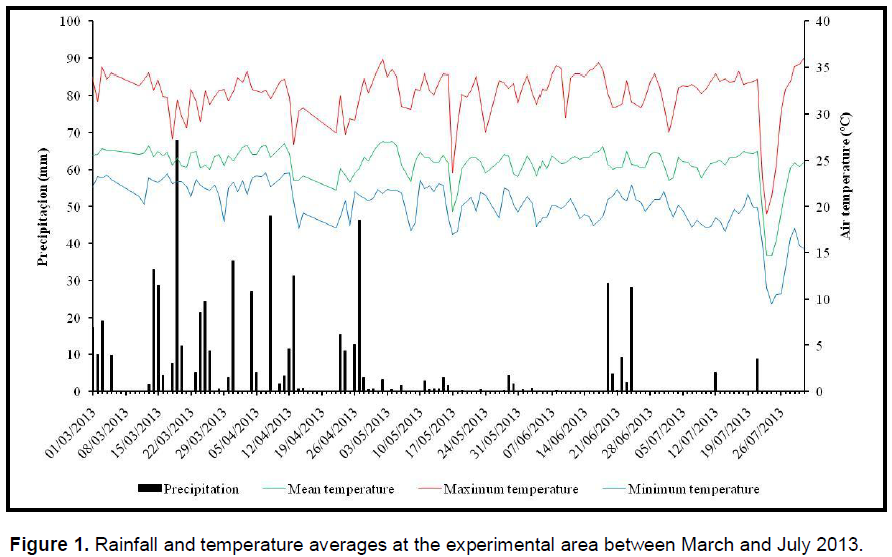
Current study was developed at the Instituto Federal de Mato Grosso (IFMT) in 2013, in Campo Novo do Parecis MT Brazil, at 13°40'31" S; 57°53'31" W; 574 m high. Climate is Aw (tropical wet climate, with rainy summers and dry winters). Figure 1 shows mean rainfall and temperature during the crop period.
Soil is Red-Yellow Dystrophic Latosol (Typic Tropudox), characterized by 506 g kg-1clay, 134 g kg-1 silt and 360 g kg-1sand at 0 to 0.20 m layer. Initial chemical features of the soil (2012) at 0 to 0.20 m layer revealed the following rates: pH (CaCl2) = 5.7; MO = 26 g dm-3; P (resin) = 5.9 mg dm-3; K, Ca, Mg and H+Al = 1.5; 32; 11 and 40 mmolc dm-3, respectively, with V = 54.8%. After soybean harvest, Hybrid Syn 045 sunflower crop was sown in a 5,525 m2 (65 x 85 m) plot on 13/03/2013, with 0.45 x 0.33 m spacing and basing fertilization at 300 kg ha-1 featuring 10-30-20. Data collection network was established on 25/07/2013, with 10 N-S transections, spacing 7 m, with ten sampling point each, spaced 9 m, with a total of 100 points. Soil and plant attributes for each sampling point were collected between 25/07/2013 and 30/07/2013.
Soil attributes at a depth between 0 to 0.20 m were collected between the lines of the central point, for rates of phosphorus (P), organic matter (OM), pH (CaCl2), potassium (K), calcium (Ca), magnesium (Mg), potential acid (H+Al), sum of bases (SB), capacity for cation exchange (T), saturation per base (V%) and boron (B). The soil´s chemical attributes were obtained following Raij et al. (2001). All analyses were performed at the Laboratory of Physics and Soil Fertility of the Engineering Faculty of Ilha Solteira (UNESP) SP Brazil.
Plants´ attributes, productivity of achenes (PA), mean height of plant (MHP), basal diameter of the stem (BDS), chapter diameter (CD), chapter mass (CM), mass of achenes (MA), achene index (AI) and mass of one hundred achenes (M100) were determined from data collected in 4 rows of 1.80 m crop height.
Calculation of PA (kg ha-1) for each point was based on 3.24 m2 (1.8 x 1.8 m) by manual harvest of the chapters at stage R9 after natural drying, mechanical pathway and weighing. MHP (m) was assessed by a sample of five continuous plants measured between the plant´s base and the insertion of the chapter in full florescence (R5.5); BDS (mm) was measured by digital caliper at 5 cm of soil level at the end of full florescence; CD (mm) was also measured by digital caliper. CM (g) was evaluated by mean weight of 5 chapters, whereas MA (g) was measured by weighing the achenes only. AI was calculated by MA/MC; M100 (g) was determined by random collection and weight of a samples with 100 achenes. Grain humidity was 11% for PA and M100 (humid base – h.b.).
Statistical analysis was performed with SAS (Schlotzhaver and Littell, 1997) and Excel sheets, following Dalchiavon and Carvalho (2012). The attributes´ descriptive analysis was performed by calculating mean, median, minimum and maximum rates, standard deviation, coefficient of variance, kurtosis, asymmetry and the analysis of frequency distribution by Shapiro and Wilk´s test. A correlation matrix was established among all the researched attributes comprising all possible paired combination to detect Pearson´s significant correlations among the attributes (dependent variables x independent variables). PA´s simple and multiple linear regressions were undertaken as a function of the soil´s or plant´s attributes to trace which would function as quality indicator when PA had to increase. SAS was employed for multiple linear equations at 10% probability for the inclusion and exclusion of variables in the model, following Dalchiavon and Carvalho (2012). Gamma Design Software 7.0 (GS+, 2004), was employed for geostatistic analysis following procedures described by Dalchiavon and Carvalho (2012). Spatial dependence was analyzed for each attribute by calculating the semivariogram where adjustments were previously made by the initial selection of (a) the lowest sum of the square of the deviations (RSS); (b) highest coefficient of determination (r2); and (c) highest evaluator of spatial dependence (ESD). Interpretation proposed for ESD followed Dalchiavon and Carvalho (2012): a) ADE < 20% = very low dependence spatial variable (VLD); b) 20% ≤ ESD < 40% = low dependence (LD); c) 40% ≤ ESD < 60% = fair dependence (FD); d) 60% ≤ ESD < 80% = high dependence (HD) and e) 80% ≤ ESD < 100% = very high dependence (VHD). Co-krigings were performed especially between PA and the soil´s and plant´s attributes to discover an attribute (soil and/or plant) that would spatially function as quality indicator, or rather, when the productivity of achenes had to be increased.
Normal frequency distribution (FD) is the best for statistical studies (regression and/or geostatistic analyses) since it is the typical representation of the plant´s data; otherwise, normality is reached by logarithmic transformation (Molin et al., 2007). Table 1 shows that the attributes PA, CD, CM, MA and M100 had normal frequency distribution whose coefficients of kurtosis and asymmetry varied respectively between -0.615 and 0.662 and e -0.964 and 0.512. The above was expected since they were biological attributes (Lima et al., 2010; Montanari et al., 2010, 2013a; Dalchiavon and Carvalho, 2012, 2013a, c), where as the other attributes (MHP, BDS and AI) had a non-determined type of distribution.
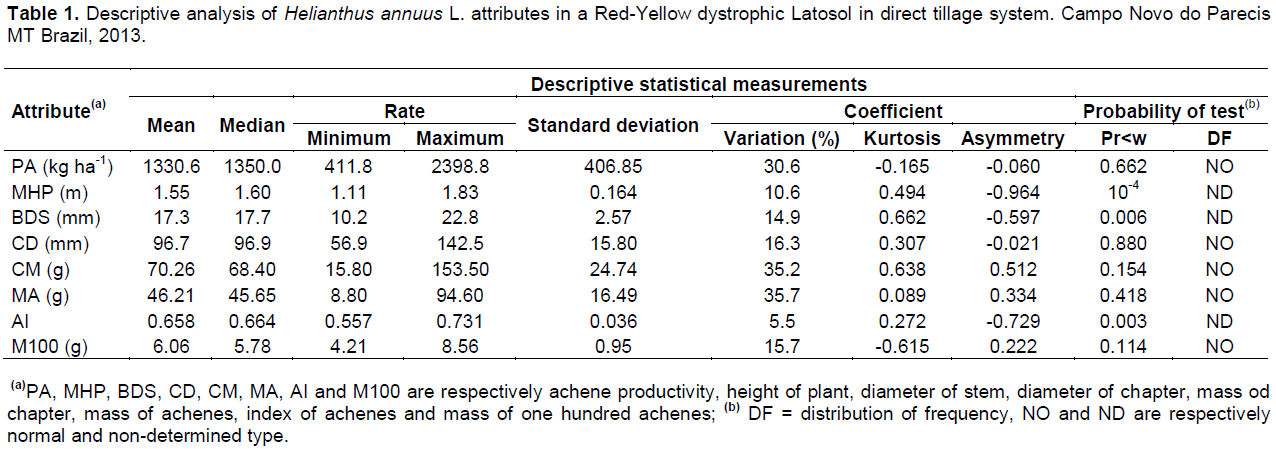
Low (AI), medium (MHP, BDS, CD and M100) and very high (PA, CM and MA) data variability occurred when analyzed by the coefficient of variance (Table 1) and contrasted data by Martin et al. (2012) for attributes PA, MHP, BDS and CM. This may have been related to the fact that the authors worked with different spatial distributions among the plant rows. PA rate of 1331 kg ha-1 was low when compared to rate 1671 kg ha-1 of medium PA for the state of Mato Grosso in the 2012/2013 harvest (Conab, 2014); similarly to PA rate of 1555 kg ha-1 reported by Höhn et al. (2012) for cultivar Syn 045. The results above may be due to difficulties in controlling weeds in the post-emergence condition, which caused competition for the available environmental resources, and to the lack of B fertilization, an essential nutrient to the crop´s numberless metabolic processes. On the other hand, PA exceeded the rate (1287 kg ha-1 for the same cultivar Syn 045) registered by Embrapa (2011) in an experiment network in the state of Rondônia, Brazil. Other medium rates were respectively 96.7 mm; 70.26, 46.21 and 6.06 g for CD, CM, MA and M100. In the case of attributes with non-determined frequency distribution, median rates were 1.60 m (MHP), 17.7 mm (BDS) and 0.664 (AI), similar to data by Höhn et al. (2012), featuring MHP with 1.68 m; CD with 120 mm and M100 with 5.10 g, and by Embrapa (2011), featuring MHP with 1.26 m.
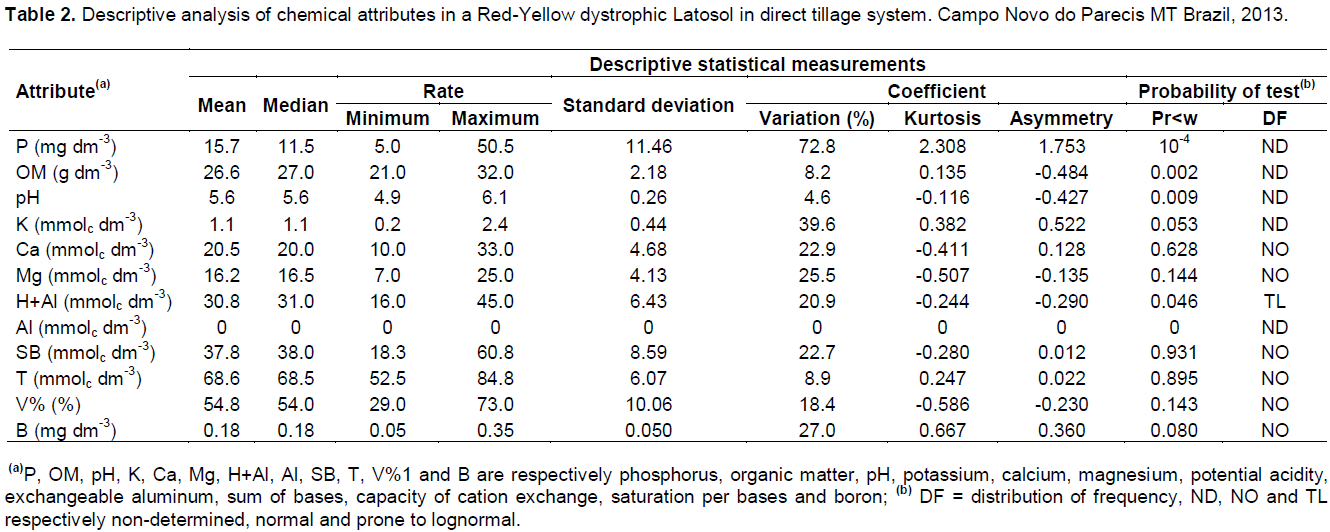
In the case of soil attributes (Table 2), normal (Ca, Mg, SB, T, V% and B) and non-determined DF (P, MO, pH, K and Al) occurred, with lognormal – TL (H+Al). As a rule, the coefficients of variation remained between low (pH and Al) and very high (P and K), similar to those of kurtosis, between -0.586 and 2.308, and asymmetry, between -0.484 and 1.753, as described by Dalchiavon et al. (2012, 2013a,b) and Montanari et al. (2013a) for DF and coefficients of variation. In the case of soil fertility and taking into account mean/median rates of their chemical attributes, they represented low (P, pH, K), medium (MO and V%) and high (Ca and Mg) rates, following limits reported by Dalchiavon et al. (2012c), justifying partially PA. Rates of the soil´s chemical attributes agreed with those mentioned by the same authors when they investigated the spatial variability of fertility of a Red Dystroferric Latosol under direct tillage in Selvíria MS Brazil.
Interesting and significant correlations for the pairs of attributes were 1) PA x MHP (r = 0.557**); 2) PA x BDS (r = 0.558**); 3) PA x CD (r = 0.630**); 4) PA x CM (r = 0.664**); 5) PA x MA (r = 0.671**); 6) PA x M100 (r = 0.217*)and 7) PA x T (r = 0.196*), or rather, similar to the positive correlations by Amorim et al. (2008) and Martin et al. (2012) for PA x CD and PA x M100, respectively. It should be underscored that all correlations had a direct cause-effect behavior. In other words, any alteration in the independent variables´ rates (cause) caused a similar change in the variable response (PA).
Coefficients of correlation between the plant´s attributes were high (p<0.01) and positive, featuring a good direct relation among the attributes analyzed. The T was the only significant soil attribute with PA, with a low but positive coefficient of correlation (p<0.05), mainly due to being a classic example of dependent (PA) against and independent (T) variable, and to the high number of observations (n=100), common in geostatistic studies, as has been reported by Carvalho et al. (2012) and registered by other researchers (Molin et al., 2007; Dalchiavon et al., 2013a,b,c; Montanari et al., 2013a,b,c). Adjusted equations were the following:
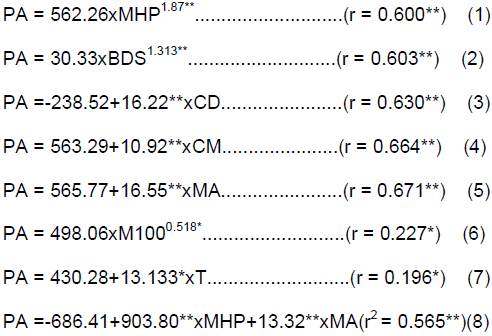
Equations (1), (2) and (6) showed the potential direct influence of MHP, BDS and M100 on PA, whilst Equations (3), (4), (5) and (7), albeit direct, revealed linear models among the independent (CD, CM, MA and T) and dependent (PA) attributes. Equation (5) provided the best adjustment (with a higher “r”) among the equations for plant´s attributes. Thus, it has been highly recommended to estimate PA at 1330 kg ha-1when MA has 46.21 g (Table 1). However, T was the only soil attribute to estimate PA (Equation 7) which will be 1331 kg ha-1 when T is 68.6 mmolc dm-3. Alternately, Equation (8), multiple linear regression obtained stepwise, may be employed to estimate productivity, which is currently 1375 kg ha-1. Consequently, conservation managements of soil, such as direct tillage to raise the rates of organic matter which, in turn, affect T directly and positively, are required to obtain the highest productivity of sunflower achenes since the attribute is closely related to MHP and MA (Equation 8).
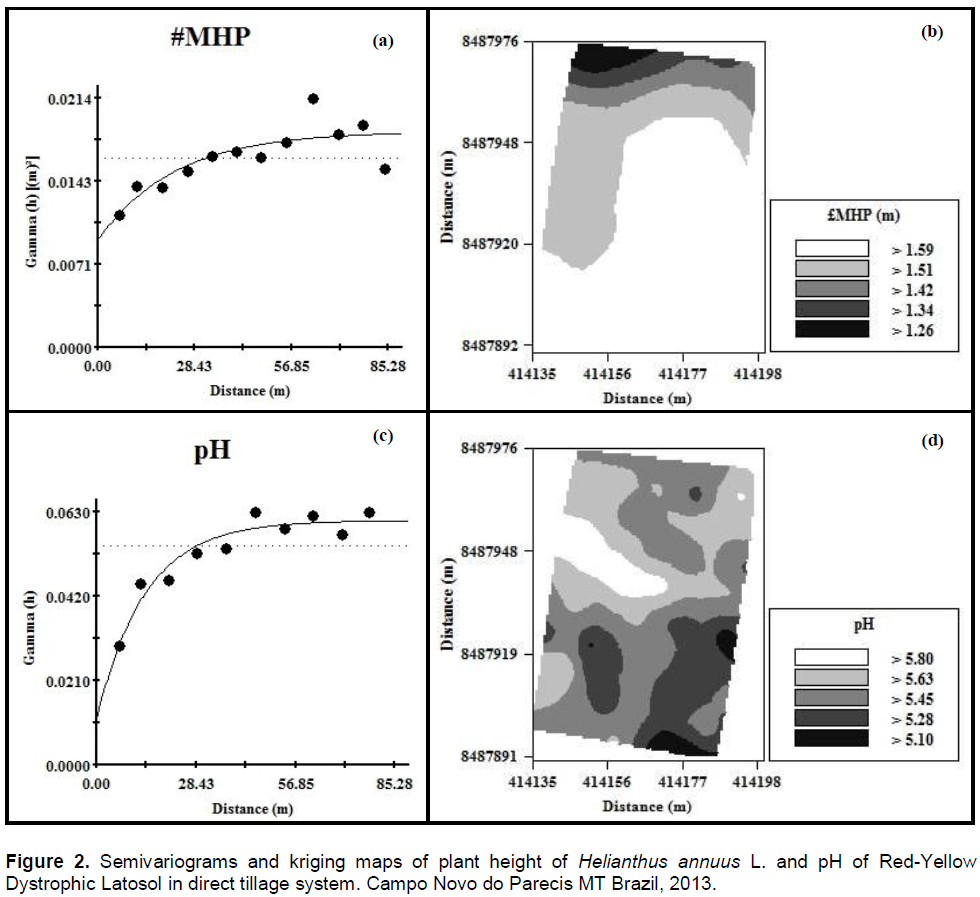
Geostatistic analysis (Table 3; Figure 2) showed that, in the case of attributes lacking gold standard, MHP derived in a coefficient of high (0.668) spatial correlation (r2), medium (50.3%) spatial dependence (ESD) and angular coefficient(b) of cross validation equal to 1, with a high quality of experimental semivariogram of the exponential type and differing from the Guassian semivariographic model reported by Carvalho et al. (2012), who analyzed MHP of Eucalyptus camaldulensis, and reported very high r2 (0.965), medium ESD (59.5%) and angular coefficient of cross validation equal to 0.986.
In the case of soil attributes, spatial correlation coefficients remained between medium (V%; 0.423) and very high (pH; 0.916), spatial dependencies between low (K; 32.9%) and very high (V%; 99.5%) and angular coefficients between 0.453 (K) and 1.002 (P). Geostatistic data in Table 3 had a similar behavior to results reported by Molin et al. (2007), Lima et al. (2010), Carvalho et al. (2012) and Dalchiavon et al. (2011, 2012c, 2013a,b,c), when these authors investigated the spatial variability of the soil´s chemical attributes with different annual and perennial crops.
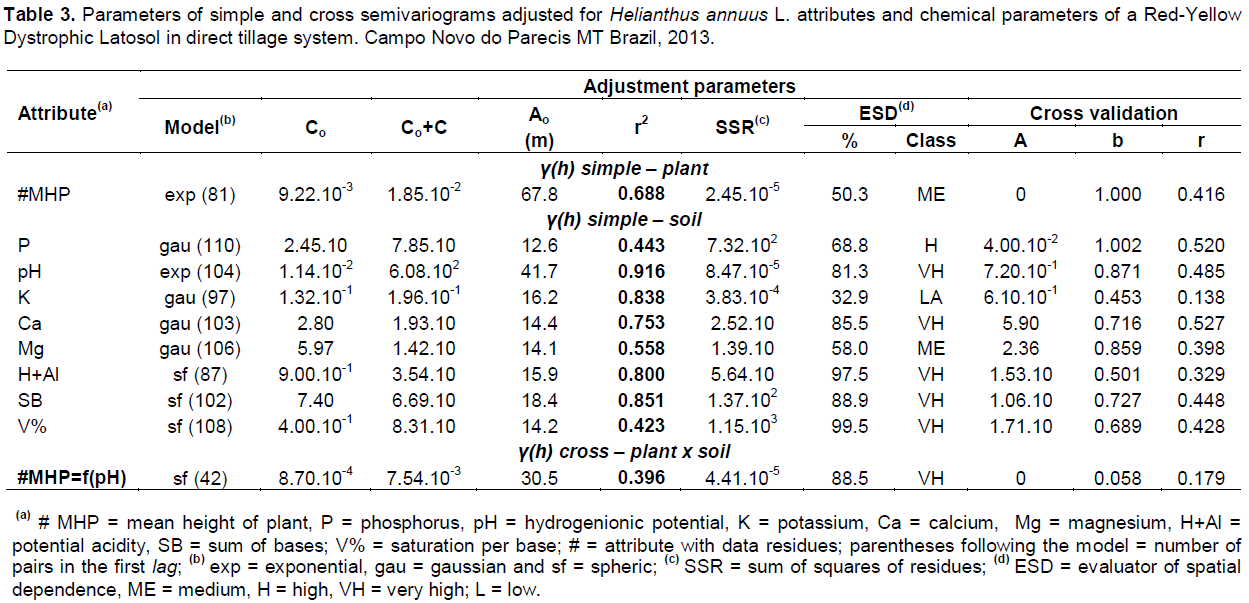
Cross semivariogram (Table 3; Figure 3) provided a low coefficient of spatial determination (r2=0.396) for the sphere-type only semivariographic model [#APL=f(pH)]. From the spatial point of view, a direct MHP correlation occurred with pH. In their research on the relationship of the soil´s physical and chemical attributes with the eucalyptus´s dendrometric characteristics, Lima et al. (2010) reported that the volume of timber in the species was spatially explained by the strict bonds with the soil´s pH. On the other hand, Dalchiavon et al. (2011) studied the spatial variability of the bean´s productivity correlated with the soil´s chemical attributes under direct tillage system and registered spatial correlation between the grains´ productivity and the soil´s pH. Gauss-type cross semivariogram with r2=0.925 could be modeled. In an analogous way, Montanari et al. (2013a) verified that, when they analyzed the relation between the productivity of bean grains and the chemical attributes of a type of soil with direct tillage system, the productivity of beans could be explained by the soil´s pH special rates. The studies above clearly reveal the influence of the soil´s Ph on the attributes of vegetal production.
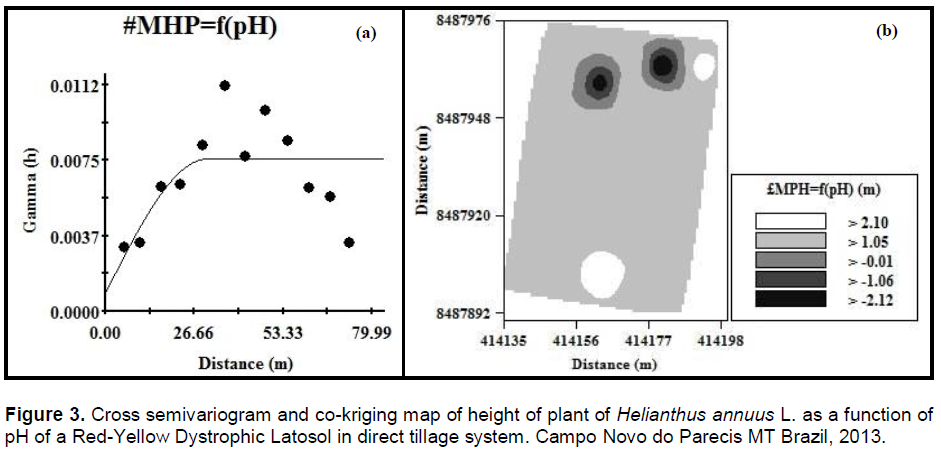
In Figures 2 and 3, co-kriging #APL=f(pH) showed the lowest £APL (1.26 to 1.42 m) at the sites of the lowest pH rates (5.10 to 5.45). On the other hand, the highest £APL (1.42 to 1.59 m) occurred within the regions with the highest pH rates (5.45 to 5.80). Since the soil´s pH had a spatial relation with MHP and the latter with PA by Pearson´s correlation (Equation 1), there was a good performance in the limitation of two regions with different plant growth when evaluated by their heights. Whereas MHP of one region lay between 1.26 and 1.42 m, the MHP of the other region was found to be between 1.42 and 1.59 m. Therefore, the latter had the highest PA. When £APL and PA should be increased, pH may be used as a reference.
The capacity for cation exchange within Pearson´s linear correlations was the sole attribute to assess achene productivity. However, since the soil´s pH has a direct spatial relation with £APL and the later with PA, it provided a better performance in the limitation of regions with distinct growth and production potentials of sunflower plants. Soil conservation managements raise organic matter rates which, in their turn, comprise directly and positively cation exchange capacity, are required to obtain the highest production of sunflower achenes since they are closely related to plant height and achene mass.
The authors have not declared any conflict of interest.
The authors would like to thank the Instituto Federal de Mato Grosso (Campo Novo do Parecis), the Research Group Phytotechnicity and the Centro Nacional de Desenvolvimento Científico e Tecnológico (CNPq - Process 402022 / 2014-9) for supporting the current research.
REFERENCES
Amorim EP, Ramos NP, Ungaro MRG, Kiihl TAM (2008). Correlações e análise de trilha em girassol. Bragantia 67:307-316.
Crossref |
|
|
|
CONAB (Companhia Nacional de Abastecimento) (2014). Acompanhamento da safra brasileira: grãos - quarto levantamento, janeiro 2014. Brasília, DF: Conab, P. 67. |
|
|
Carvalho MP, Mendonça VZ, Pereira FCBL, Arf MV, Kappes C, Dalchiavon FC (2012). Produtividade de madeira do eucalipto correlacionada com atributos do solo visando ao mapeamento de zonas específicas de manejo. Ciênc. Rural 42:1797-1803.
Crossref |
|
|
|
Dalchiavon FC, Carvalho MP, Andreotti M, Montanari R (2012). Variabilidade espacial de atributos da fertilidade de um Latossolo Vermelho Distroférrico sob Sistema Plantio Direto. Rev. Ciênc. Agron. 43:453-461. |
|
|
|
Dalchiavon FC, Carvalho MP (2012). Correlação linear e espacial dos componentes de produção e produtividade da soja. Semina: Ciênc. Agrár. 33:541-552. |
|
|
Dalchiavon FC, Carvalho MP, Montanari R, Andreotti M (2013a). Sugarcane productivity correlated with physical-chemical attributes to create soil management zone. Rev. Ceres 60:706-714.
Crossref |
|
|
Dalchiavon FC, Carvalho MP, Montanari R, Andreotti M (2013b). Strategy of specification of management areas: Rice grain yield as related to soil fertility. Rev. Bras. Ciênc. Solo 37:45-54.
Crossref |
|
|
Dalchiavon FC, Carvalho MP, Montanari R, Andreotti M, Dal Bem EA (2013c). Sugarcane trash management assessed by the interaction of yield with soil properties. Rev. Bras. Ciênc. 37:1709-1719.
Crossref |
|
|
Dalchiavon FC, Carvalho MP, Freddi OS, Andreotti M, Montanari R (2011). Variabilidade espacial da produtividade do feijoeiro correlacionada com atributos químicos de um Latossolo Vermelho Distroférrico sob sistema de semeadura direta. Bragantia 70:1-9.
Crossref |
|
|
|
EMBRAPA (Empresa Brasileira de Pesquisa Agropecuária) (2011). Embrapa Soja. Informes da avaliação de genótipos de girassol 2010/2011 e 2011. n. 329. Londrina: Embrapa Soja, 2011. P. 98. |
|
|
|
Höhn D, Oliveira ACB, Rosa FK, Prado FM, Zardin-Filho VA, Hammes JM, Carvalho CGP (2012). Avaliação de genótipos de girassol na safra 2011/12 em Pelotas/RS. In: Congresso de Iniciação Científica, 21, Pelotas, 2012. Anais... Pelotas: Universidade Federal de Pelotas, pp. 78-81. |
|
|
|
Leite RMVBC, Brighenti AM, Castro C. (ed.). (2005). Girassol no Brasil. Londrina: Embrapa Soja, P. 641. |
|
|
Lima CGR, Carvalho MP, Narimatsu KCP, Silva MG, Queiroz HA (2010). Atributos físico-químicos de um Latossolo do cerrado brasileiro e sua relação com características dendrométricas do eucalipto. Rev. Bras. Ciênc. 34:163-173.
Crossref |
|
|
|
Martin TN, Pavinato PS, Lorentz LH, Zielinski RP, Refatti R (2012). Spatial distribution of sunflower cultivars and the relationship between growth features. Rev. Ciênc. Agron. 43:338-345. |
|
|
|
Molin JP, Vieira Junior PA, Dourado Neto D, Faulin GDC, Mascarin L (2007). Variação espacial na produtividade de milho safrinha devido aos macronutrientes e à população de plantas. RBMS 6:309-324. |
|
|
Montanari R, Carvalho MP, Andreotti M, Dalchiavon FC, Lovera LH, Honorato MAO (2010). Aspectos da produtividade do feijão correlacionados com atributos físicos do solo sob elevado nível tecnológico de manejo. Rev. Bras. Ciênc. 34:1811-1822.
Crossref |
|
|
Montanari R, Carvalho MP, Silva Junior CA, Silva Junior CA, Corrêa AR, Dalchiavon FC, González AP (2013a). Relations between the yield of bean (Phaseolus vulgaris L.) and chemical attributes of an Acrustox under no-tillage. J. Soil Sci. Plant Nutr. 13:367-379.
Crossref |
|
|
Montanari R, Lima ES, Lovera LH, Godoy LTR, Henrique AF, Dalchiavon FC (2013b). Correlación de La productividad de um forraje com lãs propiedades físicas de um Ultisol en Aquidauana. Rev. Ceres 60:102-110.
Crossref |
|
|
|
Montanari R, Pellin DMP, Silva Junior CA, Carvalho MP, Gioia MT, Dalchiavon FC, Gonzales AP (2013c). Correlação entre produção de feijão e atributos físicos de um Latossolo em Mato Grosso do Sul. Rev. Ceres 60:772-784. |
|
|
|
Pinho RG, Borges ID, Pereira JLAR, Reis MC (2009). Marcha de absorção de macronutrientes e acúmulo de matéria seca em milho. RBMS 8:157-173. |
|
|
|
Porto WS, Carvalho CGP, Pinto RJB (2007). Adaptabilidade e estabilidade como critérios para seleção de genótipos de girassol. Pesqui. agropec. bras. 42:491-499. |
|
|
|
Raij B van, Andrade JC, Cantarella H, Quaggio JA (2001). Análise química para avaliação da fertilidade de solos tropicais. Campinas: Instituto Agronômico, P. 285. |
|
|
|
Schlotzhaver SD, Littell RC (1997). SAS System for elementary statistical analysis. 2ed. Cary, P. 905. |
|
|
|
Zobiole LHS, Castro C, Oliveira FA, Oliveira Junior A (2010). Marcha de absorção de macronutrientes pela cultura do girassol. Rev. Bras. Ciênc. Solo 34:425-433. |


