Full Length Research Paper

ABSTRACT
The research was conducted in tomato-growing lands of Lâpseki, Ezine, Bayramiç and Central districts of Çanakkale province, Turkey. The aim of the study is to check the suitability of the field for tomato farming and to produce a solution if there is a problem. Disturbed soil samples were taken from 114 points with certain coordinates, at a depth of 0 to 30 cm, and analyses were performed. In the soil samples, texture, soil reaction (pH; 1:2.5), calcium carbonate (CaCO3%), phosphorus (P; kg.ha-1), cation exchange capacity (CEC; meq.100 g-1), iron (Fe; ppm), manganese (Mn; ppm), zinc (Zn; ppm), copper (Cu; ppm) and clay (%) analyses were conducted, and characteristic maps of the region were prepared according to the results of the analyses. Based on these results, the present condition and suitability of the soils were evaluated, and simple statistics along with correlations of the analyzed parameters were examined. For the problems of the area, in low pH areas, it was deemed necessary to apply calcium carbonate (CaCO3) or calcium hydroxide [Ca(OH)2] together with physiological alkaline fertilizers. As per the high pH areas, it was necessary to apply elemental sulfur together with physiological acid fertilizers. It was also concluded that Zn application was necessary for the 43.85% of the area with Zn deficiency.
Key words: Efficiency level, nutritional status, plant nutrition, tomato.
INTRODUCTION
There is a big question about whether conventional farming practices can provide food for a world population expected to exceed 7.4 billion by 2020 (Pendey and Chandra, 2013). For this reason, it has become a necessity to increase agricultural production. The agricultural production consists of animal and plant production, while plant production is made up of fruits, vegetables, grains and industrial plants. Vegetables, particularly tomatoes, have a great significance in human nutrition and health. Tomato (Solanum lycopersicum) is an annual plant, which grows 1-3 m tall, among the Solanaceae family, native to central, south, and north America ranging from Mexico to Peru (Guntekin et al., 2009). Considering the global plant production, tomato is the third most consumed and popular vegetable following potato and sweet potato (FAOSTAT, 2018).
A total of 12750 tons of tomatoes, about 8750 tons of table tomatoes and 4000 tons of paste tomatoes, were produced in 2017 in Çanakkale, which covered 2.56% of the vegetable fields of Turkey (TSI, 2017). In addition, among the vegetables, tomatoes have taken the first place with 12,750,000 tons of production in 2017 year (TSI, 2017). Therefore, tomato is the most important vegetable of the research area (TSI, 2017). Popularity of tomato depends on its chemical content as 93-95% of a tomato is composed of water, and 5-7% composed of inorganic compounds, organic acids (citric and malic acid), alcohol-insoluble proteins, cellulose, pectin, polysaccharides, carotenoids and lipids (Petro-Turza, 1987). It is an important source for human nutrition since it contains potassium, organic acids, and vitamins A and C at high levels (Moreno et al., 2008).
Efficiency is required for a qualified agriculture and quality products. This is only possible with proper fertilization together with other applications. In the ideal soils for tomatoes; pH: 6.0 - 6.5; texture: composed of combination of sand-loam or sand-loam-clay; lime: <5%; CEC: 15-20 meq.100 g-1; P: > 90 kg.ha-1; exchangeable Zn: 1-2 ppm; Fe: 2.5-4.5 ppm; Mn: < 10 ppm; Cu: > 0.2 ppm and the clay should be <35% (Kacar, 2012). On the other hand, soil fertility varies in different places (Mandal et al., 2015). Therefore, nutrients and microorganisms in the soil play an important role in improving soil quality (Sun et al., 2011). Farmers may excessively use inorganic and organic fertilizers and pesticides in order to harvest good yield. Particularly, the continuous use of chemical fertilizers increases the concentration of heavy metal in the soil (Arya and Roy, 2011).
The aim was to ensure controlled chemicals needed to protect the environment and to grow quality products. Determining the character of the soil is the first step in this process. Therefore, this research study was carried out to determine the soil character of the study area, and to suggest a solution if there was a problem.
METHODOLOGY
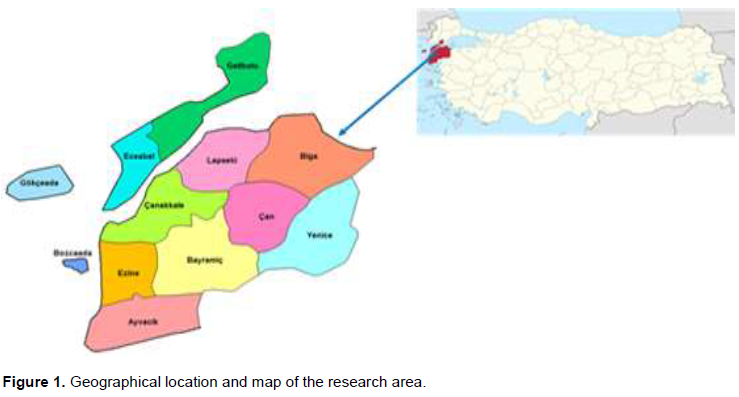
The research was conducted in Lâpseki, Ezine, Bayramiç and central districts of Çanakkale province. Çanakkale is a neighbor to Edirne and TekirdaÄŸ provinces on the European side of Turkey, while it only neighbors Balıkesir on the Anatolian side. The city is located between longitudes 25°40'- 27°30' East and latitudes 39°27'- 40° 45' North (Figure 1). The large part of its territory is on the Anatolian side and its coastal length is 671 km (TSI, 2017). Mediterranean climate largely prevails in Çanakkale. However, because it is located in the north-west, it is colder in the winter compared to the Mediterranean climate. The lowest temperature falls to 6.4°C in February, while the highest temperature is about 41.7°C in August. Çanakkale has an average annual temperature of 15.2°C and an average humidity of 72.6%. There are more winds in Çanakkale than its neighboring provinces. In the winter season, there are very little snow falls and even if it snows, it stands on the ground up to one week. Rainfalls mostly occur during December, November, January and February (TSI, 2017). Climate is also very suitable for vegetable farming. Çanakkale province has a total area of 9933 km2, 55% of which is comprised of forests. The remaining land consists of arable lands, meadows, and pastures. Just like in the climate, the vegetation is Mediterranean vegetation (TSI, 2017).
In this research, the coordinates of 114 locations to be studied were initially identified on the maps (1/100000) of the region. Locations of the identified points were found by GPS and marked. Mixed soil samples were taken from the 114 points at a depth of 0 to 30 cm (Kacar, 2012).
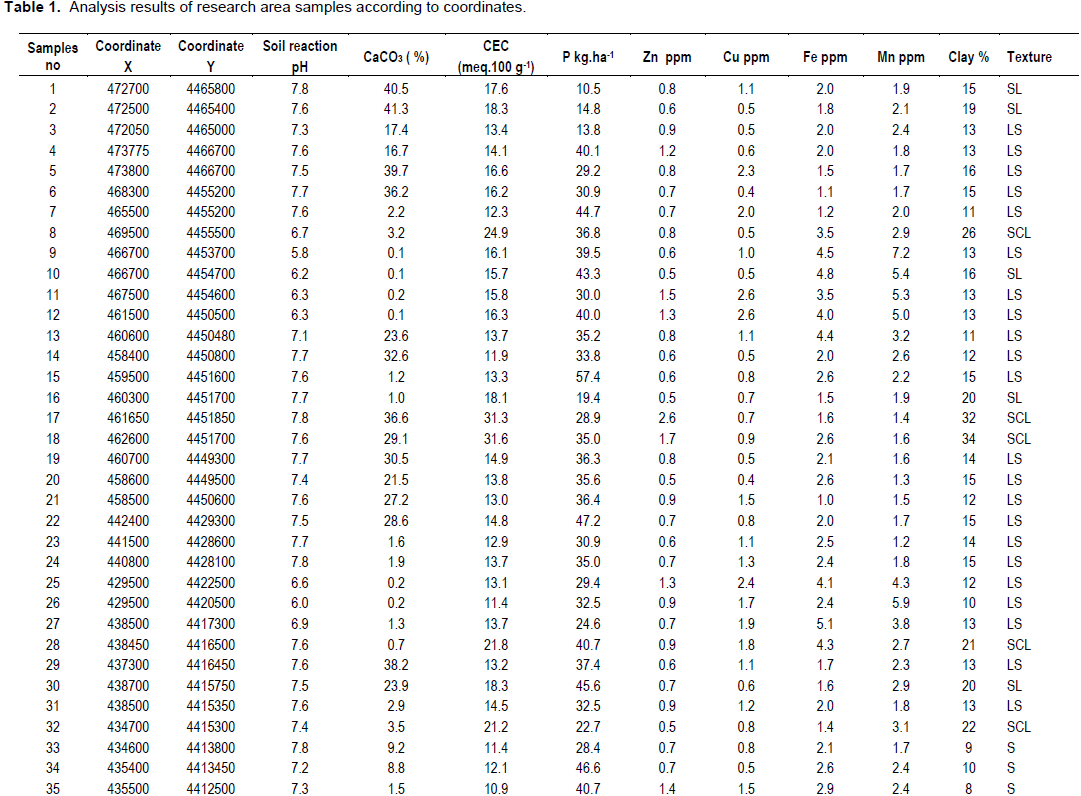
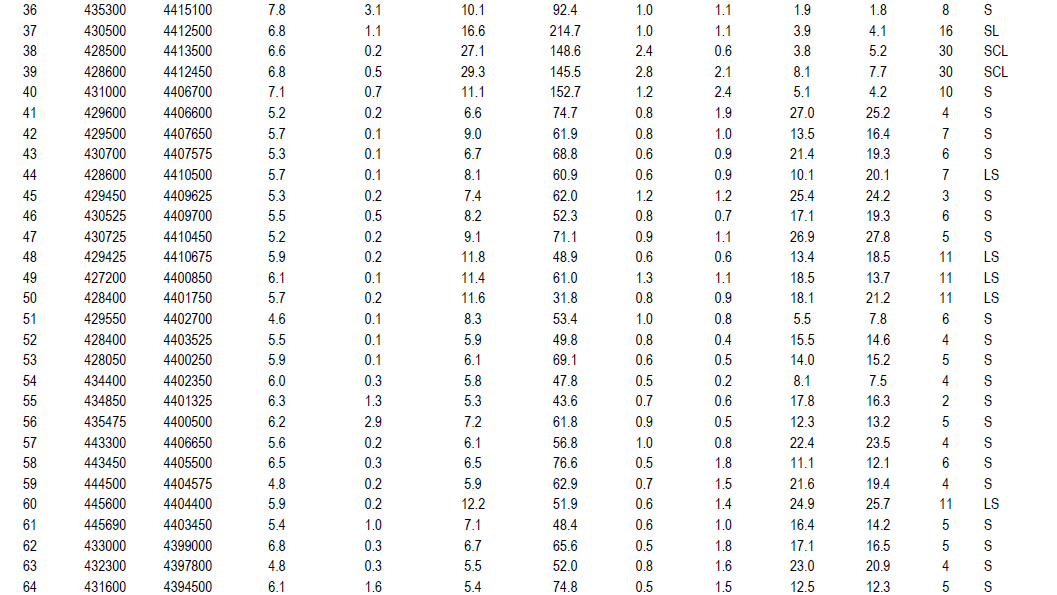
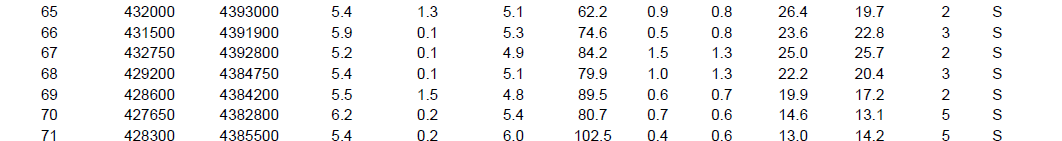
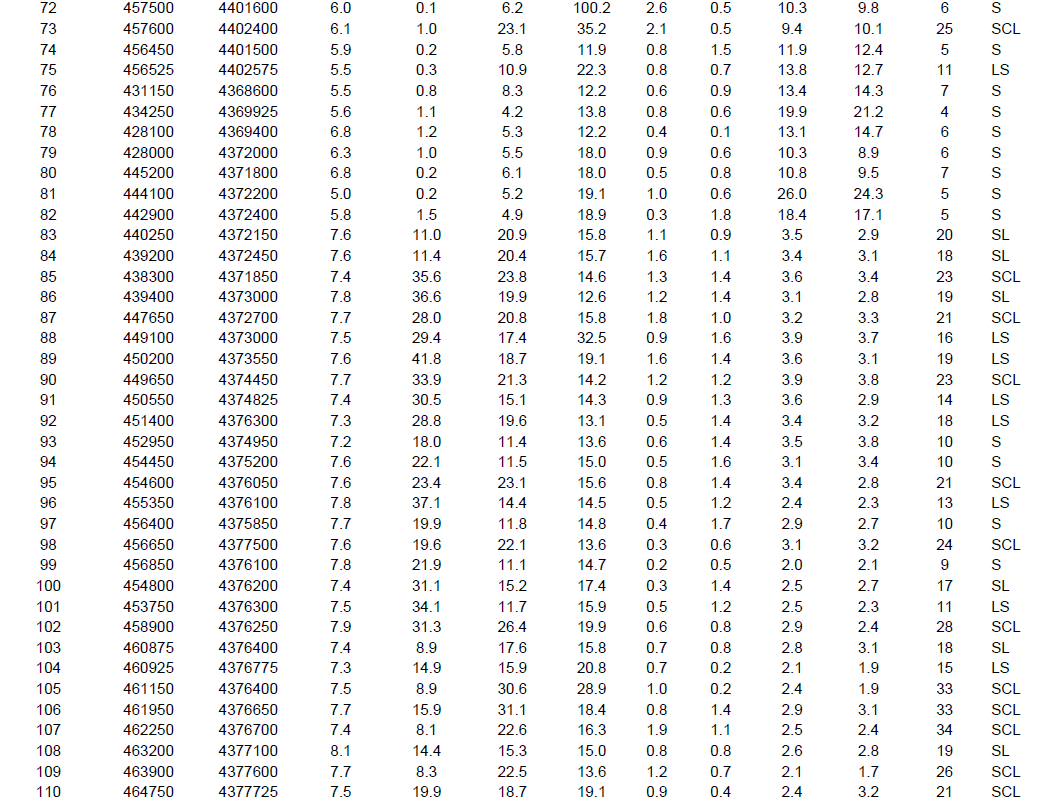
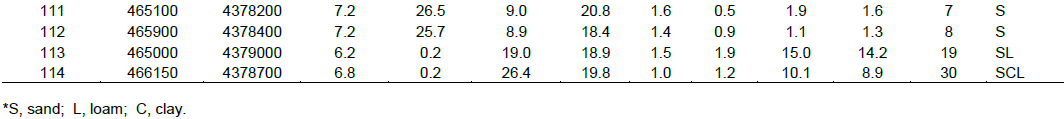
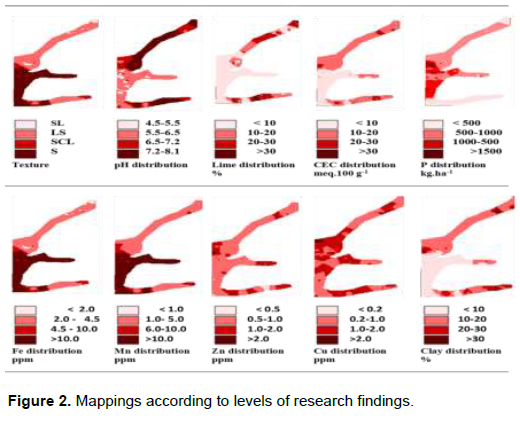
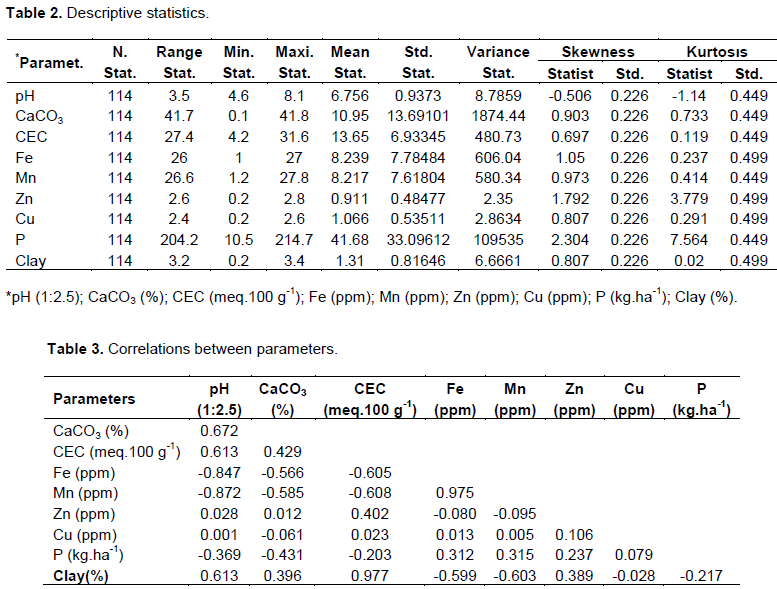
After gathering, soil samples were sent to the laboratory for then air-drying. Stones, plants and animal remains were picked out. These samples were then milled and sieved with a 10-mesh sieve (Kacar, 2012). Subsequently, they were analyzed. In the soil samples, texture and clay percentage were detected by the hydrometer method (Bouyoucos, 1962); soil pH was determined by using 1:2.5 soil-water suspension method (Jackson, 1973); % CaCO3 was obtained by the Scheibler Calcimeter (Kacar, 2012); available phosphorous by Olsen et al. (1954) method and DTPA extractable Zn, Fe, Mn and Cu were determined with the standard method given by Lindsay and Norvell (1978). The results of the analysis of soil samples belonging to the research area were given collectively in Table 1. In addition, the productivity maps and graphs of the research area were separately drawn according to the results (Figures 2 and 3). Correlations between the obtained parameter values (Table 2) and descriptive statistics (Table 3) were investigated with MSTAT statistic program (Akdemir et al., 1994).
RESULTS AND DISCUSSION
Four different soil textures were identified in the research area (Table 1 and Figure 2). Of the soil, 42.9% was identified as sandy, 29.8% as loamy-sand, 11.6% as sandy-loam and 11.6% as sandy-clay-loam (Bouyoucos, 1962). According to the analyses, 84.3% of the area is composed of sand and sand-loam mixture (Table 1 and Figure 2). Texture, which does not easily change, is an important physical property that affects the land character the most. This property is directly related to water, air and heat, and it significantly affects the nutrient reserve (Brady and Weil, 2008). A texture consisting of sand-loam or sand-loam-clay combinations is suitable for vegetable agriculture; thus, there is no problem for tomato in this respect (GüneÅŸ et al., 2013).
In the research, the pH value was determined to be varying between 4.6 and 8.1, and the average was found to be 6.7 (Table 2). The pH value was determined lower than 5.5 for 12.2%, higher than 6.5 for 58.7% and between 5.5 and 6.5 for 29.1% (Table 1, Figures 2 and 3). In this range, there would be no problem in retrieving macro and micro elements. Soil pH is one of the most important factors in the relationship between soil chemistry and nutrients, and in the intake of elements (GüneÅŸ et al., 2013).
The ideal soil pH should be between 6.0-6.5. If pH is higher than 6.5, the plant's intake of metallic micro nutrients (Fe, Zn, Mn, Cu) and boron (B) becomes more difficult and it decreases. However, if the pH is lower than 5.5, the phosphorus (P) and molybdenum (Mo) cannot be taken by the plant (Kacar and Katkat, 2010). When Table 3 was examined, a statistically insignificant negative correlation was observed between pH and Fe, Mn, and P. In the areas with the pH above 6.5, 1000-2000 kg ha-1 elemental sülfür should be used, and the fertilizers should be chosen in physiological acidic character. On the other hand, in areas with the pH value below 6.5, 1000-2000 kg ha-1 CaCO3 or Ca(OH)2 and fertilizers in physiological alkaline character should be used (Kacar and Katkat, 2010). When Table 3 was examined, a statistically insignificant negative correlation was observed between pH with Fe, Mn, and P. In the areas with the pH value above 6.5, 1000-2000 kg ha-1 elemental sülfür and the fertilizers in physiological acidic character should be used. On the other hand, in areas with the pH value below 6.5, 1000-2000 kg ha-1 CaCO3 or Ca(OH)2 and fertilizers in physiological alkaline character should be used (Kacar and Katkat, 2010).
The lime [Calcium Carbonate (CaCO3%)] in the study, ranged from 0.1 to 41.8%, while its average was detected as 10.95% (Table 2). In an ideal soil, the lime content should not exceed 5% (Brady and Weil, 2008; Kacar and Katkat, 2010). However, there is no problem at the level of lime up to 15%. In 33.33% of the study area, lime has exceeded 15% (Table 1, Figures 2 and 3). Except for the 33.33%, the research area does not have a problem concerning the lime under the conditions that correct feeding and pH control is conducted. Phosphorus is bound at 33.33% of the research area. In addition, Zn, Fe and Mn are taken at low levels (GüneÅŸ et al., 2013). The negative relationship between lime and P, Fe, Mn, and Cu (Table 2) can be explained by the high lime content of the soils in the region (GüneÅŸ et al., 2013).
Moreover, a proportional formation was observed between lime and pH. It was suggested to use sulfur and organic acid for problematic soils (for 33.33%) in the research area (GüneÅŸ et al., 2013).
Cation Exchange Capacity [CEC (meq.100 g-1)] varied from 4.2 to 31.6 in the research, and the average was determined as 13.65 meq.100 g-1 (Table 2). In 33.33% (sand) of the research area, CEC was found to be lower than 10 meq.100 g-1; in 29.84% (loamy-sand), it was detected as 10-15 meq.100 g-1; in 19.29% (sandy-loam), it was determined as 15-20 meq.100 g-1; whereas in 17.54% (sandy-loamy-clay), it was higher than 20 meq.100 g-1. CEC increased as the clay rate increased in the soils (Table 1). Rathore et al. (2017) have found similar results. According to the results of the analysis, it was found that 33.33% of the research area was inadequate (< 10 meq.100 g-1), 49.13% was adequate (10-20 meq.100 g-1) and 17.54% was high (>20 meq.100 g-1) (Table 1, Figures 2 and 3). In the soil, where CEC is low, applying compost (20 ton ha-1) or leonardite (20-30 ton ha-1), which are the sources of organic matter will be very useful. Additionally, though not statistically significant, a negative relationship between CEC and Fe, Mn, P, a positive low relationship between CEC and Zn, Cu, and a positive high relationship between CEC and clay were determined, respectively (Table 3) (Kacar and Katkat, 2010).
Phosphorus (P) content of soil samples ranges from 105.0 to 2147.0 kg.ha-1, with an average of 416.8 kg ha-1 (Table 2, Figures 2 and 3). According to Kacar (2012), phosphorus level determined in the research area was found to be sufficient (P ≥ 90 kg ha-1) (GüneÅŸ et al., 2013). This is because of the suppression of the lime and pH factor, which inhibits phosphorus intake (GüneÅŸ et al., 2013). It can be explained by the accumulation of dicalcium phosphate or tricalcium phosphate with the repetitive application of phosphorus in each production year (Kacar and Katkat, 2010; GüneÅŸ et al., 2013). In addition, although not statistically significant, a negative correlation was detected between CEC and Fe, Mn, P, a positive low correlation between CEC and Zn, Cu, and a high correlation between CEC and clay (Table 3). It is necessary to increase the solubility of the Phosphorus. For this purpose, sülfür, leonardite, organic acids or chemical acids should be applied (Kacar and Katkat, 2010). Iron (Fe) varied from 1-27 ppm in the research area, with an average of 8.239 ppm(Table 2, Figures 2 and 3). It was determined to be at low levels (Fe ≤ 2.5) in 28.9% of the samples, at adequate levels (2.5-4.5) in 28.9%, and at high levels (Fe ˃4.5) in 42.2% (Table 1) (Eyupoglu et al., 1996). The usefulness of iron in calcareous soils is reduced by the concentration of HCO3-1 (Bloom and Inskeep, 1988). In addition, the effect of high pH is more conspicuous. Due to high pH (pH>6.5), Fe cannot be received at 58% of the soils (Table 1) (Kalbasi et al., 1988; Kacar and Katkat, 2010). In 33.33% of the soils, in which lime (CaCO3 ˃ 15%) is high, it will not be possible to intake the iron. In return, the tomato highly reacts to iron deficiency. Therefore, iron deficiency should be observed in those areas, and fertilization should be done through the leaf. On the other hand, although statistically not significant, there exists a negative relationship between Fe and Zn, as well as % clay content (Table 3). The solution is to lower the pH level (Kacar, 2012; GüneÅŸ et al., 2013).
Manganese (Mn) varied from 1.2 to 27.8 ppm, with an average of 8.2 ppm (Table 2; Figures 2 and 3). In addition, a statistically non-significant negative relationship between Mn and Zn, along with clay % was determined (Table 3). While useful manganese increased at a lower pH level, it decreased at higher pH levels (Table 1; Figure 3). Mn level was found to be sufficient (< 10 ppm) in 66.67% of the samples, high (10-20 ppm) in 21.93% and very high (> 20 ppm) in 11.40% in research (Table 1) (Kacar, 2012; GüneÅŸ et al., 2013). In 65% of the soils in Turkey, Mn varies between 15-50 ppm (EyupoÄŸlu et al., 1996).
According to the results, Mn level is considered sufficient (Martens and Westermann, 1991). 31.57% of the research soil is calcareous alkaline, and 30.70% is sandy-acidic. However, in the lime-alkaline soil (pH˃7; CaCO3 ˃ 15%) Mn is difficult to absorb, because the formed manganese oxide (MnO) and manganese hydroxides [Mn(OH)2] prevent absorption (McKenzie, 1989). In sandy acidic soil, Mn undergoes a washing process due to the lack of bonding surface despite high solubility, and it cannot be taken at sufficient levels. Therefore, there may be Mn deficiency in plants grown in sandy-acidic soils and in calcareous-alkaline soils (Kacar and Katkat, 2010). Furthermore, high phosphorus has a negative effect on Mn intake and its transport in plants (Taban et al., 1995; Kacar and Katkat, 2010). As a result, in 62.70% of the soils of the research area, high phosphorus (P), pH and lime conditions should be taken into account and the pH must be adjusted (Karaman et al., 2012).
Zinc (Zn) varied from 0.2 to 2.8 ppm in the research area, with an average value of 0.9 ppm (Table 2, Figures 2 and 3). There was no statistically significant relationship between Zn and other parameters (Table 3). According to these values, it was determined to be at sufficient and high levels in 23.68% of research area soils, and at low and very low levels in 76.32% of the soils (Table 1; Figures 2 and 3) (Kaplan et al., 1997; Kacar and Katkat, 2010; Karaman et al., 2012). Marschner (1991) stated that the amount of exchangeable zinc varied between 0.1 and 2.0 ppm depending on soil properties (Hacısalihooğlu et al., 2004).
This information confirms the results of the research. There is a difference between plants in terms of zinc intake. For example, tomatoes receive only 30% of the given zinc. Due to its being at low soil temperature, high pH and high phosphorus contents also reduce Zn intake (HacısalihooÄŸlu et al., 2004). As soil pH increases, variable Zn decreases (Kacar and Katkat, 2010). The information provided confirms the research findings. Therefore, while applying Zn in the research area, phosphorus and pH must be taken into consideration, and the pH must be absolutely calibrated (GüneÅŸ et al., 2013).
Zinc should be given as needed. In fact, it should be applied through the leaf, especially in areas where pH is high. Because of the high pH and high calcareous conditions; its solubility decreases and it cannot be taken by forming compounds such as zinc carbonate (ZnCO3) and zinc hydroxide [Zn(OH)2] with carbonates (Karaman et al., 2012).
Copper (Cu) was varied between 0.1 and 2.6 ppm in the samples, and the mean value was determined to be 1.06 ppm (Table 2, Figures 2 and 3). Cu was found to be at inadequate levels (≤0.2) in 3.5%, and adequate levels in 96.5% of the research area (Table 1) (EyupoÄŸlu et al., 1996; Karaman et al., 2012). This depends on the copper-based pesticides used. Kochian (1991) reported that 98% of Cu in the soil solution forms a complex with organic compounds and therefore it is immobilized (Kacar and Katkat, 2010). In addition, Haldar and Mandal (1981) reported that Zn++ and Cu++, which are present in excessive amounts in the soil, adversely affect their intake by plants (Kacar and Katkat, 2010). No application proposal was needed because it was found to be sufficient in almost all soil samples (HacısalihooÄŸlu et al., 2004).
In the survey, clay was detected only in 20 samples (clay: 20-35%) (Figures 2 and 3). These fields are defined as SCL (GüneÅŸ et al., 2013). No clay-textures (clay >35%) were detected in any of the other units. In this respect, the research area was determined to be suitable for tomato production (Brady and Weil, 2008).
CONCLUSION
The main problem in the research area is that there may be problems related to the intake of P, Zn, Mn and Fe depending on the level of pH and lime. According to the research results, texture containing sand, loam and clay combinations except for 100% clay are suitable for tomatoes. Whereas at pH 6.5 and above 10% of lime; 1-2 ton.ha-1 of elemental powder sulfur or organic acids should be used and where pH is below 6.0, CaCO3 or Ca(OH)2 should be used depending on the pH level. Thus, the pH will be calibrated and antagonistic relationship between P, Zn, Mn and Fe will be prevented. Especially where the lime is above 10%, application of P is given locally without mixing to the soil, while Zn, Mn and Fe should be fed to the plants from the leaves.
CEC was under 15 meq.100 g-1 in 63.17% of the research areas. For these areas, 20-30 tons.ha-1 leonardite should be used to increase the CEC values.
Cu, Mn and Fe was enough with higher percentages (96.5, 88.6 and 71.1%) of the soil samples, respectively. Zn was found to be low and very low in 76.3% of the samples. Because there is a more important antagonistic relationship between the Zn with pH, % CaCO3 and P, Zn is found to be low; so the application must be made from the leaves.
Higher Mn is related to rich mangan soils of Turkey, while higher Cu is related to the copper element in the compositions of pesticides. The state of Fe also depends on high iron application.
Therefore, when Cu and Mn are not given, Fe should be applied to the leaf.
If the recommendations are followed, the pH and CEC in the research area will be adjusted and P and Zn intake will be easier. In addition, the nutrition problem of tomatoes will be eliminated and the yield will be increased.
CONFLICT OF INTERESTS
The author has not declared any conflict of interests.
REFERENCES
|
Akdemir B, Kayişoğlu B, Kavdır I (1994). MSTAT Statistical package program usage book. Trakya University of Tekirdag Agricultural Faculty, Publication No: 203:189. |
|
|
Arya K, Roy K (2009). Manganese induced changes in growth chorophyll contet and antioxidants activity in seedlings of broad bean (Vici faba L.). Journal Environment Biology 32:707-711. |
|
|
Bloom PR, Inskeep WP (1988). Factors affecting bicarbonate chemistry and iron chlorosis in soils. Journal Plant Nutrition 9:215-228. |
|
|
Bouyoucos GJ (1962). Hydrometer Method Improved For Making Particle Size Analysis Of Soil, Agronomy Journal 54(5). |
|
|
Brady NC, Weil RR (2008). The natüre and prospertiesof soils. 14th ed., Upper Saddle River, NJ. pp. 9990,ISBN 13-978-0-13-227938-3,prenice Hall. |
|
|
EyüpoÄŸlu F, Kurucu N, Talaz S (1996). A plant of Turkey's land some microelements plant-available (Fe, Cu, Zn, Mn). S. 1-72. Soil Fertilizer Research Institute general publication no. 127, serial no. R-133, Ankara. |
|
|
FAOSTAT (2018). Food and Agriculture Organization Statistics, data 2002, |
|
|
Guntekin E, Uner B, KarakuÅŸ B (2009). Chemical composition of tomato (Solanum lycopersicum) stalk and suitability in the particleboard production. Journal Environment Biology 30(5):731-734. |
|
|
GüneÅŸ A, Alpaslan M, Inal A (2013). Plant Nutrition and Fertilization, Ankara University Faculty of Agriculture, Publication no: 1581:579. |
|
|
HacısalihoÄŸlu G, Öztürk L, Çakmak I, Welch RM, Kochıan L (2004). Genotypic variation in common been in response to zinc deficiency in calcareous soil. Plant and soil 259:71-83. |
|
|
Haldar M, Mandal LN (1981). Effect of P and Zn on the growth and P, Zn, Cu Fe and Mn nutrition of rice. Plant and Soil 59:415-420. |
|
|
Jackson ML (1973). Soil Chemical Analysis. Prentice Hall of India Pvt. Ltd., New Delhi. |
|
|
Kacar B, Katkat AV (2010). Plant Nutrition. Nobel Publication No. 849, 5th Edition. |
|
|
Kacar B (2012). Soil Analysis. Nobel Publications, Publication no: 484, 3rd Edition, Ankara 464 p. |
|
|
Kalbasi M, Filsoof F, Rezai-Nejad Y (1983). Effect of sülfür treatments on yield and uptake of Fe, Zn and by corn, sorghum and soyabeans. Journal Plant Nutrition 11(6-11):1353-1360. |
|
|
Kaplan M, Aksoy T, Sönmez S, Orman Åž (1997). An Investigation of Zinc Nutrition Status in Greenhouse Tomato and Cucumber Cultivation in Western Mediterranean Region. 1st National Zinc Congress (Agriculture, Food and Health), 12-16 May, EskiÅŸehir pp. 167-174. |
|
|
Karaman MR, Brohi AR, Muftuoglu NM, Oztas T, Rich M (2012). Sustainable Soil efficiency, Koyulhisar Chamber of Agriculture Culture publications No: 1, 3rd Edition. |
|
|
Kocihan LV (1991). Mechanisms of micronutrient uptake and translocation in plants. In. Mictonutrients in Agriculture, SSSA Book Series (4):229-296. |
|
|
Lindsay WH, Norvell WA (1978). Development of DTPA soil test for Zn, Fe, Mn and Cu. Soil Science Society of America Journal 42:420-428. |
|
|
Martens DC, Westermann DT (1991). Fertilizer applications for correcting micronutrient deficiencies. In: Micronutrients in Agriculture (2nd Edition). SSSA Book Series, SSSA, 677 S. Segoe Rd., Madison, WI 53711. 4:549-592. |
|
|
Mandal S, Verma BC, Ramkrushna GI, Singh RK, Rajkhowa DJ (2105). Characterization of biochar obtained from weeds and its effect on soil properties of North eastern region of India. Journal Environment Biology 36:499-505. |
|
|
McKenzie RM (1989). Maganese oxide and hidroxides. P. 439-466. In: Miner-als in soil Environments. (J. B. Dixon and S. B. Weed, eds.). 2nd ed. SSSA Madison, WI. |
|
|
Marschner H (1991). Root-induced changes in the availability of micronutrients in the rihizospher. In: Plant Roots. The Hidden Half (Y. Waisel, A. Esheland K. Kafkafi eds) pp. 503-528. |
|
|
Moreno CS, Ancos B, Plaza L, Martinez PE, Cano MP (2008). Nutritional Characterization of Tomato Juices, In: Tomato and Tomato Products Nutritional, Medicinal and Therapeutic Properties. Predy, V.R. Watson, R.R. (eds), Science Publisher, 664, USA. |
|
|
Olsen RV, Cole CV, Watanable FS, Dean LA (1954). Estimation of Available Phosphorous in Soil by Extraction with Sodium Bicarbonate, U.S.D.A. Circ. 939, Washington. |
|
|
Pendey SK, Chandra KK (2013). Impact of ıntegrated nutrient management on tomato yield under farmers field conditions. Journal Environment Biology 34:1047-1051. |
|
|
Petro-Turza M (1987). Flavor of Tomato and Tomato Products. Food Review International 2(3):309-351. |
|
|
Rathore N, Gupta RK, Singh Y, Singh B (2017). Determining critical value of soil Olsen P for dry direct seeded rice (Oryaza sativa) in a greenhouse study in Northwestern India. Journal Environment Biology 38:623-629. |
|
|
Sun B, Paul D, Hallett SC, Timand JD, David WH (2011). Dustribution of soil carbon and microbial biomass in arable soils under different tillage regimes. Plant Soil 338:17-25. |
|
|
Taban S, Alpaslan M, Turan C (1995). Effect of phosphorus and manganese lentil plant growth on phosphorus and manganese scales in increasing quantities. Tropical. Journal of Agriculture and Fosrestry 19:39-43. |
|
|
Turkey Statistical Institute (TSI) (2017). Crop production statistics, data vegetables (tomatoes), |
|
Copyright © 2024 Author(s) retain the copyright of this article.
This article is published under the terms of the Creative Commons Attribution License 4.0


