One of the main factors affecting soybean development is water deficiency, especially when it occurs during the flowering and pods filling stages. Thus, this study aimed to evaluate the soybean development under soil water deficit in different phenological phases, under soil and climatic conditions of Bom Jesus, Piaui State, Brazil. The test was conducted at São Luiz Farm, located 3 km from Bom Jesus to PI, during the period from August to December, 2014. The test was conducted with a drip irrigation system using drip tape with 0.3 m between emitters and nominal flow of 1.6 L h to 1. The water deficit was applied in the vegetative development stages (treatment I), flowering and grains filling (treatment II) and grain maturation (treatment III), compared to the control treatment (full irrigation throughout the cycle). Plant height, number of green leaves, leaf area index and plant dry matter were evaluated. The water deficit in the flowering and pod filling stages inhibited the BRS Sambaíba RR cultivar growth, contributing to a reduction of up to 33.2, 34.7, 41.3 and 13.7% of plant height, number of leaves, leaf area index and total dry mass, respectively compared to the control.
Soybean is the Brazilian crop with the highest increase in planted area during the last three decades and corresponds to 49% of the area planted with grains in the country. From the 1970s, the crop became the most important in the Brazilian agribusiness, expanding its production to occupy the ‘Cerrado’ lands. Currently, the State of Piauí presents a great potential for grain production, mainly soy. During the 2015/2016 harvest season, the area planted with soybean in Piauí reached a level of 564,118 ha, with an average yield of 2099 kg ha-1 (CONAB, 2016). The municipalities of Baixa Grande do Ribeiro, Uruçuí, Ribeiro Gonçalves, Santa Filomena, Bom Jesus, Currais, Gilbués, Monte Alegre do Piauí, Sebastião Leal, Palmeira do Piauí and Corrente, stand out as the most soy producing municipalities in the southwest of the Piaui State (IBGE, 2015). One of the main factors that affect the development of the crop is the soil water deficiency. The phenological phase of the crop in which the water deficit occurs leads to different morphophysiological changes. The existence of water deficit throughout the beginning of the grains filling and the beginning of the stage of green grains can drastically reduce the soybean yield, because almost half of the nutrients required for the pods filling come from the soil and the biological fixation of nitrogen (Nunes, 2016).Tavares et al. (2013) observed that the water deficit during the soybean vegetative period does not affect the first pod height, number of nodes of the main stem, number of pods with one and two seeds and the seeds yield per plant. However, it reduced plant height, stem diameter and number of pods with three seeds. The water deficit caused a reduction in the plant leaf area of 30% in stage R4 (vegetative development) and 35% in stage R6 (pod filling).Knowledge of the water restriction interactions with soybean development stages is important for the establishment of adequate management strategies, since at various stages of crop development morphological and physiological events are responsible for the definition of the production potential. The present paper aimed to evaluate the development of soybean under soil water deficit during under the soil and climatic conditions of Bom Jesus, Piaui State, Brazil.
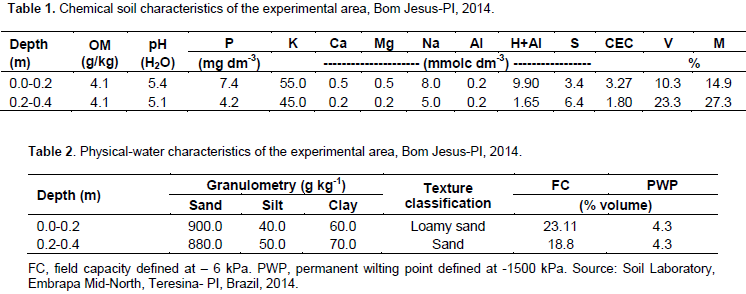
The experiment was conducted at the site Luiz, located 3 km from the City of Bom Jesus to PI, in the ‘Cerrado’ of the southwestern region of the Piaui State, during the period from August to December, 2014 at the following geographical coordinates, obtained using GPS: 9º05'20,4 '' S, 44º20'55,1 '' W and 283 m of altitude. The annual average rainfall of the region is defined by the continental equatorial regime, with annual rainfall from 700 to 1,300 mm and the rainy season extending from November to April, with the months of January, February and March being the most humid period (Silva et al., 2013). The soil of the area is classified as Fluvic Neosol (EMBRAPA, 2013), whose chemical and physical to hydro characteristics are presented in Tables 1 and 2, respectively. The preparation of the experimental area consisted of plowing and narrowing. The soil liming was applied 30 days before planting, with 1 t ha-1 of filer limestone, followed by incorporation to the soil using a harrow. Soil fertility and cover fertilization were performed based on previous soil fertility analysis of the experimental area (Table 1) and following the nutritional requirements for soybean (EMBRAPA, 2011). The base fertilization consisted of the application of 20 kg ha-1 of N, 100 kg ha-1 of P2O5 and 30 kg ha-1 of K2O, being 30 kg ha-1 of K2O applied as cover at 30 days after germination.The soil water retention curve was determined according to the method described by Embrapa (1997) and adjusted according to the model proposed by van Genuchten (1980), with the aid of the Soil Water Retention Curve (SWPC) version 3.0 (Dourado Neto et al., 2001).
The cultivar BRS Sambaíba RR was evaluated due to its excellent adaptation to different environments. Seeding was performed on August, 15th 2014, manually, at a spacing of 0.5 m between rows, obtaining 13 plants per linear meter. The experiment was kept free of weeds by 3 manual controls and one glyphosate application. The phytosanitary treatment was carried out through two applications of the Engeo Pleno (Thiametoxan + Lambda to cyhalothrin + Inert Ingredients) insecticide at 20 and 75 DAS. The test was conducted with a drip irrigation system, using drip tape, with emitter spacing of 0.3 m, with nominal flow of 1.6 L h-1, whose control of the passage of water through the water pipe administered to the plots was performed by a ½ to inch log and a pressure controller installed at the beginning of each plot. Each plot presented a total area of ​​33 m2, consisting of 11 rows of 6 m in length, spaced 0.5 m between rows and 78 plants per row. The first and last rows were considered as borders. The experiment was structured in randomized blocks, in plots subdivided in time with 6 repetitions. The plots consisted of soil water deficit in different phenological stages of the crop [T1: imposition of water deficit in the vegetative development stage (23 - 48 days after sowing - DAS), T2: imposition of water deficit in the flowering stage and pods filling (49 to 89 DAS), T3: imposition of water deficit during the pods maturation stage (90 to 120 DAS) and T4: without soil water deficiency, which means full irrigation in all development stages].
The subplots were represented by 11 plant samples collected during the growing cycle. The application of soil water deficit at each stage of soybean development was based on the 50% replacement of ETc which occurred between 2 consecutive irrigations, so that the soil moisture remained always below the critical depletion (p = 0.50). At the end of the water deficitapplication in each phonological stage, the full irrigation was resumed, completing 100% of the ETc replacement in other development stages. The control of the applied water was realized using hydrometers installed at the beginning of each experimental block. Irrigation management was carried out using crop evapotranspiration (ETc) estimated based on the reference evapotranspiration (ETo) and on soybean cultivation coefficients (Kc) recommended by FAO (Allen et al., 1998). The daily values ​​of ETo were estimated using the Penman to Monteith method, using climatic data obtained from the INMET automatic meteorological station, installed at the Federal University of Piauí to Campus Professor Cinobelina Elvas, Bom Jesus, PI, Brazil. Monitoring of soil water content was carried out by the gravimetric method, where soil samples were collected at depths of 0 - 0.2 m and from 0.2 - 0.4 m. The samples were collected 30 min before the beginning and 30 min after the irrigation was finished, as a way of assessing the values ​​of soil water content imposed by the application of full and deficit irrigation.
With this monitoring, it was possible to know the conditions of the soil water availability, both in terms of volumetric moisture and in terms of soil water potential, in which the crop was submitted, with the application of water deficit treatments. The measured variables were: a) mean height of first pod insertion (MHFP), measured from the soil surface to the insertion of the first pod; b) number of green leaves per plant (NGP), obtained by counting all green leaves in 3 plants of the useful plot; c) leaf area index (LAI): the leaves of the plants were manually removed from the stem and then taken to an electronic meter of area LI to 3100, to determine the leaf area (cm²) and then multiplied by the number of plants in a linear meter and (d) total dry matter (TDM): after measuring the leaf area, the leaves and stems of the plant were packed in paper bags and put to drying in an air forced oven at 65°C until reaching constant weight and then weighed, in an analytical scale, with an accuracy of 0.001 g. These measurements were carried out weekly, totaling 11 samplings during the growing cycle. The variance analysis was performed, applying the "F" test using the software Assistat version 7.6 (Silva and Azevedo, 2009).
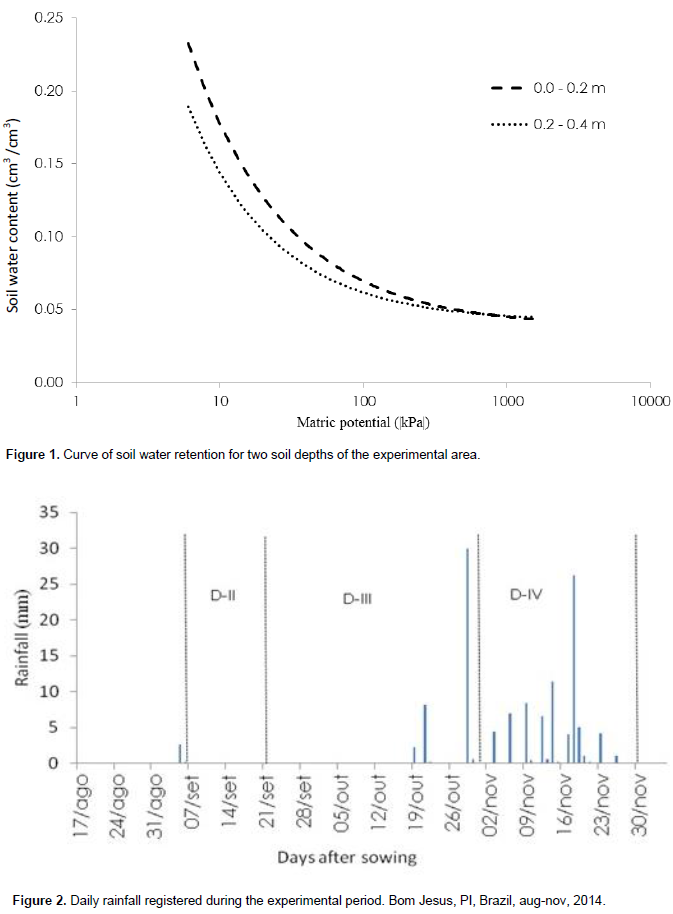
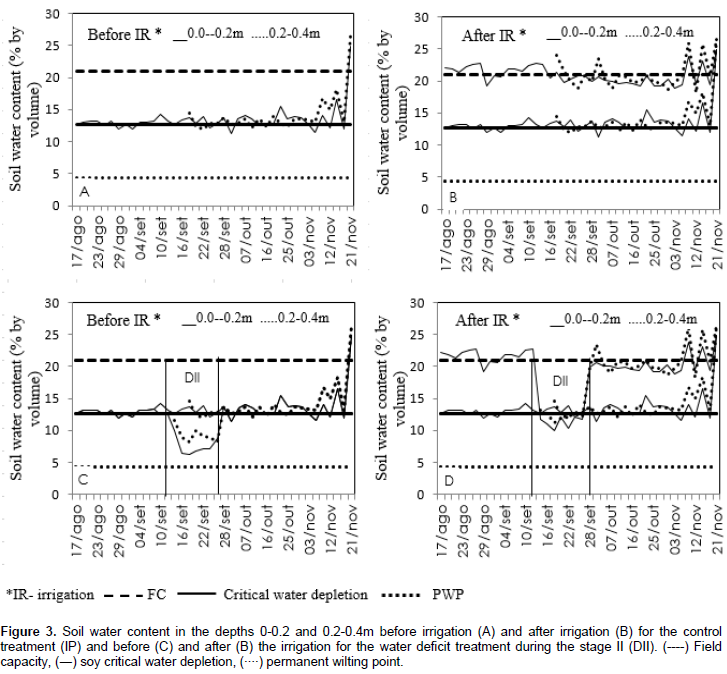
During the experiment, the accumulated rainfall was 124.6 mm, in which 80.6 mm were registered during pod maturation, only compromising the water deficit management during stage IV (Figure 2). The soil water content presented a clear variation according to water deficiency treatments, before and after irrigation, in the 2 layers of the soil, reflecting the availability of different water during water deficit imposition, as well as the extraction of soil water by the plant roots (Figures 3 and 4). The water content of the soil under full irrigation (PI) before irrigation ranged from 13.44% (in the 0 - 0.2 m depth) to 14.07% (in the 0.2 - 0.4 m depth); it always fluctuated near the critical water depletion for soybean (12.7%). After irrigation, the water content approached the field capacity, with soil moisture oscillating around 20.94% (at 0.0 - 0.2 m depth) to 21.07% (at the depth of 0.2 - 0.4 m), corresponding to 62.81 and 63.19% of the available water capacity (AWC) in the soil before irrigation, and 90.61 and 100.47% of the AWC after irrigation (Figure 3A and B). Regarding the water content, it achieved 7.45% (0.0 - 0.2 m) and 9.28% (0.2 - 0.4 m) before irrigation for the treatment DII; always below the critical water depletion for soybean (12.7%). After irrigation the water content continued below the critical water depletion, 11.28% (0.0 - 0.2 m) and 12.23% (0.2 - 0.4 m), ​​corresponding to 35.53 and 44.25% of the available water capacity in the soil before irrigation and 53.79 and 58.32% of the AWC after irrigation (Figure 3C and 3D).
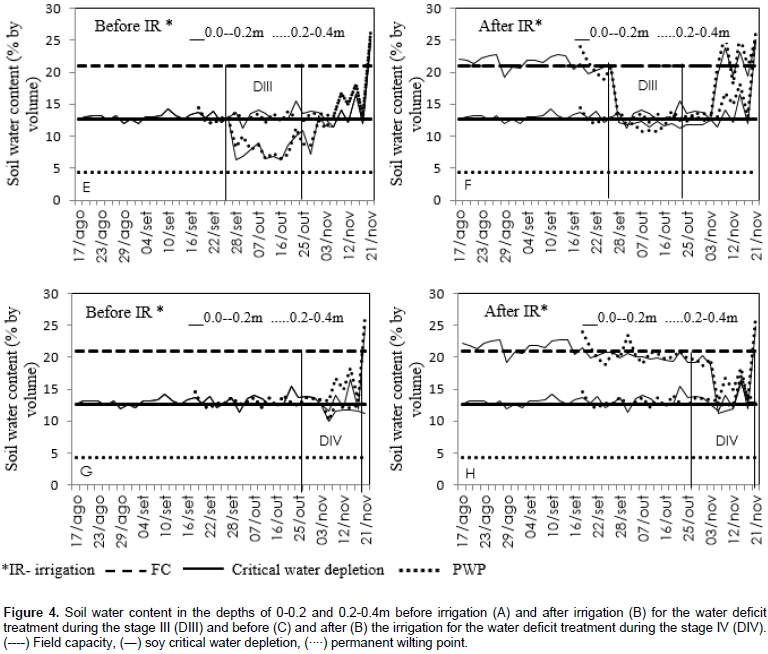
The water content in the treatment DIII was very similar to the DII treatment, ranging from 8.51% (0.0 - 0.2 m) and 8.82% (0.2 - 0.4 m) before irrigation and 11.88% (0.0 - 0.2 m) and 12.13% (0.2 - 0.4 m) after irrigation corresponding to 40.59 and 42.07% of the available water capacity in the soil before irrigation and 56.66 and 57.82% of AWC after irrigation. Based on the soil water retention curve (Figure 1), soil water stress values ​​under full irrigation conditions ranged from 8 to 18 kPa (0.0 - 0.2 m) and from 6 to 8 kPa (0.2 - 0.4 m), close to the field capacity limit (FC). Normally, in ‘Cerrado’ sandy soils, it is defined that the water in the soil is in the FC when it is retained at a tension of 10 kPa (Andrade and Stone, 2011). Soil water tension ranged from 54 to 20 kPa (0 - 0.2 and 0.2 - 0.4m) before irrigation and from 26 to 14 kPa (0 - 0.2 and 0.2 - 0.4 m) after irrigation in DII, while it ranged from 54 to 48 kPa (0 - 0.2 and 0.2 - 0.4 m) before irrigation and from 24 - 14 kPa (0 - 0.2 and 0.2 - 0.4m) after irrigation in DIII, indicating that the plants in the layers of (0.0 - 0.2) experienced period of water deficiency in the soil, since the tension values ​​were higher than those recommended for beginning of irrigations in the soybean, which is 37 kPa (0 - 0.2 m) (Saad and Libardi, 1992). During the application of the DIV treatment, it was not possible to apply the desired water deficit, due to precipitation, in a few days during this phase, which raised the soil moisture to levels above the critical storage for the crop. In fact, before irrigation, in the 0 - 0.2 and 0.2 - 0.4 m layers, soil moisture ranged from 11.3 to 12.08%, while moisture after irrigation ranged from 12.97-13.7% (Figure 4C and D).
In fact, the soil moisture variation in this treatment closely resembled that of full irrigation treatment (Figure 3A and 3B) and, therefore, the soil water deficit planned for this phase was compromised. In Table 3, it is possible to observe the variance analysis for the variables plant height (AP), number of leaves (NL) leaf area index (LAI) and total dry matter (TDM) during different sampling periods. There was a significant interaction for all variables among the evaluated factors. Thus, the results and discussion are presented based on the growing curves of these variables during the soybean development stages. Figure 5 shows the variation of the height of soybean plants in response to the treatments applied throughout their phenological phases. Table 4 shows the regression equations of the curves shown in Figure 5. At the end of the cycle, it was verified that the height of the plants under full irrigation was 69.3 cm; 51.2 cm when submitted to phase II water deficit (DII); 46.3 cm when submitted towater deficit in phase III (DIII) and 66.7 cm when submitted to phase IV water deficit (IVD), indicating that, independently of the phenological phase in which the water deficit occurred, there was a decrease in height of plants in relation to full irrigation (PI) treatment. Although there was no significant difference in plant height among treatments in which the soil water deficit was applied in phases II and III, the reduction in plant height was more drastic when the lack of water occurred in phase III, considered critical, in which culture requires more water to satisfy its metabolic activities.
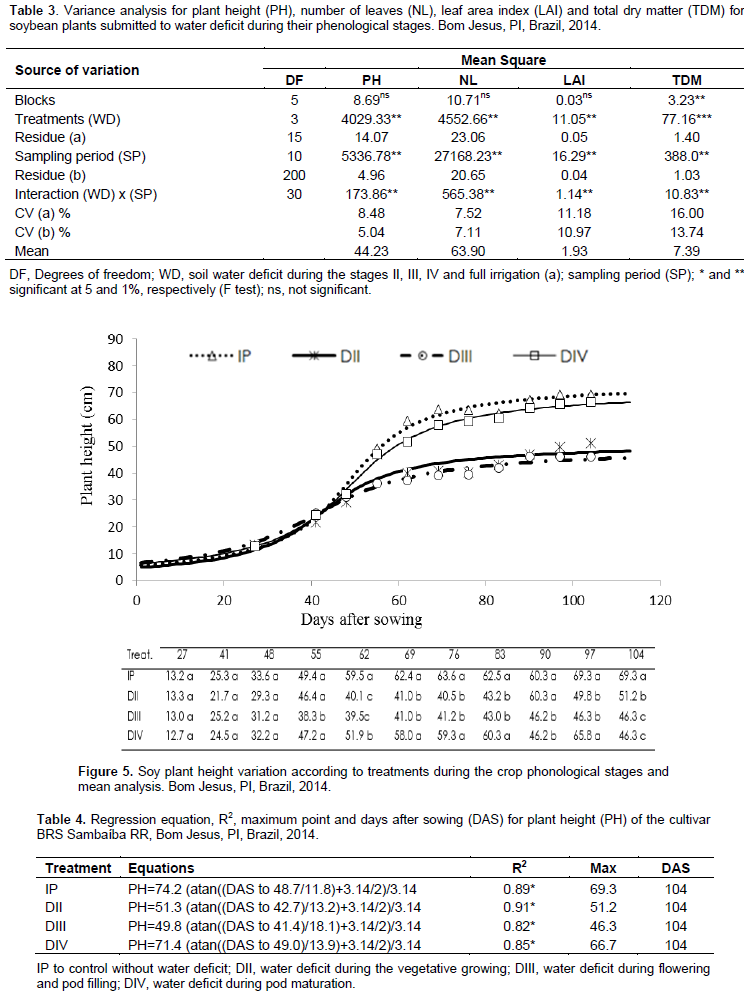
In phase IV, the water deficit effect on plant height was lower, similar to the IP treatment, because it is the final phase of the crop cycle, and the beginning of senescence and also due to the rainfall during the phase DIV (Figure 3G and 3H), which should suffer water deficit. According to Ferrari et al. (2015), the first plants response to water deficiency in the soil is the reduction of turgescence, inhibiting photosynthesis and, consequently, the growth process, during its development. The soybean height is of fundamental importance because it is a characteristic that is normally correlated with the production characteristics (Rocha et al., 2012). Fornasieri Filho (2007) affirmed that the decrease in plant height plant can be explained in part by the fact that the association between the root system and the aerial part (A/R) varies according to environmental factors in the different plant development stages. Under water deficiency in the soil, it induces a reduction in the A/R value due to inhibition of shoot development and greater root growth. Rocha et al. (2012), studied varieties and strains of soybean in low latitude conditions in Teresina to PI, Brazil; they observed for the cultivar BRS Sambaíba, average plant height of 73.4 cm, higher than the values observed in the present study, probably because the experiment have been conducted under ideal conditions regarding the nutritional aspect or plant water supply.
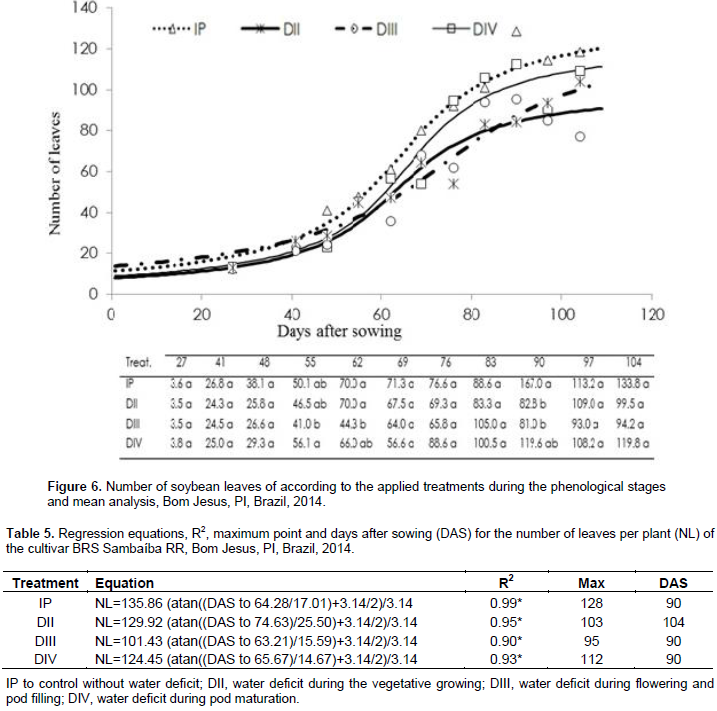
Figure 6 shows the variation of soybean leaves number in response to the applied treatments throughout their phenological phases. The regression equations of the curves of Figure 6 were presented in Table 5. The soybean crop presented a lower number of leaves when the water deficit was applied in phase III (DIII), with a final value of 77 leaves plant. On the other hand, the treatment under full irrigation presented a higher number of leaves per plant (118), as a result of the higher soil water availability during the crop cycle. Nascimento et al. (2004), studied the effects of the variation of available water levels on the cowpea development and concluded that there was a reduction of approximately 11, 23 and 35%, for the number of leaves per plant, when 80, 60 and 40% of available water was applied, when compared to control. The reduction of the number of leaves in plants under water deficit can be considered as a survival strategy under adverse conditions to avoid water loss by transpiration (Ferrari et al., 2015). The existence of water deficit in extreme conditions promotes the progressive death of leaves, starting with the older ones and going to the younger ones, especially when the plant cannot maintain its water status above the RCWc (Lawn and Likoswe, 2008; Fioreze et al., 2011). Soy genotypes, when cultivated under conditions of soil water deficit, presented differences in leaf and plant survival as a function of RCWc (James et al., 2008).
According to Machado et al. (2009), the leaf senescence is a response of the water deficit and occurs after a decrease in leaf emergence. The reduction of green leaves has been reported in plants with water deficiency and attributed to the strategy of decreasing the transpiring surface and the metabolic expenditure for the tissues maintenance (Inman-Bamber et al., 2008). The leaf area index of soybean in response to the applied treatments during the phenological phases is presented in Figure 7. The highest values of LAI occurred between flowering and grain filling. During the application of water deficit in phase DIII, the development was very slow when compared to other treatments, due to the water deficit in the soil, affecting the performance of the LAI, which decreased when compared to the control; about 47.4% less than the full irrigation plants (IP).Ferrari et al. (2015) concluded that reduction of water availability in the soil decrease the leaf area index expansion. The leaf area is represented by the photosynthetically active surface of the plant, whose growth is highly related to plant production (Teixeira et al., 2015). Leaf area index (LAI) acts as an indicator of the available surface for interception and light absorption (Pavani et al., 2009). The reduction of leaf area in plants under water deficit can be translated into a survival strategy, aiming the reduction of the transpiration area (Ferrari et al., 2015), with a consequent reduction in the photo to assimilates production (Casaroli et al., 2007). When there is a lack of water in the soybean plant, morphophysiological changes appear, with foliar winding and wilting being an indicator of severe water scarcity (EMBRAPA, 2011; Ferrari et al., 2015).
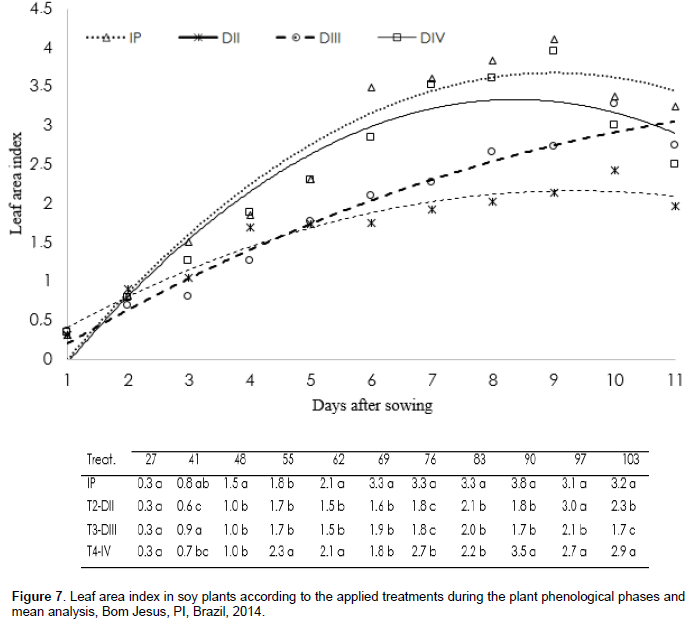
Confalone and Dujmovich (1999), studied the influence of water deficit on solar radiation efficiency in soybean, and found LAI values ​​of 6 and 4.1 for full irrigation and flowering and pod filling deficits, respectively. These LAI values ​​were higher than those observed in the present study, possibly due to the use of Asgrow 4656 soybean cultivar, which has an indeterminate growth and higher seeding density than that used in the present study (29 plants per linear meter). Martorano et al. (2009), studied soil condition indicators with soybeans in no to tillage system (PD) and conventional soil preparation (CP), and observed LAI values ​​of 6.0 in irrigated treatments, while in non to irrigated treatments the value observed was 5.7 for PD and 5.6 for CP, demonstrating similarity in terms of maximum LAI in both soil management systems, with lower values ​​for non to irrigated treatments (Table 6). The dry matter of the aerial part of the soybean plants in response to the treatments during their phenological phases and the respective regression equations are shown in Figure 8 and Table 7. There was an increase in the total dry matter (TDM) of the aerial parts of the plants in all evaluated treatments. However, this growth in TDM was higher in plants cultivated under full irrigation and when submitted to water deficit on phase DIV, reaching maximum values of 14.4 g/plant, at 94 DAS, under IP, and 12.9 g/plant at 87 DAS with treatment DIV (Table 7). This behavior is a reflection of the higher water availability in the soil during the soybean cropping in these two conditions (Figures 3A, 3B, 4C and 4D).
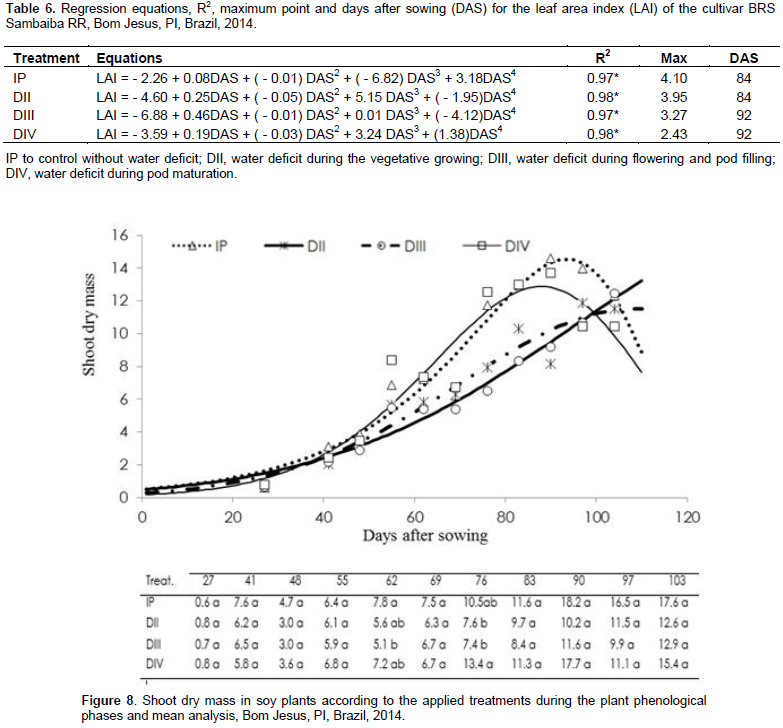

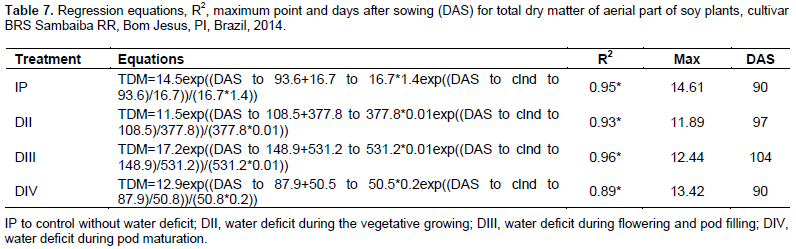
From these maximum values, there was decrease in the plant TDM due to the natural process of foliar senescence. On the other hand, with the application of DII and DIII, less accumulation of TDM throughout the growing season was observed, due to the reduced availability of water in the soil for the plants in these two conditions. It is important to highlight that the points of maximum accumulation of TDM of these two situations were obtained only at the end of the cycle, at harvest time (11.5 g for DII treatment and 12.43 g for DIII treatment). This behavior is a reflection of the combined effect of reducing the number of leaves per plant (Figure 6) and leaf area index (Figure 7) when submitted to water deficit in these two phases, affecting TDM. Tavares et al. (2013) found that the dry mass of soybean plants up to 40 days after emergence was affected by soil water deficiency. In most cases, the deficit caused by water deficit affects the response between plants, which can be measured by the yield, growth or the primary process of CO2 assimilation, which allow maintenance of water status during the reduction of soil moisture, where it is characterized as the drought resistance (Morando et al., 2014).
Soybean is sensitive to soil water deficit during the vegetative development, flowering and pod filling. The water deficit in the flowering and pod filling stages reduced the BRS Sambaiba RR cultivar growth by up to 33.2% (plant height), 34.7% (number of leaves), 41.3% (leaf area index) and 13.7% (total shoot dry matter), when compared to the control submitted to full irrigation.


