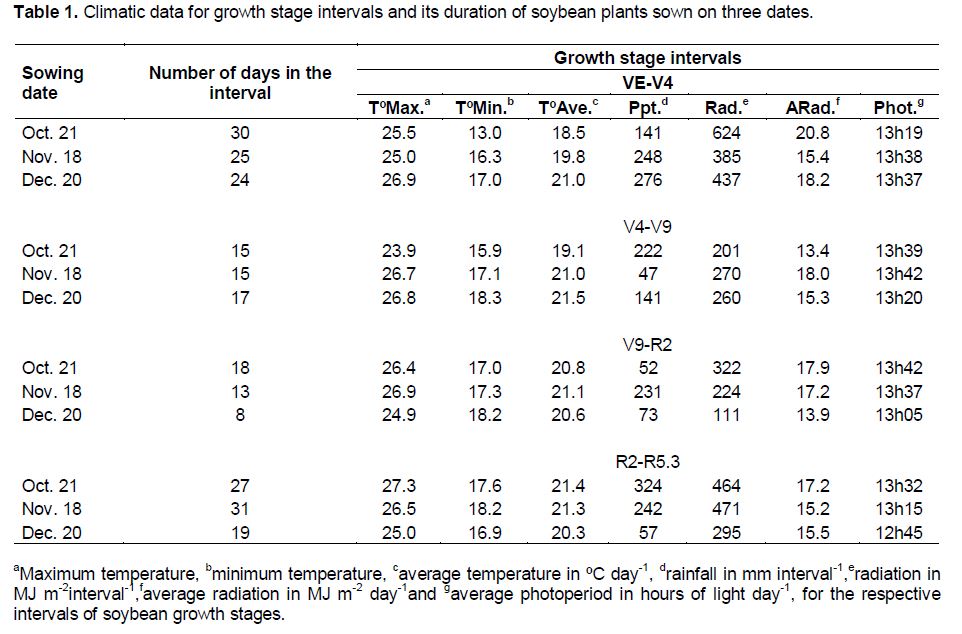
The number of days in the studied intervals (that is VE-V4, V4-V9, V9-R2 and R2-R5.3) was reduced when plants were sown in December with the exception in the interval V4-V9 (Table 1). This reduction probably occurred because of the shortening of the photoperiod, as the sowing date was delayed, principally from V9 growth stage.
In general, average temperature was more than 2°C lower for plants sown earlier, until V9 growth stage;
however, after R2 growth stage, the average temperature was more than 1°C higher for plants sown in October compared with December. During soybean growth, the precipitation was well distributed with only a reduction in the last growth stage intervals for the plants sown in December however, without occurrence of severe drought. The average radiation was not low during the growth stage intervals with high rainfall evidencing the occurrence of cloudy days without precipitation.
Plant height until V9 growth stage was not an accurate parameter to estimate the final plant height at R5.3 (Table 2) because only after this growth stage, the interference of sowing dates in the final plants height was clear. At R2 growth stage, plants decreased height with a delayed sowing date so when sown in December, the plant height was lower than when sown in October and November for all cultivars.
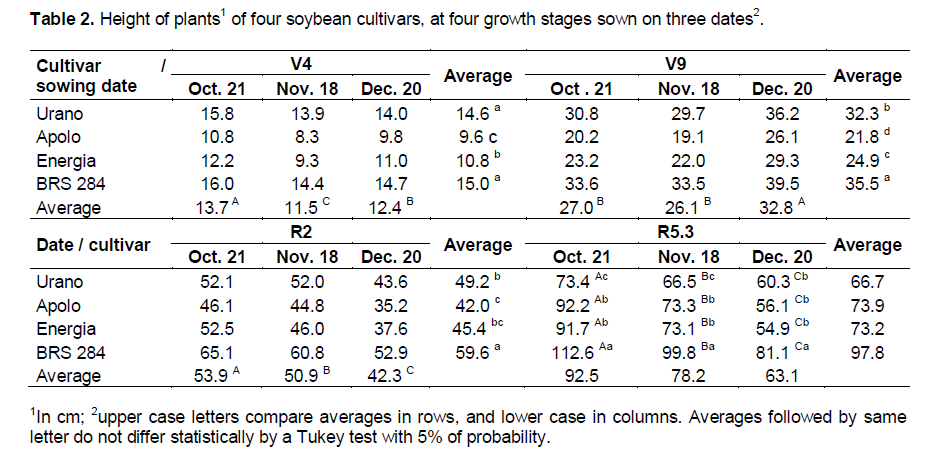
There was significant interaction in last growth stage (R5.3) when plants from all cultivars sown in December showed a larger reduction in height compared to those in October with the exception of the cultivar Urano, which has a determined growth habit.
Comparing the data of plant height of the cultivars at R5.3 growth stage with the description given by its owners’ companies, the cultivars Energia (average of 92 cm) and Urano (average of 73 cm) achieved approximately the height given by their owners when sown in October. For BRS 284 (average of 100 cm) and Apolo (average of 73 cm) it occurred when sown in November. For cultivars BRS 284 and Apolo in southern Brazil, the early sowing led to taller plants than that reported by the owner companies. This fact is more pronounced for cultivar BRS 284 which among the studied cultivars presented moderate risk to lodging according to the owner company and was the tallest cultivar in the present study. Therefore, for BRS 284 and other tall cultivars with indeterminate growth habit, the early sowing date can be a problem due to lodging.
The cultivar Urano had a reduction of plant height after R2 growth stage; however, the reduction of this cultivar was less than that of others. For Urano, more reduction occurs between V9 to R2 growth stages. This fact occurs due to the reduction in the number of days between V9 and R2 growth stages: 18, 13 and 8 days for sowing in October, November and December respectively. The premature flowering of this cultivar was caused by the sensitivity to a short photoperiod combined with high temperatures with a delaying of the sowing date.
The interaction between treatments in plant height at R5.3 growth stage was probably due to the indeterminate growth habit of cultivar Urano, which at R2 growth stage reached approximately 75% of its final height in all dates of sowing. On the other hand, the others cultivars at R2 achieved 55, 60 and 65% of their final heights when sown in October, November and December, respectively. Bastidas et al. (2008) also verified a reduction in the final growth percentage achieved by soybean plants at a reproductive period when sown late. However, the authors did not observe interaction among the cultivars and the time of sowing.
In this paper, the authors utilized indeterminate growth habit cultivars and one semideterminate. Because of this, the results were probably different from the present study wherein the contrast among cultivars was higher.
There was no statistical difference in the diameter of the main stem caused by the date of sowing for cultivars at V4 growth stage (Table 3). Similar to plant height, the diameter of the plant main stem was greater in plants sown in December than those sown in October and November at V9 growth stage. However this changed at R2 and R5.3 growth stages, when the delay in sowing resulted in a smaller stem diameter, agreeing with the results of Marchiori et al. (1999).
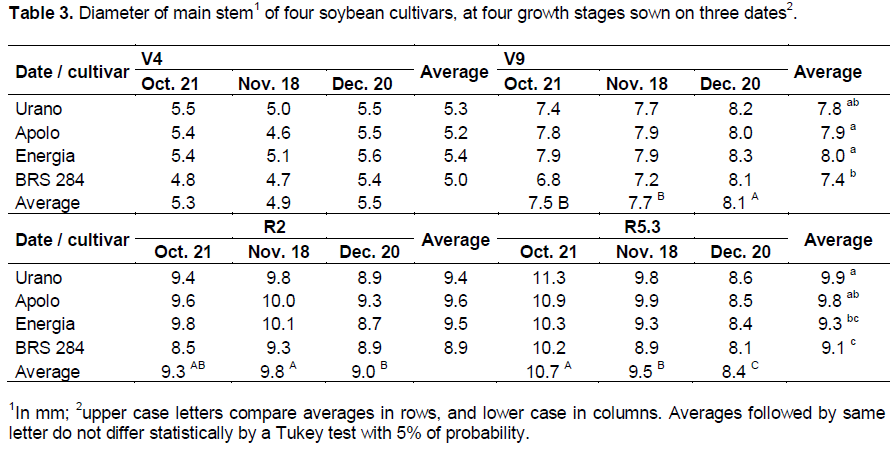
There was an increase of 0.12, 0.12 and 0.13 mm of the main stem diameter for each 1 cm increase in plant height in the sowing of October, November, and December, respectively, at R5.3 growth stage, showing slight increments of stem diameter in relation to plant height with sowing delay. For cultivars, the increases of stem diameter with increases of plant height were: 0.15, 0.13, 0.13 and 0.09 for Urano, Apolo, Energia and BRS 284, respectively, showing a lower increase of stem diameter with increase of plant height for BRS 284, making this cultivar more susceptible to plant lodging. It was also noted that the change of sowing date did not result in an increase of stem diameter in relation to an increase of height in the cultivars Urano and BRS 284. However, the cultivars Apolo and Energia presented values of 0.11, 0.13 and 0.15 mm for sowing in October, November, and December, respectively.
In soybean crops the competition among plants decreases the stem diameter (Seiter and Altemose, 2004). These authors observed that at R5.5 growth stage, soybean plants showed the largest stem diameters at lower planting densities resulting in lower competition among plants. Therefore, smaller values on early sowing may be caused by higher competition between plants sown earlier when the plant height and the LAI were larger. Cultivars Urano and BRS 284 maintained the increase of stem diameter in relation to the increase of height for all sowing dates. Thus, we can suppose that for these cultivars, the competition among plants is similar independently of the sowing date. On the other hand, for cultivars Apolo and Energia, the competition among plants decreased in late sowing; it does not mean that late sowing dates are best for these cultivars, since if the competition is too small, the cultivation area can be underexploited and the yield reduced.
The number of branches at V4 growth stage was higher in plants sown in October than in November and December (Table 4). At R2 growth stage, the sowing date did not affect the number of branches; and at R5.3 growth stage, the number of branches was highest in plants sown in October, lowest on November, and intermediary in December. In addition, plants sown in November had a reduction in the number of branches at R5.3 relative to R2 growth stage. Among cultivars, BRS 284 showed a lower number of branches than the others cultivars. At V9 growth stage, there was significant interaction between sowing dates and cultivars. Cultivars increased the number of branches formed as the sowing dates were delayed, and in the cultivar Urano, this increase was higher than in the other cultivars.
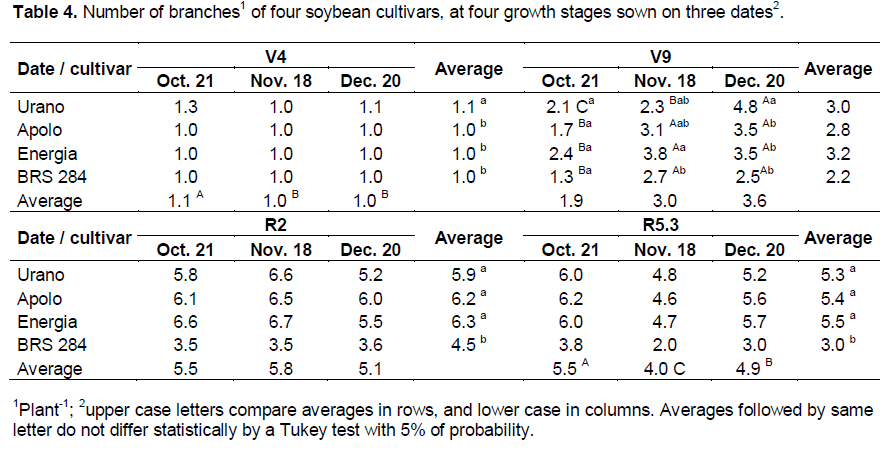
The reduction in the number of branches in plants sown in November at R5.3 growth stage compared to at R2 growth stage (Table 4), was probably due to self-shading at the lower third of plant canopy. For the sowing of October, although plants lost formed branches, the largest photoperiod may have induced the new branch formation at the middle third of the plant canopy as cited by Jiang et al. (2011) and Han et al. (2006).This formation of new branches did not occur in plants sown in November due to a short photoperiod. Kantolic and Slafer (2001) explain that there is no difference in the number of branches in plants submitted to an extended two hours of artificial photoperiod. In December, because the self-shading was very low, there was probably less fall of branches at the lower third of the plant canopy.
Kantolic and Slafer (2001) verified differences among cultivars and sowing dates, where late maturing cultivars produced more branches, and the delay of sowing date reduced the number of branches of plants. In this study, cultivars of early and very early maturation group were studied and all had a reduction in the number of branches at R6 with the delay of sowing date.
In our study, the number of branches was also reduced with sowing delay. However, we realized that the late maturing cultivars (BRS 284) had the lowest number of branches. Indeed the number of branches is a characteristic of the cultivar and is not related to the maturity group. The cultivar BRS 284 showed the lowest number of branches, and it was inversely proportional to plant height. Heiffig et al. (2005) stated that the intra-specific competition in soybean plants may determine the plant size and its number of branches, these two characteristics being inversely proportional. The number of nodes (Table 5) of the main stem in general showed a behavior similar to the plant height (Table 2). At V9 growth stage, plants formed a higher number of nodes when sown in December, and at R2 growth stage the number of nodes decreased gradually with a delay in the date of sowing.
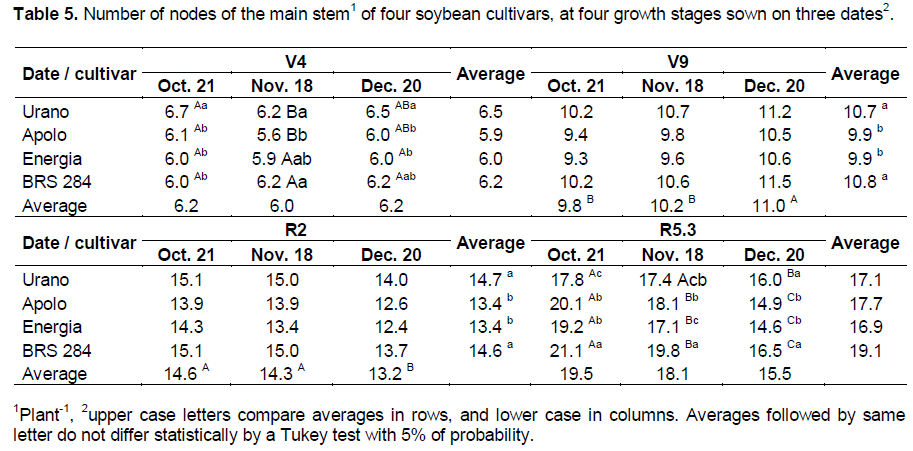
In the comparison among cultivars, Urano and BRS 284 had a higher number of nodes than cultivars Apolo and Energia except at R5.3 growth stage when the cultivar Urano showed a fewer number of nodes when sown in October compared to the other cultivars. Thus, the cultivar Urano was less affected by a delayed sowing date with a lower reduction in the number of nodes than other cultivars as the sowing date was delayed. This result corroborates with the findings of Setiyono et al. (2007), who verified an increase in the number of nodes with an increase in the interval in days from R1 until R5 growth stages for the indeterminate growth habit cultivars; this explains the larger number of nodes of the other cultivars in relation to the cultivar Urano, at the sowing in October at R5.3.
There is a positive correlation between the number of nodes and the temperature (Sinclair et al., 2005); thus, the higher number of nodes observed until V9 growth stage in plants sown in December may be explained by the increase of temperature in this interval (Table 1). From V9 growth stage, the temperature was lower at sowing in December and the number of days among stages decreased sharply with the delay of sowing partially explaining the higher number of nodes observed in plants on the two first sowing dates in relation to the last.
In the same way, Bastidas et al. (2008) verified significant interaction between sowing date and cultivar in the number of nodes. The authors explain this result affirming that cultivars with a predisposition to have a lower number of nodes tend to lose fewer nodes than cultivars with a predisposition to have a high number of nodes. Therefore, the present study corroborates these findings and states that the cultivar Urano with determinate growth habit, similar to the cultivar with lower loss in number of nodes in the study of the Bastidas et al. (2008), already achieved most of its growth development until R2 suffering less from the unfavorable environment that occurred after R2 growth stage. The authors also verified that the plants after V9 growth stage, presented a lower increase in the number of nodes with the sowing delay, in agreement with the results of our study.
The sowing date did not influence LAI of soybean plants at V9 growth stage, but at R2 growth stage, the lower LAI was found in the sowing of December (Table 6). At R5.3 growth stage, the highest LAI is clearly noted for plants sown in October middle values in November and the lowest in December. Among cultivars, in the same growth stage, the highest final LAI was for cultivar BRS 284. There was significant interaction between cultivars and sowing date in LAI at V4 growth stage where the cultivar BRS 284 showed slow initial development, but more constant than others cultivars.
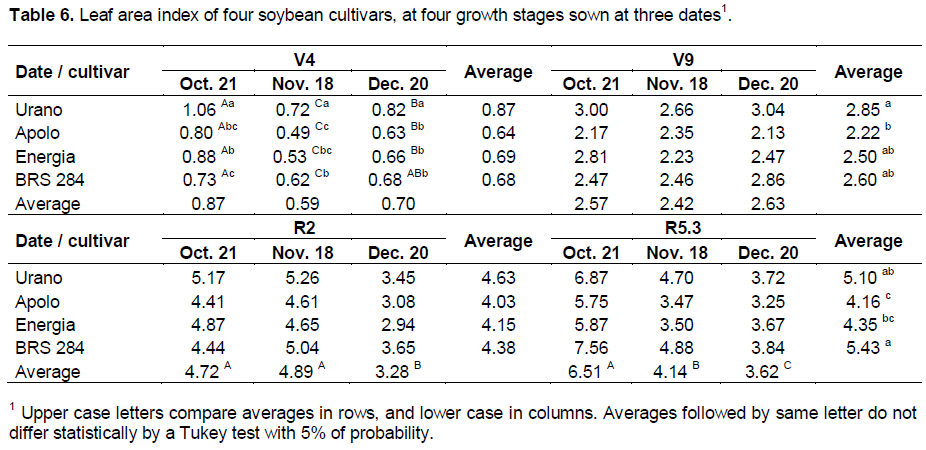
The decrease of LAI in plants at R5.3 growth stage with delaying the sowing date may be partially explained by the fewer number of days to plant development of 88, 83 and 67 days after emergence, for sowing in October, November, and December respectively. However, the major influence on this aspect was the photoperiod post- flowering that decreased with delaying the sowing date according to Han et al. (2006). The plants sown in October were at R2 growth stage in late December to early January when the days in these months have the largest photoperiod of the year.
The cultivar BRS 284 has high leaf production that assures high values of LAI even under unfavorable conditions. This characteristic is favorable because LAI around 5.5 in soybean plants ensures large light interception by the plant canopy both of short and long waves and with this LAI, the light amount incoming to the soil is very low, and thus, the soil water evaporation is also small (Sauer et al., 2007).
The interaction between treatments occurred at V4 growth stage for LAI; the high LAI of plants sown in October was probably due to the large number of days of plant development (30 DAE) and the highest average daily radiation among the sowing dates (Table 1). At this growth stage, plants from cultivars Apolo and Energia sown in November showed the lower LAI, probably caused by low average solar radiation (Table 1) as also explained by Calviño et al. (2003). It may be concluded that for these cultivars, high solar radiation is needed for leaf production.
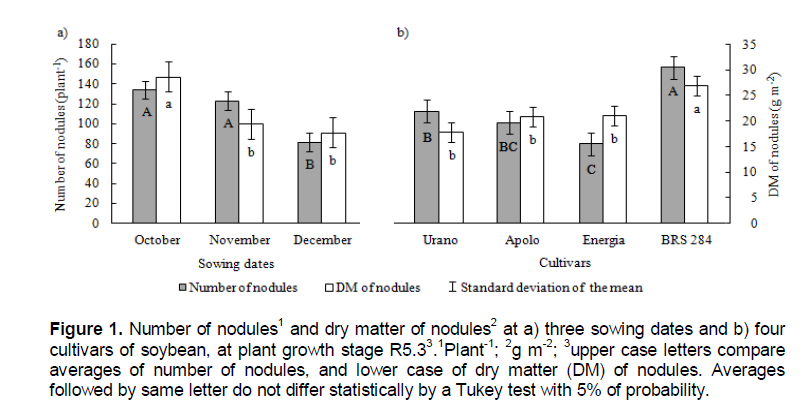
Models for estimation of soybean plant growth, like that of Setiyono et al. (2010), utilized solar radiation as a parameter that drives vegetative growth. Models suggest a linear increase in biomass and LAI with an increase of radiation. At V4 growth stage, plants from cultivar Urano had the largest LAI in all sowing dates, showing higher early leaf development efficiency than other cultivars. The number of nodules (Figure 1a) was higher in plants sown in October and November, but the DM of nodules (Figure 1b) was higher in plants sown in October, demonstrating that plants sown in October formed larger nodules. Cultivar BRS 284 formed a higher number and DW of nodules than the other cultivars. The higher number of nodules of cultivar BRS 284 probably occurred because it is more able to nodulate and not because it is the cultivar with more vegetative development with a high amount of nodules to supply nitrogen.
According to Francisco Junior and Harper (1995), in a study with graft and rooting of the leaves and shoot of soybean with normal and mutant cultivars capable of hyper-nodulation, the leaves, in comparison with others organs of the soybean plants, have a greater influence on nodulation by producing a high portion of the physiological signs responsible for infection by Rhyzobium. However, it was not the amount of leaves that is the most responsible for the control of nodulation but the genotype of the plant.
Environmental conditions, i.e. soil moisture (King and Purcell, 2005) and soil temperatures below 25°C, limited soybean nodulation (Miransari and Smith, 2008); therefore there is risk of reducing soybean nodulation due to lower temperatures in southern Brazil in sowing before October. Zhang et al. (2003), studying yield of different cultivars and strains in Canadian soil, found nodules limitation due to low soil temperatures. The authors verified differences of mass and number of nodules among cultivars, and the greatest differences in the amounts of fixed nitrogen changed according to the strains utilized. Moreover, the authors verified that the bigger the amount of nodules (both number and mass), the higher the amount of nitrogen (kg ha-1) produced by the shoots of the plants.
According to Salvagiotti et al. (2008), there is a positive linear correlation between nitrogen uptake in aboveground and soybean yield. Vollmann et al. (2011) emphasized the importance of nodulation in soybean plants, relating it with chlorophyll content of leaves, yield and oil and protein content of seeds. Thus, it can be concluded that there are genotypes more able to nodulation, and that larger leaves are not responsible for higher nodulation, but the limitation of nodules may reduce the amount of nitrogen produced by the plants. Table 7 shows the correlation coefficients between studied quantitative plant characters and the final grain yield. Leaf area index was the plant character with the greatest influence on final grain yield. Other characters such as plant height and number of nodes, diameter of branches and DM of nodules also had an influence on yield, however lower than LAI. Sauer et al. (2007) verified a high correlation between LAI and plant yield.
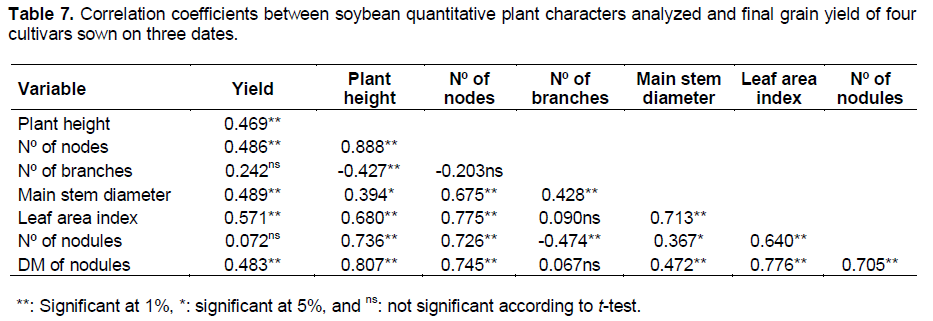
In this study, we observed a reduction in LAI of 0.082 per day of delay in the sowing date, from October 21 to November 18. The grain yield in the same period decreased 24 kg ha-1 per day with a delay in the sowing date. Considering the period between November and December, the decrease in LAI was 0.016 day-1, but we did not observe a reduction of grain yield. Therefore, the time of soybean sowing is essential to achieve elevated values of LAI and obtain high yields. The DM of nodules showed a higher influence on final grain yield than its number. The number of nodules and DM of nodules may change independently, as shown in Figure 1, so it is recommended that it’s DM rather than it’s number be observed more attentively if the nodulation is a parameter utilized in selection of soybean cultivars with high yield potential in breeding programs.