ABSTRACT
Tomato culture is very nitrogen demanding and periodical evaluation of the nutritional state of tomato plants can help in handling nitrogen fertilization. Determining the relative content of chlorophyll using a chlorophyll meter or soil plant analysis development (SPAD) has come up as an alternative method among the common methods. The aim of this study was to determine the relative chlorophyll index in the leaf blade of tomato plants ‘BRS Zamir’ in response to nitrogen doses throughout 112 days in a protected environment. A randomized delimitation was used with subdivided parcels in time with four replications. The parcels (two plants) received treatment constituted by 5 Nitrogen (N) doses: 80, 160, 240, 320 and 400 kg ha-1 of N, using urea as source. The doses were divided and applied on the 14th, 28th, 42nd, 56th, 70th, 84th, 98th and 112nd days after transplant. Determination of relative content of chlorophyll was done using a portable meter, with readings in the following schedule: 7:00 a.m, 9:00 a.m, 11:00 a.m, 1:00 p.m, 3:00 p.m and 5:00 p.m. The data were subjected to analysis of variance by F-test at 5% probability, and when they were significant, they were analyzed by a regression. The study verified that relative content of chlorophyll presented a positive correlation of 0.84 with content of total N, and the dose increments of N influenced the chlorophyll content in leaf blade.
Key words: Solanum lycopersicum L., chlorophyll meter, relative chlorophyll index (RCI).
Cherry tomato (Solanum licopersicum var. cerasiforme) is considered to be an exotic vegetable due to its sensorial properties, taste and red color. In Brazil, it has already been found since the 90s, and it is becoming common in restaurant menus, plate ornamenting and appetizers, besides having attractive prices for producers (Machado et al., 2003; Rocha et al., 2009; Silva et al., 2011; Araújo et al., 2013). Because cherry tomato culture demands fertilization, producers face a high production cost. Thus, it is important to apply proper fertilization and the use of adequate techniques when harvesting and handling the culture, in order to minimize costs and enhance fruit quality (Ferreira et al., 2003; Souza et al., 2010).
Forage fertilization must happen according to the physiological development of the culture. Up to the moment of blooming, the leaf (specifically in chloroplasts) is the organ of the tomato plant which contains the highest concentration of nutrients and dry mass. Nitrogen (N) is among the nutrients that are more required by the tomato plant. This is a vital element for the plants and its application can be parceled according to the demand of N from the plant (Argenta et al., 2003; Ferreira et al., 2003; Fontes and Araújo, 2007).
Monitoring chlorophyll content in the leaf is one way of determining the need for N. These contents have high correlation with nitrogen, and can be obtained through laboratory means (destructive) or in loco (non-destructive) through portable devices, allowing for the monitoring of the nutritional state of the plants and creating a toll at decision making for nitrogen fertilization (Salla et al., 2007; Silveira et al., 2003; Carvalho et al., 2012).
The use of portable meters to estimate chlorophyll content in a sensible, precise and non-destructive way is far more beneficial than lab methods (Rezende et al., 2010; Rigon et al., 2012). The measures retrieved by these devices are known as relative chlorophyll index (RCI) or soil plant analysis development index (SPAD), and allows the identification of the nutritional state of the plant. From this index it is possible to estimate the proper quantity of nitrogen to be applied (Gil et al., 2002; Amarante et al., 2010).
The aim of this study is to determine the correlation of the RCI in the leaf blade of the cherry tomato ‘BRS Zamir’ in response to nitrogen doses, with chlorophyll content obtained in the laboratory.
The experiment was conducted in a protected environment at State University of Goiás – UEG, in the Campus of Exact and Technologic Sciences, Anapolis – Goiás, Brazil. The area is located at 16°20’34”S and 48°52’51”O, 997 m above sea level (Moura et al., 2005). Cherry tomato seedlings, cultivar BRS Zamir, were transplanted on April 20, 2014 into polyethylene vases containing 7 L of water, using a commercial substratum as backup and one seedling per vase. They were transplanted with 2 to 3 pairs of well-formed leaves 28 days after sowing, with 1.00 m spacing between rows and 0.40 m between plants. Culture practices were performed according to the recommendations from Fontes and Silva (2002), in which thinning and vertical transport of the culture were performed weekly; pruning of tips happened when plants reached two meters of height and vertical tutoring with plastic straps. The experiment was performed in a randomized delimitation with sub-subdivided parcels in time with four replications. The parcels were constituted by two plants and received randomly one of the five doses of N: 80, 160, 240, 320 and 400 kg ha-1, using urea as source. The sub-parcels correspond to the evaluation days: 14, 28, 42, 56, 70, 84, 98 and 112 days after transplant (DAT), and the sub-subparcels to the schedule within each evaluation day: 7:00 a.m, 9:00 a.m, 11:00 a.m, 1:00 p.m, 3:00 p.m and 5:00 p.m.
The RCI in the leaves of tomato plants was retrieved with the aid of a portable chlorophyll meter, model CFL 1030 (Falker Farm Automation®) (Falker Automação Agrícola, 2008). The readings from the RCI in field follow the methodology proposed by Fontes and Araújo (2007), in which measures of each parcel were performed on adjacent leaves to each plant bunch. The readings of the leaves were conducted on five leaflets, being two on each side of the leaf (laterals) and the central end leaflet. In the evaluation conducted on the 98th DAT the evaluated leaves in the field were taken and sent to the lab of Agriculture Engineering in the Campus of Exact and Technologic Sciences of State University of Goiás to determine chlorophyll contents and total nitrogen content. The chlorophyll content was analyzed following the procedure/method of Lichtenthaler (1987). A precision scale was used to weigh 150 mg of leaves and they were fragmented in Eppendorf flasks with 1.5 ml of pure acetone without compacting. The tubes were under agitation for 24 h, low temperature and wrapped with aluminum foil to prevent contact with light. After the stipulated period, the acetone solution was removed from the tube, and then absorbance of acetone solution was read in 661.6 nm for chlorophyll a (Ca) and 644.8 nm for chlorophyll b (Cb).
To determine the total nitrogen content adequacy to Kjeldahl method (1883) proposed by Embrapa (2006) was adopted. The collected leaves were placed in paper bags, dried in a hothouse with forced circulation of air at 60° for 24 h. After this period the material was analyzed and grinded in a Wiley type mill with a colander of 20 mesh and then stored in a place without light. Each sample was weighted to 0.1 g on a precision scale, homogenized and transferred to a Kjeldahl tube. For each sample, 2.5 g of catalytic mixture was added and 7 ml of sulfuric acid, so that they could be heated over a digestion block, at 50°C for one hour, afterwards the temperature was increased gradually up to 350 to 400°C. When the liquid became transparent, the samples were taken away from heating; 10 ml of distilled water was added after they cooled down. After that, distilling of samples was performed by engaging them to Erlenmeyer distillery, with working conditions of 20 ml of boric acid solution at 4%, with 4 drops of mix indicator solution. The Kjeldahl tube was adapted to the distillery and added to the sodium hydroxide solution at 50% until a dark color solution was obtained. When distillation was completed, the samples were titled with pattern sulfuric acid solution (0.05 mol L-1) up to the turn of the indicator.
The following data analyses were performed: a) Pearson’s correlation between the values from leaf analysis on the 98th DAT of nitrogen content and RCI, to measure the amount of linear correlation between two quantitative variables, reflecting the intensity of a linear relation between the data groups; b) Nitrogen sufficiency index (NSI) which is the relation of the values from RCI present in doses of 80, 160, 240 and 320 kg ha-1 of N by the values found by reference doses, which in this study is 400 kg ha-1 of N; c) Variance analysis for the variable RCI, considering random delimitation with sub-subdivided parcels in time regression analysis for the split of significant interactions for the quantitative factors, was performed.
The summary of analysis of variance for RCI is presented in Table 1. It is possible to observe the significant interaction (p<0.05) between the doses of N (80, 160, 240, 320 and 400 kg ha-1) and the evaluation times (7:00 a.m, 9:00 a.m, 11:00 a.m, 1:00 p.m, 3:00 p.m and 5:00 p.m.) and respective days. Regarding doses of N deployed through evaluation days, it was observed that on the 42nd, 56th, 70th, 84th, 98th and 122th DAT, respectively significant differences (p<0.05) in RCI were presented, because the readings on RCI gathered through the portable chlorophyll meter increased due to the amount of N furnished to the plants in the different days of evaluation. Similar outcomes were found by Ferreira (2006), who evaluated the RCI and chlorophyll content in the leaf blade of the tomato plant concerning the doses of nitrogen and organic fertilization in two harvest times. These results corroborate with the one gathered by other authors for different cultures, when evaluating the RCI in the leaves, which showed an increase in the index with the increment in the dose of N applied in cotton (Neves et al., 2005), common beanstalk (Silveira et al., 2003) and cabbage (Moreira and Vidigal, 2011).
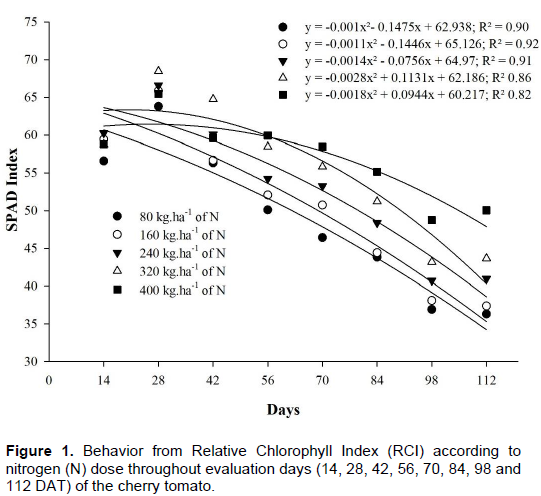
In the study by Xu et al. (1997) with tomato plant in a green house, there was a decrease in RCI throughout the cycle. For Fontes and Araujo (2007) and Porto et al. (2011), this occurred because N is a nutrient that takes part in the synthesis and structure of molecules of chlorophyll, and increase of doses of N up to a certain extent results in the increment of chlorophyll content and green color intensity in the leaves of the plant. For doses of 80, 160, 240, 320 and 400 kg ha-1 of N the critical levels of RCI were on 74th, 66th, 27th, 21st and 26th days of evaluation, respectively. The dose of N which presented the highest RCI in the critic level was of 240 kg ha-1 of N with RCI of 63, 61, 51, and 47 units, respectively (Figure 1).
Fayad et al. (2002) believed that the maximum absorption of nutrients is coincident to the initial blooming period of the tomato plant, and justify such affirmatives in their study of absorption of nutrients by the tomato plant in field conditions and protected environment, where they have found that absorption of N was crescent up to the 46th day followed by decrease of the former.
Schuelter et al. (2003) studied the behavior of RCI of three cultivars of tomato plant fertilized according to doses of N recommended by Guimarães (1998), and found a critical level of RCI for hybrid F1 around the 75th DAT, and have justified these outcomes, affirming that chlorophyll tends to degrade from a certain period due to plant physiology, with RCI as an indicator of photosynthesis activity. Possibly, chlorophyll degradation happens because as soon as fruits start to develop, there is increase in metabolic activity in the plant, leading to the absorbing of higher quantities of nutrients in the reproduction stage. Taiz and Zeiger (2009) and Fayad et al. (2002) affirm that when fruits start to develop, there is
a mobilizing force of nutrients which assimilates due to increment in metabolic activity, which can be associated to hormonal activities, division and cellular growth. From that point some nutrients such as nitrogen, phosphorus and potassium start to gradually build up in greater quantity in the fruit.
Total chlorophyll rate in the leaves of the cherry tomato plant presented a significant difference (p<0.05). Figure 2 portrays a quadratic behavior according to the doses of N applied. Chlorophyll content increased up to a critical level of 250 kg ha-1 of N, and after that it decreased with the increase of doses of N. For Fontes and Araujo (2007), N takes part in the synthesis and structure of the chlorophyll molecules, whereas doses of N increase up to a certain limit; there is increment in chlorophyll content and intensity of the green color in the leaves of the plant.
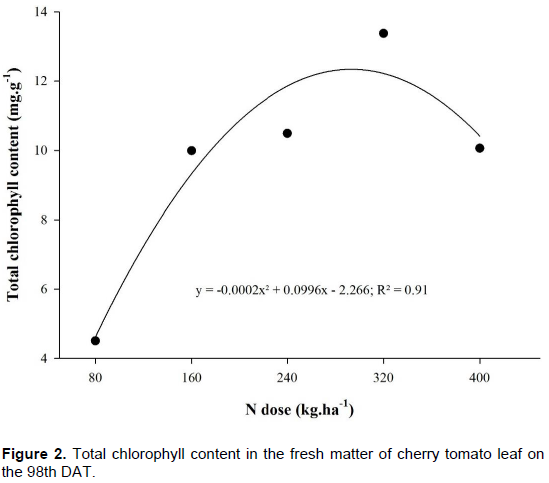
Porto et al. (2011) found similar results in the study with nitrogen fertilization for zucchini, where chlorophyll increased due to doses of N up to 40 kg ha-1, decreasing afterwards, presenting a quadratic behavior. Costa et al. (2008) verified increase in chlorophyll content in the leaf, with the increase of doses of N. Specifically about tomato culture, Ferreira (2006) found a quadratic behavior in chlorophyll content in relation to N doses, where it presented a similar behavior to the one in this study; that is, from this point on, the increase of doses led to decrease in the values of chlorophyll content.
Coelho et al. (2012) found a linear increase in chlorophyll content regarding the increase of N doses and justified this behavior because the portable chlorophyll meter detected indirectly, increase of N that is incorporated to chlorophyll molecules, not detecting the free form which are non-incorporated, where N builds up when there is luxury consumption. However, in this study, a quadratic behavior for chlorophyll content concerning the increase in N doses has been verified.
The total content of N in the dry mass of the cherry tomato leaves presented a significant difference (p<0.05). N content in the tomato plant leaf increased with the increment of N dose of kg.ha-1, presenting a linear behavior (Figure 3), where the dose of 400 kg.ha-1 of N presented higher total value of N with 32 mg g-1 of dry mass of the leaf. Possibly, the content of N in the dry matter of the leaf increases with the increment of N dose, because the lab analysis does not extract only N involved in the chlorophyll molecule of the leaf, but also what comes from luxury consumption. Luz et al. (2014) observed that the higher the nutrient availability, the higher the absorption of N by potato plants, thus increasing its transportation to the leaves, linearly.
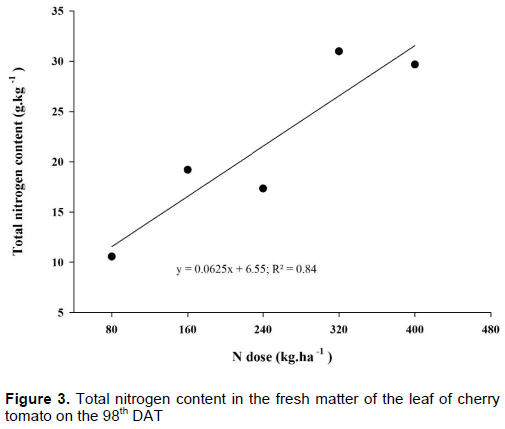
Similar outcomes were found by Coelho et al. (2012), who found a linear behavior in N content in relation to N doses applied to potato culture on the 21st day after emergency, and justified that N concentration in the leaf is due to quantity of N applied. Ferreira and Fontes (2011) studied nitrogen indexes in tomato plant leaves concerning nitrogen and organic fertilization, and observed a quadratic behavior in N content concerning N doses applied to zucchini culture, and justified such results by the fact that N is a component of chlorophyll molecule, being a limiter of photosynthetic activity.
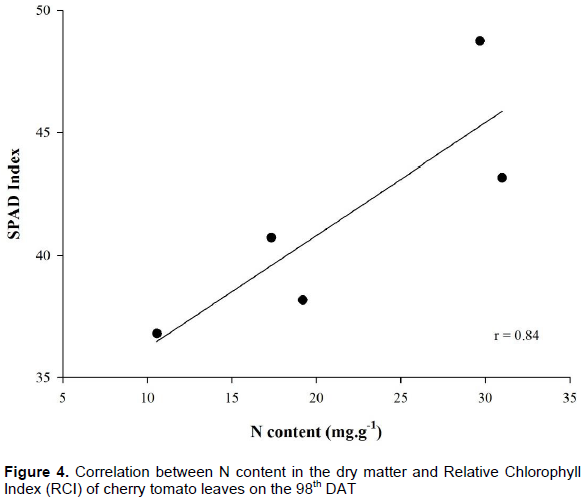
The readings for total N content and RCI (Figure 4) determined by the portable chlorophyll meter presented positive correlation of r=0.84, which indicates that the readings retrieved with the portable chlorophyll meter can be used to estimate N concentrations determined by the standard method. Pôrto et al. (2014) highlight that the portable chlorophyll meter presents indexes that correlate to N concentration in the plant, serving as an aid tool to determine indirectly N deficiency. Satisfactory outcomes were obtained about the nitrogen state of the tomato through studies from Ferreira (2006) and that of Guimarães et al. (1999).
The INS was retrieved with a portable chlorophyll meter through the relation of the values of RCI found in the leaves referent to doses 80, 160, 240 and 320 kg ha-1of N by values found in the N dose of 400 kg ha-1, considered as dose of reference. According to Braun et al. (2013) and Varvel et al. (1997) when the plant presents INS at 90 or 95% of the reading taken from the plants regarded as references, this indicates that the plant is deficient of N. It could be observed in Figure 5, that the dose of 80 kg ha-1 cherry tomato culture presented a need for N application from the 42nd DAT. For dose 160 kg.ha-1, INS was stable at 95% in the period between the 42nd and the 56th DAT and after this period the index started to decrease coming up to 50% on the 112th DAT. The dose 240 kg ha-1 of N presented INS below 95% around the 70th DAT and the dose 320 kg ha-1of N presented high INS up to the 70th DAT. It has been observed that all doses of N presented decrease in INS, staying below 95% up the 112th DAT. It demonstrates that, based on this criterion, none of the doses presented INS above 95% during the whole evaluation period.
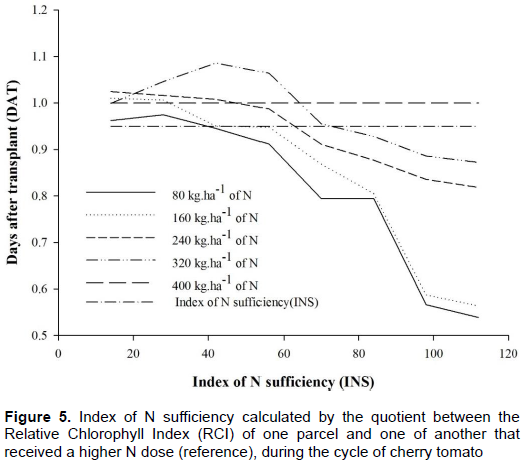
Godoy et al. (2003) studied the use of Relative Chlorophyll Index (RCI) in handling nitrogen fertilization for bell pepper plants and concluded that the INS can help and indicate the moment of the application of the nitrogenous fertilizer, enhancing efficiency of N usage. Coelho et al. (2010) varied N doses in intermissions of 0, 100, 200 and 400 kg.ha-1 of N, and found out INS lower than 95% in the doses of 0 and 100 100 kg.ha-1 of N on the 21st and 14th days after emergency respectively, and for the dose 200 kg.ha-1 of N the INS was lower than 95%.
The correlation between the readings of total N content in the cherry tomato leaves and RCI retrieved through portable equipment was 84%. RCI can be an indicator of the need for nitrogen fertilization for cherry tomato, for it has a positive correlation with N content in the leaves found in laboratory. The critical value found for cherry tomato in the readings from RCI and chlorophyll content through lab analysis remained close, indicating a good relation between both methods. Chlorophyll content in cherry tomato can be monitored by the portable chlorophyll reader without the need for analysis which destroys the leaves, yielding more economy and speed in the analysis. Increase in N doses influenced chlorophyll content in the leaf blade.
The authors have not declared any conflict of interests.
REFERENCES
|
Araújo L, Silva KJP, Lemos LMC, Milagres CC, Cardoso DSCP, Alves LC, Pereira PRG (2013). Cherry tomato grown in different concentrations of nutrient solution in hydroponic capillary. R. Unimontes Científica 15(1):18-23.
|
|
|
|
Argenta G, Silva PR, Fosthofer EL, Strieder ML, Suhre E, Teichmann LL (2003). Nitrogen fertilization in maize by monitoring the plant n level by a chlorophyll meter. R. Bras. Cienc. Solo 27(1):109-119.
Crossref
|
|
|
|
|
Amarante CVT, Stefens CA, Sangol L, Zanardi OZ, Miqueloto and Schweitzer C (2010). Quantification of chlorophylls in maize leaves by non-destructive optical methods. RBMS 9(1):39-50.
|
|
|
|
|
Braun H, Coelho FS, Silva MCC, Fontes PCR, Cecon PR, Busato C (2013). Uptake, metabolism and diagnostic of nitrogen nutritional status of potato plants. Agrária 56(3):185-195.
|
|
|
|
|
Carvalho MAF, Silveira PM, Santos AB (2012). Utilização do Clorofilômetro para Racionalização da Adubação Nitrogenada nas Culturas do Arroz e do Feijoeiro. Santo Antônio de Goiás: Embrapa, (Comunicado Técnico) P 14.
|
|
|
|
|
Coelho FS, Fontes PCR, Neves MPJ, Silva MCC (2010). Nitrogen rate associated with yield of potato and leaf nitrogen indices. R. Bras. Cienc. Solo 34:1175-1183.
Crossref
|
|
|
|
|
Coelho FS, Fontes PCR, Finger FL, Cencon PR (2012). Evaluation of potato nitrogen status based on polyphenol and chlorophyll leaf content. Pesqui. Agropec. Bras 47(4):584-592.
Crossref
|
|
|
|
|
Costa KAP, Faquin V, Oliveira IP, Araújo JL, Rodrigues RB (2008). Nitrogen doses and sources in marandu pastures. Ii - plant nitrogen nutrition. R. Bras. Cienc. Solo 32:1601-1607.
Crossref
|
|
|
|
|
Falker Automação Agrícola (2008). Falker Automação Agrícola Ltda. Manual do medidor eletrônico de teor clorofila (ClorofiLOG / CFL 1030) (2008). Falker Automação Agrícola P 33.
|
|
|
|
|
Fayad JA, Fontes PCR, Cardoso AA, Finger FL, Ferreira FA (2002). Nutrient absorption by tomato plants grown under field and protected conditions. Hortic. Bras. 20(1):90-94.
Crossref
|
|
|
|
|
Ferreira MMM, Ferreira GB, Fontes PCR, Dantas JP (2003). Tomato plants production in relation to nitrogen doses and organic fertilization for two sowing times. Hortic. Bras. 21:471-476.
|
|
|
|
|
Ferreira MMM (2006). Spad index and chlorophyll content in tomato leaves as a function of nitrogen doses and organic fertilization, at two different growing seasons. Rev. Ceres 53:83-92.
|
|
|
|
|
Ferreira MMM, Fontes PCR (2011). Índices de nitrogênio nas folhas de
|
|
|
|
|
Fontes PCR, Araújo C (2007). Adubação nitrogenada de hortaliças: princípios e práticas com o tomateiro 148p.
|
|
|
|
|
Fontes PCR, Silva DJH (2002). Produção de tomate de mesa 1. ed. Viçosa: Aprenda Fácil P 193.
|
|
|
|
|
Gil PT, Fontes PCR, Cecon PR (2002). Ferreira, F.A. SPAD index for nitrogen status diagnosis and potato yield prognosis. Hortic. Bras. 20:611-615.
Crossref
|
|
|
|
|
Godoy LJG, Bôas RL, Filho HG (2003). Nitrogen fertilization in corn crop on average as measured by chlorophyll meter and nitrogen sufficiency index (ISN). Acta Sci. Agron. 25(2):373-380.
|
|
|
|
|
Gomes FP (2000). Curso de estatística experimental. Piracicaba, Degaspari, 14ª ed. 477p.
|
|
|
|
|
Guimarães TG (1998). Nitrogênio no solo e na planta, teor de clorofila e produção do tomateiro, no campo e na estufa, influenciados por doses de nitrogênio. Tese de doutorado. Viçosa, Universidade Federal de Viçosa 184p.
|
|
|
|
|
Guimarães TG, Fontes PCR, Pereira PRG, Alvarez V, Monnerat PH (1999). Teores de clorofila determinados por medidor portátil e sua relação com formas de nitrogênio em folhas de tomateiro cultivados em dois tipos de solos. Bragantia 58(1):209-216.
Crossref
|
|
|
|
|
Lichtenthaler HK (1987). Chlorophylls and carotenoids: pigment photosynthetic biomembranes. Methods Enzymol 148:362-385.
Crossref
|
|
|
|
|
Luz JMQ, Queiroz AA, Oliveira RC (2014). Critical leaf nitrogen content in potato 'Asterix' depending on nitrogen doses. Hortic. Bras. 32:225-229.
Crossref
|
|
|
|
|
Machado MAR, Oliveira GRM, Portas CAM (2003). Tomato root distribution, yield and fruit quality under subsurface drip irrigation. Plant Soil 225(1):333-341.
Crossref
|
|
|
|
|
Neves OSC, Carvalho JG, Martins FAD, Pádua TRP, Pinho PJ (2005). Use of SPAD-502 in the evaluation of chlorophyll contents and nutritional status of herbaceous cotton to nitrogen, sulphur, iron and manganese. Pesqui. Agropec. Bras. 40(5):517-521.
Crossref
|
|
|
|
|
Pôrto ML, Puiatti M, Fontes PCR, Cecon PR, Alves JC (2014). SPAD index for diagnosis of nitrogen status in the Japanese cucumber plants under protected cultivation. Hortic. Bras. 32:292-296.
Crossref
|
|
|
|
|
Rezende IS, Amaral LR, Portz G, Molin JP (2010). Comportamento de um clorofilômetro e de um sensor ótico ativo em cultura de cana-de-açucar e milho em diferentes horários do dia. Anais do Congresso Brasileiro de Agricultura de Precisão (ConBAP), Ribeirão Preto.
|
|
|
|
|
Rocha MC, Gonçalves LSA, Corrêa FM, Rodrigues R, Silva SL, Abboud ACS, Carmo MGF (2009). Quantitative descriptors on determining genetic divergence among cherry tomatoes accessions. Ciênc. Rural 39(3):664-670.
Crossref
|
|
|
|
|
Salla L, Rodrigues JC, Marenco RA (2007). Teores de clorofila em árvores tropicais determinados com o SPAD-502. Rev. Bras. Biocienc. 5:159-161.
|
|
|
|
|
Schuelter AR, Finger FL, Casali VWD, Amaral DSL, Shimoya A (2003). Chlorophyll level evaluation in tomatoes leaves of Santa Clara cultivar, of 'firme' mutant and hybrid F1. Acta Sci., Biol. Sci. 25(1):183-187.
|
|
|
|
|
Silva AC, Costa CA, Sampaio RA, Martins ER (2011). Evaluation of heat tolerance cherry tomato lines under organic produc-tion system. Rev. Caatinga 24(3):33-40.
|
|
|
|
|
Silveira PM, Braz AJBP, Didonet AD (2003). Chlorophyll meter to evaluate the necessity of nitrogen in dry beans. Pesqui. Agropec. Bras. 38(9):1083-1087.
Crossref
|
|
|
|
|
Souza JAR, Moreira DA (2010). Evaluation of tomato fruit table produced with effluent from primary treatment of swine wastewater. Engenharia na Aricultura 18(3):198-207.
Crossref
|
|
|
|
|
Taiz L, Zeiger E (2009). Plant physiology. Sunderland: Sinauer Associates 3rd ed. P 719.
|
|
|
|
|
Varvel GE, Schepers JS, Francis DD (1997). Ability for in-season correction of nitrogen deficiency in corn using chlorophyll meters. Soil Sci. Soc. Am J. 61:1233-1239.
Crossref
|
|
|
|
|
Xu HL, Gauthier LL, Desjardins Y, Gosselin A (1997). Photosynthesis in leaves, fruits, stem and petioles of greenhouse-grown tomato plants. Photosynthetica 33:113-123.
Crossref
|
|