ABSTRACT
Ergonomics is system design compressed of man-machine and environment relationship to bring about some output against some given inputs considering different physical, anatomical, physiological, and psychological limits of human being. Based on different workloads (N) and speed (rpm), the experiment was conducted on MONARK 828E Ergometer, to evaluate heart rates of different age groups with variable weights and heights. The farm workers (both men and women) of 20-30 years age group have developed a maximum working heart rate as compared to other age groups of 31-40 and 41-50 years. The energy expenditure rate (EER) for all the farm workers obtained were graded as ‘moderately heavy’. The body mass index (BMI) of age groups 20-30 and 31-40 years were considered as ‘Normal’ and 41-50 were considered as ‘Obese Grade I’. The ponderal index (PI) of all age groups, that is, 20-30, 31-40, and 41-50 years were ‘Ectomorph’ in nature. Further, statistical analysis was performed to develop regression based prediction equation for EER using age, weight, height, heart rate, and maximal oxygen uptake (VO2max) as input variables.
Key word: Ergonomics, heart rate, energy expenditure, ponderal index, body mass index.
Ergonomics is the scientific study of the relationship between man and his working environment. It is concerned with ways of designing machines, operations, and work environments so that they match human capabilities and limitations. Its goal includes increasing the productivity in operations, decreasing the amount of effort needed to operate machines, increasing human comfort during work, decreasing accidents, and eliminating error provocative features. In brief, it can be said that the application of ergonomics aims at heightening the quality of life in work conditions. The productivity of any work environment not only depends on the quality and complexity of the tools being used, but also on the human being involved towards operating the tool and his work environment (Agrawal and Satapathy, 2006).
Normally while designing the machine human take almost care on the technical part of the machine, but they do forget about the operator. As a result, most of the controls and displays are positioned beyond normal human accessibility or they have to be operated in very cramped awkward posture. For any ergonomist, it is therefore essential to design the work environment based on the anthropometric limitations of the operations. The human body is built for action not for the rest. Once upon a time this was a necessity: the struggle for survival demanded good physical condition. But the optimal function can only be achieved by regularly exposing the heart, circulation, muscles, tendons, skeleton, and nervous system to some loading and training.
In olden days, the body got its exercise both at work and at leisure. In modern society, however, machines have taken over an ever increasing share of the tasks which are formerly accomplished with muscular power alone. Many operations increase the stress on the labor and machine operators. This stress results in an increase of heart rate (HR), energy expenditure rate (EER), and decrease of maximal oxygen uptake (VO2max) rates. The sensitivity of above three parameters depends mainly on age, weight, and height of farm workers.
In most form workers (men and women), HR monitoring provides one of the most efficient and economical means of estimating EER. In a range of approximately 90-150 bpm, which is of "flex heart rate", the relationship between HR and VO2max is linear (Rennie et al., 2001). Instead of linear relationship, a non-linear, discontinuous function is found to be more accurate in predicting EER from HR and VO2max. In addition to HR and VO2max, the factors age, weight, and height may have a significant effect in EER prediction.
Most of the previous studies have used individual calibration of the HR and EER in the prediction of energy expenditure (Luke et al., 1997). This requires that each farm worker should complete a progressive exercise test, during which HR is simultaneously measured, along with indirect calorimetry to estimate EER. This procedure is very time consuming and requires well trained healthy and active human power to complete the test. These limitations demonstrated the utility of developing prediction equations for estimating EER from the HR, age, weight, height, and VO2max in representative samples of individuals, with reasonable accuracy and the potential for wide application in epidemiological studies.
Hiilloskorpi et al. (1999) developed a multiple linear (MLR) regression based prediction equation for EER from HR on a sample of 87 healthy, active subjects (men and women). Results found that the age, weight, and gender had a significant interaction with EER. Similarly, Rennie et al. (2001) developed a MLR based prediction model using a sample of 789 individuals for estimating EER from sitting HR, age, weight, and gender. The EER prediction equation was then further validated on an independent sample of 97 individuals and found to have a correlation coefficient (r) of 0.73.
Therefore, the present study is carried out with the following objectives:
1. To study the ergonomical characteristics of farm workers such as HR, VO2max, EER, Body Mass Index (BMI), and Ponderal Index (PI).
a. With different age groups of male farm workers (20-30, 31-40, 41-50 years).
b. With different workloads (N) and speed (rpm).
c. With different heights (cm) and weights (kg) of workers.
2. To develop a prediction equation for EER from age, weight, height, HR, and VO2max as input variables.
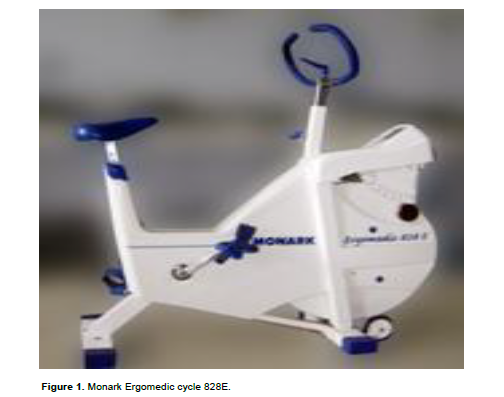
Monark Ergometer cycle 828E
This experimental analysis was done at Instrumentation Lab in the campus of College of Agricultural Engineering, Bapatla, Andhra Pradesh (India) using Monark cycle Ergometer 828E (Figure 1). The Monark Ergometer model 828E is a completely housed flywheel and further strengthened the frame. It is specially made for efficient exercise where one get immediate feedback and it has an adjustable brake system, where the brake can be set/read in Newton (N). The dependent variables are age, weights, and heights, time, workloads (N), speed (rpm), HR (beats per minute, bpm), and VO2max (ml/kg/min), whereas the EER(kJ/min) is independent variable. The farm workers three in each age group of (20-30, 31-40, and 41-50) free from respiratory or any serious health problem were selected for the study (Table 1). A total of 39 farm workers are volunteered to participate in the study. The farm workers (men and women) represented a wide range of morphology and fitness: age 20–50 years of age, body weight 42–92 kg, heights 152-185 cm, HR 172-195 bpm, VO2max 59.5-72.7 ml/kg/min, and EER 44-53 kJ/min.
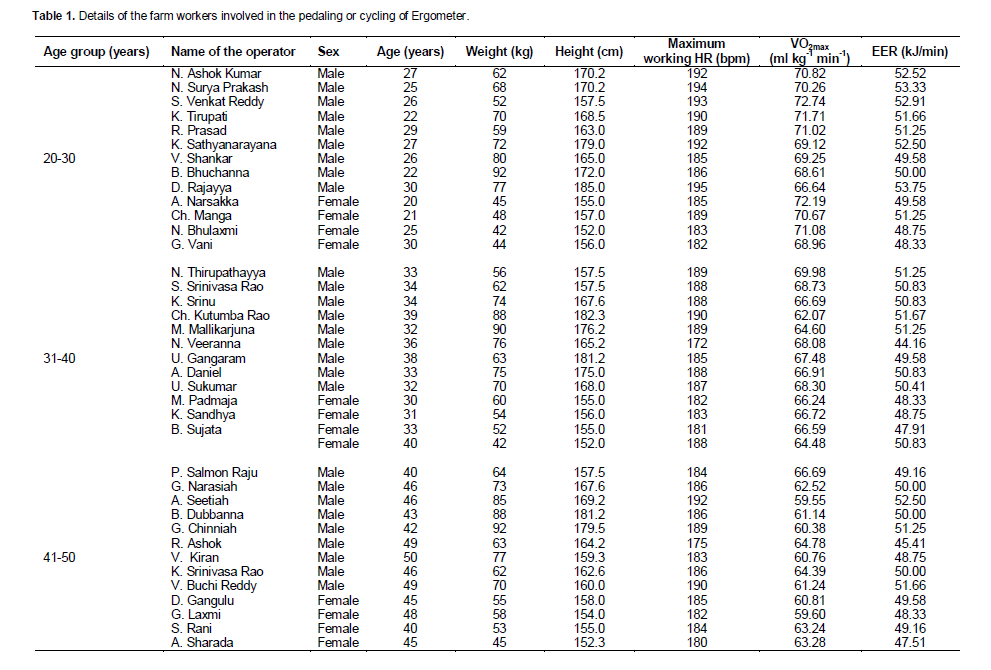
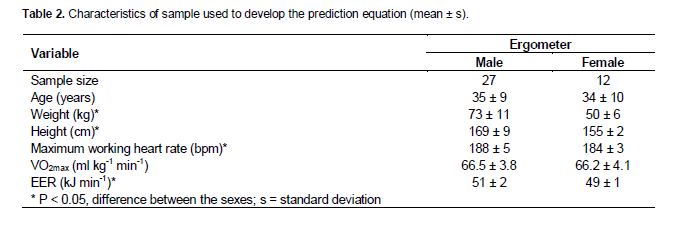
The univariate (means and standard deviations) statistical summary of farm workers is shown in Table 2. There were no differences in mean age and VO2max between the men and women participants who underwent cycling using Ergometer. There were significant differences in weight, height, maximum working heart rate, and EER between the sexes (Table 2, P<0.05). Based on this analysis, a mixed model for predicting EER is fitted in following sections. The factors age, weight, height, HR, and VO2max were modeled as fixed effects to predict EER.
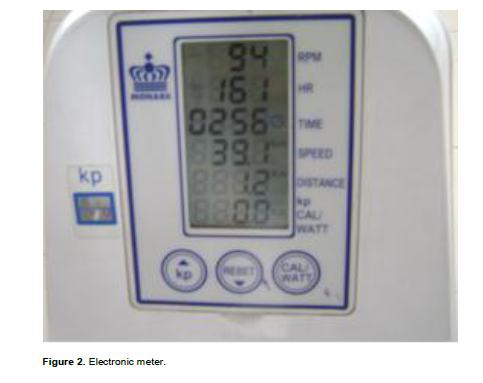
The cycle is equipped with an electronic meter (Figure 2) showing pedal revolutions per minute (rpm), heart rate (bpm), exercise time (min), an imagined cycling speed (kph), covered the distance (km), burned calories (cal), and the power on the cycle (W).
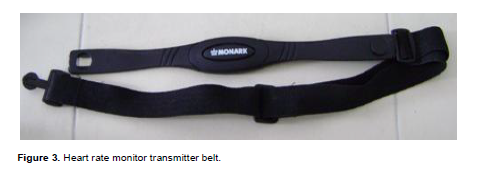
The product includes heart tronic’s new integrated transmitter/belt. This device is water resistant and may used for all water related exercises. Attach the elastic strap to the transmitter (Figure 3). Observe the each end of the transmitter has an open slot and two teeth extended slightly from the end. The heart tronic logo should be centered on the chest.
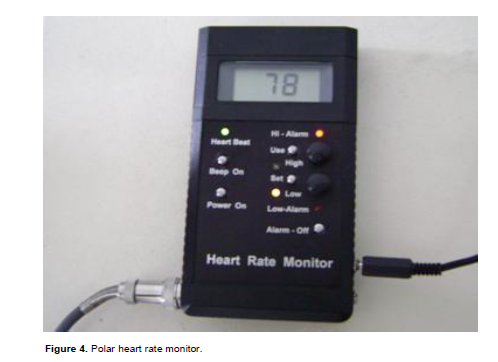
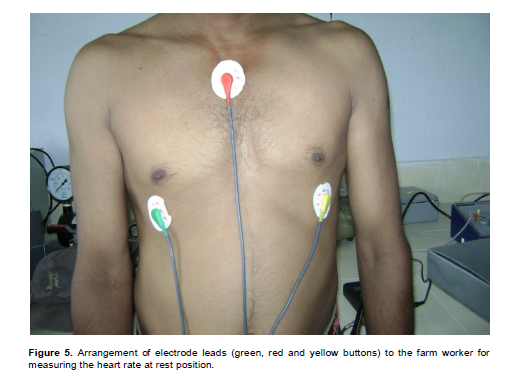
Switch ON the instrument by pressing the Power ON switch. Initially, the beat LED will flash erratically. After a few seconds, it will stabilize and will flash in accordance with the heart beat. With every LED flash a buzzer (beep) sound will be heard (Figure 4). It is very important to fix the electrodes in the proper way. Wash the skin and remove hair on the site where the electrodes are going to be placed. There should be no cut marks on the skin. Remove the transparent plastic cover sheet. Place the electrodes on the three sites (Figure 5). Then clip the sensor lead buttons to the electrodes. The weighing balance and metal wire tape has been used for measuring the weights and heights of the subjects.
Protocol of ergonomical tests
The Monark 828E software is an easy-to-use package, designed to work with Monark 828E ergometer. By using this software, three tests Astrand, WHO, and YMCA are performed.
Astrand test
The ‘Astrand protocol’ is designed to determine the VO2max by exercising the farm workers on Ergometer at a sub maximal workload and measuring the steady state HR. The workload, in conjunction with the resultant heart rate, is compared to the predicted relationship, adjusted for age and sex and VO2max is computed.
WHO test
This protocol is recommended by World Health Organization (WHO), because it is considered reliable and accurate, and it is in widespread use in many health clubs and physiological research centers throughout the world. The test uses branching multiple workloads, and takes into account the executor’s age, weight, and sex. This means that the workload is adjusted at each level to correspond those values that the WHO has recommended.
YMCA test
The YMCA protocol is based on the “Y’s Way to Physical Fitness” bicycle test. The design is a sub maximal test; using branching multiple workloads in which the next work load is determined by the steady state heart rate elicited by the previous level. Every three minutes the work load is advanced until the farm worker has completed three levels requiring a total of nine minutes. If the subject has an abnormally high heart rate response to the initial work load (110 bpm or more), the test is terminated at the end of second level. If the operator senses that the subject is experiencing difficulty completing the third level of the protocol, the test can be concluded before the third level is finished. If the test is aborted prior the end of the second level, no VO2max calculation can be done.
Computation of parameters
Energy expenditure rate (EER)
The EER is calculated using the following empirical relationship:
EER = (HR-66)/2.4 (1)
Where EER = Energy Expenditure Rate (kJ/min) and HR = heart rate (beats/min).
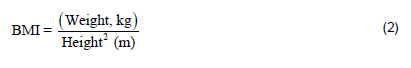
Body mass index (BMI)
BMI of the selected subjects was calculated by using the following formula:
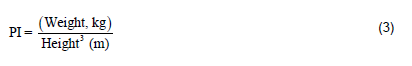
Ponderal index (PI)
Body composition was assessed using PI as given below:
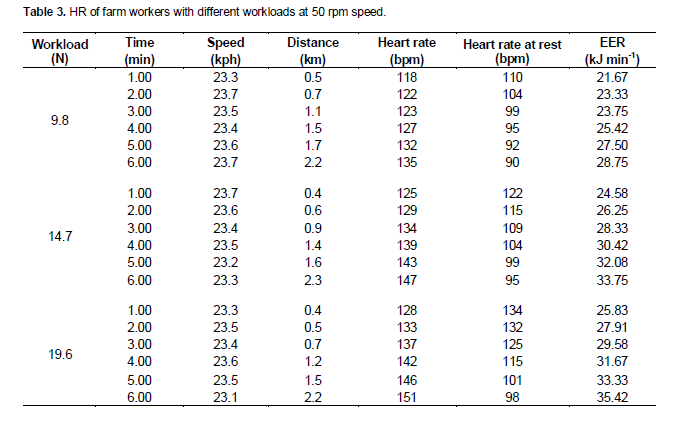
Variation of HR of farm workers with different workloads (9.8, 14.7, and 19.6 N) at 50 rpm
The variation of HR of farm workers during cycling Ergometer with different workloads (9.8, 14.7, and 19.6 N) at 50 rpm speed is shown in Table 3. At a workload of 9.8 N, the mean values of increased working heart rate (1-6 min) and decreased resting heart rate were 126.17 and 98.3 bpm graded as ‘heavy’ and ‘light’, respectively (Zander, 1973). The EER varies from a minimum of 21.67 kJ min-1 to a maximum of 28.75 kJ min-1. The mean of EER was 25.07 kJ min-1 and it is graded as moderately heavy’ (Zander, 1973).
At 14.7 N workload, the mean values of increased working heart rate (1-6 min) and decreased rest heart rate are 136.17 and 107.3 bpm, respectively graded as ‘heavy’ and ‘moderately heavy’ (Zander, 1973). The EER varies from a minimum of 24.58 kJ min-1 to a maximum of 33.75 kJ min-1. The mean of EER was 29.235 kJ min-1 and it is graded as ‘moderately heavy’ (Zander, 1973).
At 19.6 N workload, the mean values of increased working heart rate (1-6 min) and decreased rest heart rate were 139.5 bpm and 117.5 bpm, respectively graded as ‘heavy’ and ‘moderately heavy’ (Zander, 1973). The EER varies from a minimum of 25.83 kJ min-1 to a maximum of 35.42 kJ min-1. The mean of EER was 30.62 kJ min-1 and it is graded as ‘heavy’ (Zander, 1973).
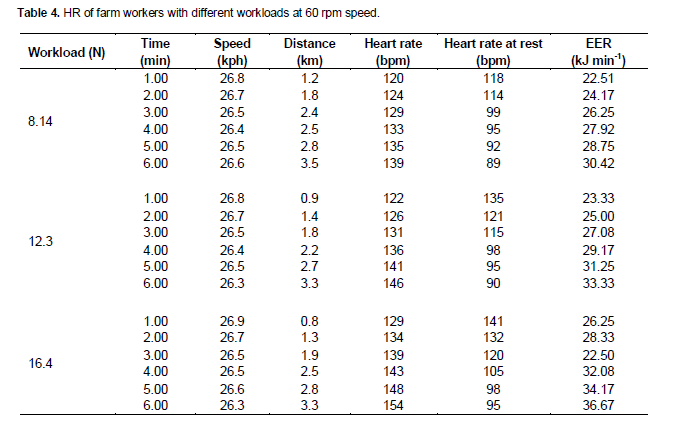
Variations of HR of farm workers with different workloads (8.14, 12.3, and 16.4 N) at 60 rpm
The variation of HR of farm workers during cycling Ergometer with different workloads (8.14, 12.3, and 16.4 N) at 60 rpm is shown in Table 4. At 8.14 N workload, the mean values of increased working heart rate (1-6 min) and decreased rest heart rate were 130 and 101.2 bpm, respectively and graded as ‘heavy’ and ‘moderately heavy’ (Zander, 1973). The EER varies from a minimum of 22.51 kJ min-1 to a maximum of 30.42 kJ min-1. The mean of EER was 26.67 kJ min-1 and it is graded as moderately heavy (Zander, 1973).
At 12.3 N workload, the mean values of increased working heart rate (1-6 min) and decreased rest heart rate were 133.67 and 109 bpm, respectively and graded as ‘heavy’ and ‘moderately heavy’ (Zander, 1973). The EER varies from a minimum of 23.33 kJ min-1 to a maximum of 33.33 kJ min-1. The mean of EER was 28.19 kJ min-1 and it is graded as ‘moderately heavy’ (Zander, 1973).
At 16.4 N workload, the mean values of increased working heart rate (1-6 min) and decreased rest heart rate were 141.2 bpm and 115.2 bpm, respectively and graded as ‘heavy’ and ‘moderately heavy’ (Zander, 1973). The EER varies from a minimum of 26.25 kJ min-1 to a maximum of 36.67 kJ min-1. The mean of EER was 29.95 kJ min-1 and it is graded as ‘moderately heavy’ (Zander, 1973).
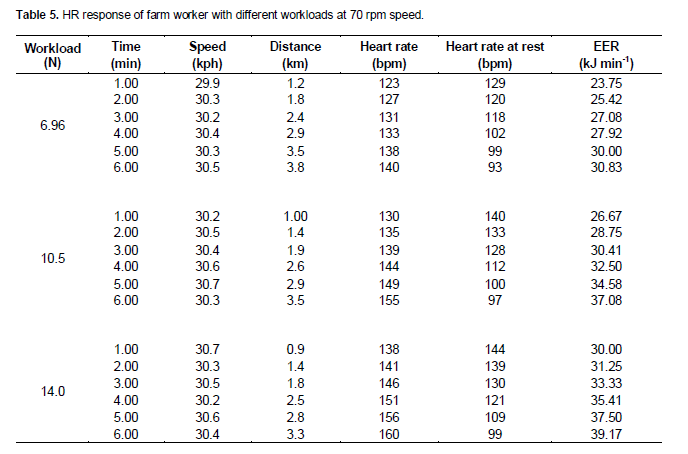
Variations of HR of farm workers with different workloads (6.96, 10.5, and 14.0 N) at 70 rpm speed
The variation of HR of farm workers during cycling Ergometer with different workloads (6.96, 10.5, and 14.0 N) at 70 rpm is shown in Table 5. At 6.96 N workload, the mean values of increased working heart rate (1-6 min) and decreased rest heart rate were 132 bpm and 110.2 bpm, respectively and graded as ‘heavy’ and ‘moderately heavy’ (Zander, 1973). The EER varies from a minimum of 23.75 kJ min-1 to a maximum of 30.83 kJ min-1. The mean of EER was 27.50 kJ min-1 and it is graded as ‘moderately heavy’ (Zander, 1973).
At 10.5 N workload, the mean values of increased working heart rate (1-6 min) and decreased rest heart rate were 142 and 118.3 bpm, respectively and graded as ‘heavy’ and ‘moderately heavy’ (Zander, 1973). The EER varies from a minimum of 26.67 kJ min-1 to a maximum of 37.08 kJ min-1. The mean of EER was 31.66 kJ min-1 and it is graded as ‘heavy’ (Zander, 1973).
At 14.0 N workload, the mean values of increased working heart rate (1-6 min) and decreased rest heart rate were 148.67 bpm and 123.67 bpm, respectively and graded as ‘heavy’ and ‘moderately heavy’(Zander, 1973). The EER varies from a minimum of 30.00 kJ min-1 to a maximum of 39.17 kJ min-1. The mean of EER was 34.44 kJ min-1 and it is graded as ‘heavy’ (Zander, 1973).
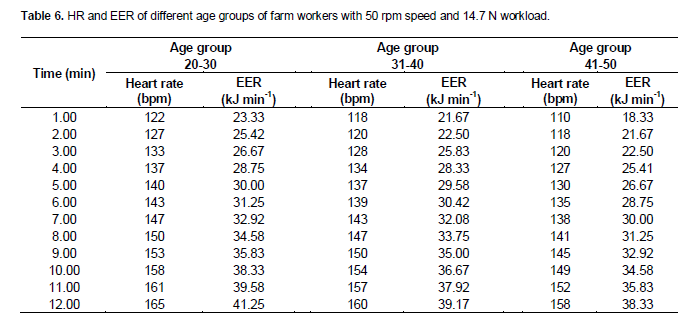
Heart rate response and EER of different age groups of farm workers with constant speed (50 rpm) and workload (14.7 N)
From Table 6, the mean values of increased working heart rate (1-12 min) and EER in the age group of 20 to 30 years were 143.58 bpm and 32.32 kJ min-1, respectively and it can be graded as ‘heavy’(Zander, 1973).
In the age group of 31-40, these values were 140.58 bpm and 31.07 kJ min-1, respectively and it can be graded as ‘heavy’ (Zander, 1973). In the age group of 41-50, these values were 135.25 bpm and 28.85 kJ min-1,respectively and they can be graded as ‘heavy’ and ‘moderately heavy’ respectively (Zander, 1973).
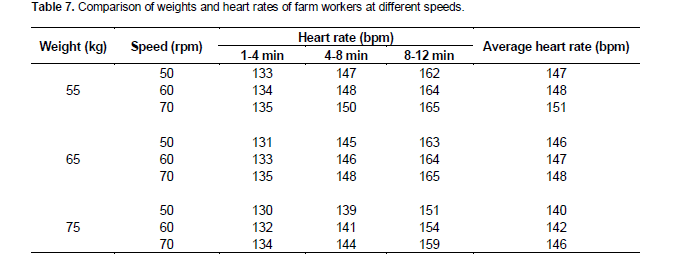
Heart rate response of farm workers at different speeds (50, 60 and 70 rpm) and weights (55, 65, and 75 kg)
The effect of heart rate with different age group workers at different weights and speeds are shown in Table 7. The mean values of increased working heart rate (1-12 min) for a weight of 55 kg at three different speeds 50, 60, and 70 rpm are 147.3, 148.67, and 150 bpm, respectively (Table 7). Similarly, the HR values at three different speeds 50, 60 and 70 rpm for a weight of 65 kg are 146, 147, and 148 bpm and for a weight of 75 kg are 140, 142.3, and 145.67 bpm, respectively.
BMI and PI of the farm workers with different age groups
The mean values of BMI and PI for the farm workers in the age group of 20-30 years were 22.51 and 13.58, respectively (Table 8) and they were graded as ‘Normal’ and ‘Ectomorph’ respectively (Garrow, 1981; Florey, 1970). Further, for the 31-40 age group, the mean values of BMI and PI values were 24.05 and 14.57 and they were graded as ‘Normal’ (Garrow, 1981) and ‘Ectomorph’ (Florey, 1970), respectively. For the age group of 41-50, the mean values of BMI and PI values were 25.33 and 15.52 and they were graded as ‘obese grade I’ and ‘Ectomorph’, respectively (Garrow, 1981; Florey, 1970).
Statistical analysis
A regression based prediction equation for estimating EER is developed with age, weight, height, heart rate, and maximal oxygen uptake (VO2max) as input variables. To develop this equation, a total of 39 form workers sample data was used. The equation was developed separately for men and women as there is a significant difference in weight, height, maximum working heart rate, and EER between the sexes (Table 2). The developed regression based prediction equations are expressed as:
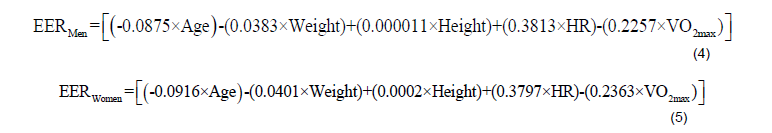
Where EERMen = energy expenditure rate for men (kJ min-1), EERWomen = energy expenditure rate for women (kJ min-1), Age is in years, Weight is in ‘kg’, Height is in ‘cm’, HR = heart rate (bpm), VO2max = maximum oxygen consumption rate (ml kg-1 min-1).
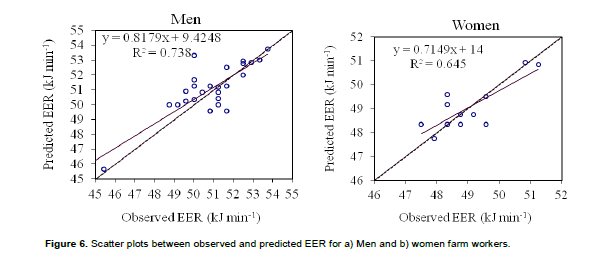
The above equations are developed in Matlab (MATLAB version 7.10.0 [Computer software]. Natick, MA, MathWorks.) software. For inner validation, both the models for women and men farm workers were tested on an independent sample of total 39 participants. The scatter plots between observed and regression model predicted EER (kJ min-1) for men and women is shown in Figure 6a and b, respectively. The fit line equations (y = a0x+a1) are shown in Figures 6a and b along with the coefficient of determination (R2) values. There is a quite good agreement between the observed and predicted EER with R2 values as 0.738 and 0.645 for both the men and women, respectively.
From the results of experimental investigation the following conclusions were drawn:
1. The farm workers of 20-30 years age group have developed a maximum working heart rate as compared to other age groups of 31-40 and 41-50 years.
2. The EER for all the farm workers obtained was graded as ‘Moderately Heavy’.
3. As the workload values increases, the heart rates of the farm workers increased.
4. The BMI of age groups 20-30 and 31-40 years were considered as ‘Normal’ and 41-50 were considered as ‘Obese grade I’.
5. The PI of all age groups, that is, 20-30, 31-40 and 41-50 years were ‘Ectomorph’ in nature.
6. The regression based equations were developed and validated for both the men and women in predicting EER from age, weight, height, heart rate, and maximal oxygen uptake (VO2max) as input variables.
The author has not declared any conflict interest.
The authors are very much thankful to the farm workers for their participation and cooperation during conducting experiment. The authors would like to express their gratitude to the College of Agricultural Engineering Instrumentation Lab, Bapatla, Andhra Pradesh, India for providing required equipment to carry out this study.
REFERENCES
|
Agrawal KN, Satapathy KK (2006). Ergonomical evaluation of plastic covered tubular maize sheller. J. Agric. Eng. 30(1-22):71-72. |
|
|
Florey CDV (1970). The use and interpretation of ponderal index and other weight-height ratios in epidemiological studies. J. Chron. Dis. 23:93-103.
CrossRef |
|
|
|
Garrow JS (1981). Treat obesity seriously a clinical manual. London, Churchill Living Stone. |
|
|
Hiilloskorpi H, Fogelholm M, Laukkanen R, Pasanen M, Oja P, Manttari A, Natri A (1999). Factors affecting the relation between heart rate and energy expenditure during exercise. Int. J. Sports Med. 20:438-443.
CrossRef |
|
|
Luke A, Maki KC, Barkey N, Cooper R, McGee D (1997). Simultaneous monitoring of heart rate and motion to assess energy expenditure. Med. Sci. Sports Exerc. 29:144-148.
CrossRef |
|
|
Rennie KL, Hennings SJ, Mitchell J, Wareham NJ (2001). Estimating energy expenditure by heart-rate monitoring without individual calibration. Med. Sci. Sports Exerc. 33:939-945.
CrossRef |