ABSTRACT
Genotype × Environment (G×E) interaction and stability performance were investigated on paddy yield of eighteen rice genotypes and twelve locations using two well renowned statistical models; genotype main effect and G×E Biplot analysis (GGE) and additive main effects and multiplicative interaction (AMMI) analysis. The aim of this study was to elucidate the performance of some advance rice lines/genotypes at multiple locations in multi environment trials (METs) using GGE biplot and AMMI analyses. The results of GGE biplot and AMMI analyses performed over the data of paddy yield at multiple locations of two years 2014 and 2015 indicated that G×E interaction plays a crucial role in determining the performance of genetic material in METs. The results declare that GGE and AMMI not only provide easy and affective evaluation of genotypes into environment interactions in a number of locations but also a comprehensive understanding of the variability of the target locations. AMMI analyses for data of both years indicated that RRI 7 was the highest priority selected genotype for six locations, NIAB 1175 for four and RRI 3 for three locations. Dhokri and Kala Shah Kaku were the highest yielding, while Faisalabad and Dhokri were the most stable environments in 2014. Likewise, Faisalabad and PARC Islamabad were the highest yielding as well as most stable environments in 2015. Basmati 515 and PS 2 were the most favorable genotypes in 2014 and 2015, respectively for their high paddy yield and stability at all locations. The results further suggested that both models were useful and presented similar interpretations about MET data.
Key words: Genotype main effect and G × E biplot analysis (GGE), additive main effects and multiplicative interaction (AMMI) analysis, rice, fine type, multiple locations.
Rice is being used as staple food by more than three billion of world population which represents 50 to 80% of their daily calorie intake (Khush, 2005; Amirjani, 2011). This population will increase to over 4.6 billion by 2050 (Honarnejad et al., 2000) which will demand more than 50% of rice needs to be produced to cope with the growing population (Ashikari et al., 2005; Srividya et al., 2010). Rice is the second most important staple food crop in Pakistan not only in local consumption but also in view of large exports (Anonymous, 2006). In Pakistan, rice was grown on approximately 2.89 million hectares with a total production of 7.01 million tonnes and earned a foreign exchange of worth US$ 1.53 billion. It accounts for 3.2% in value added in agriculture and 0.7% of Gross Domestic Product (Pakistan Economic Survey, 2015). Rice production in Pakistan is confined in four, more or less distinct agro-ecological zones. Each zone represents diverse edaphic, hydrological and climatic conditions.
Genotypes with wide adaptability, which can perform consistently well over a range of environments is required. Crop stability, is the ability of a crop to exhibit minimum interaction with both predictable and unpredictable environments (Qayyum et al., 2000). Rice yield in Pakistan is very low as compared to other rice growing countries of the world. With the passage of time, due to drastic climatic changes, there are developing vast differences in agro-climatic conditions among different locations of Pakistan. These phenomena make new developing rice varieties more unstable when grown under diverse environmental conditions and results in poor yield (Duncan, 1955). Genotype × Environment (G × E) interaction is important to plant breeder for examining yield stability of genotypes (Davis and Rutgar, 1976). Linnemann et al. (1995) stated that it is important to understand crop development in relation to biophysical conditions and changes in season when selecting well-adapted genotypes and correct planting date.
Varieties that show low G × E interaction and have high stable yields are desirable for crop breeders and farmers, because due to their genetic composition their yields are larger that indicates that the environments have less effect on the performance of genotypes. Therefore, evolution of rice varieties that have high yield and stability in performance over a wide range of environments will remain an important criterion in rice breeding (Tai, 1971). To achieve this goal, innovative statistical techniques like Genotype main effect and G × E biplot analysis (GGE) and additive main effects and multiplicative interaction (AMMI) analysis will be needed to compare the lines and testing environments in order to separate rice genotypes with high adaption capability to diverse environments for accomplishing specific socio-economic and agricultural needs (Prasad and Singh, 1990; McLaren and Chaudhary, 1994; Kueneman, 2006; Khush et al., 1979). The objective of the present study is to present the idea how to interpret results of GGE biplot and AMMI analyses to study G × E interactions and stability in performance of advance fine rice genotypes grown at different locations of Pakistan.
Studies were conducted under the agro climatic conditions of experimental farm of research area at nine different locations, viz., Dhokri, Dera Ismael Khan, Faisalabad, Gujranwala, for assessing the performance of twelve Basmati rice lines, that is, BR-1, BR-18, BR-23, DR-65, NIAB-1114, NIAB-1175, PK 8431-1-2-1-2-4, PK 8660-13-3-1, PK 8685-5-1-1-1-1, PK BB-4, Rachna-1080, and RRI-7 including two check varieties, that is, Basmati 515 and Super Basmati in 2014. While in the second year 2015, NIAB-1114, NIAB-1175, PK BB-1, PK BB-4, PK 9408-8-1-2-2, RRI-3, and RRI-7 were used including one check variety, that is, PS 2, to be evaluated in Regional Adaptability Yield Trials. One month old seedlings were transplanted at plant to plant and row to row distance of 20 cm. The experiments were sown in randomized complete block design (RCBD) in a triplicate fashion at each site. To avoid the chance of mortality, two to three seedlings per hill were placed. The fertilizer was applied at the rate of 120 N + 60 P2O5 + 0 K2O kg/ha, whereas in aromatic group at the rate of 80 N + 40 P2O5 + 0 K2O kg/ha.
During crop growth stages, standard agronomic practices were followed. The quality characters such as size (length, length/width, length/width × thickness) were carried out according (Kush et al., 1979; Sagar et al., 1988; Kawai and Amano, 1991; Singh, 1997). Paddy yield was recorded after the harvest of the crop. At maturity, yield was recorded and subjected to analysis of variance (ANOVA) as suggested by Steel and Torrie (1980) to determine the significance of genotypes, environments and genotype environment interactions. GGE biplot is being rigorously used for analyzing multi-environment trail (MET) data, which provides a working guide for breeders on biplot analysis and interpretation of results (Domitruk et al., 2001). Earlier, many studies have been interpreted using simple statistical techniques. Therefore, advance statistical techniques were used for this MET data in order to interpret three important results necessarily required in multi-location trials such as identifying high yielding and most stable genotype, best test environment and best performing genotype in specific environment. These questions become very hard in such METs that involve a large number of genotypes.
GGE biplot analysis
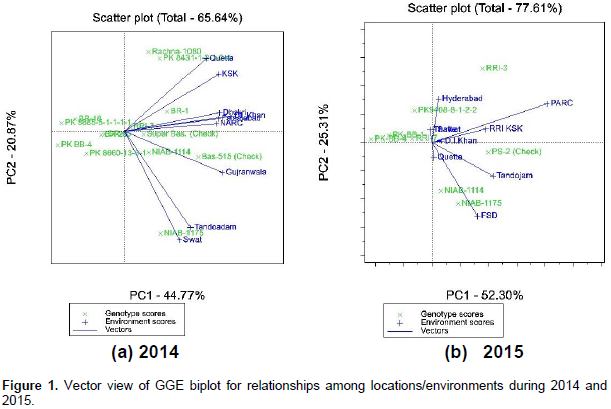
Biplots graphs (Figure 1a and b) are plotted where aspects of all the Basmati rice genotypes and environments are on the same axes so that the interrelationship can be easily depicted. Therefore, biplot 1a explains 65.64% of the total variations while Figure 1b explains 77.61% of the total variations. In both biplots, all the genotype and environment vectors are drawn showing the specific interactions between genotypes and environments. Based on Figure 1a and b, it is possible to assess both mean yields and stability performance through biplot. environments with shorter/acute angle between their vectors are more correlated while those with larger/obtuse angle are negatively correlated. Shorter the angle, higher the value of positive correlation between two locations. Presence of close associations among the environments suggests that the same information about the behavior of studied genotypes was obtained from other locations and performance of all the genotypes was same at these locations.

The location vectors are lines that connect the biplot origin and the markers of test locations and the angle between them is related to the correlation coefficient. Therefore, the results suggest to drop one of these locations in order to secure resources and any other location may be added having different environmental conditions. For example, in the year 2014, locations Dhokri, Faisalabad, D.I. Khan and NARC Islamabad have shorter angles and thus show higher correlation among themselves. Therefore, it will be wiser to consider any one of these locations next year that will be representative of all these locations in order to secure inputs. GGE biplot can also be used to interpret genotypes with similar response to the target environments. Two genotypes can be easily compared by joining them with straight lines passing through them and biplot origin. Based on Figure 1a and b, it can be visualized that genotypes that have shorter angle or are in close proximities on biplots indicate their similar response to the environments.
For example, Rachna-1080 and PK 8431-1-2-1-2-4 showed similar response to environments tested in 2014, while response of NIAB-1175 was very different in comparison with these two. NIAB-1175 and NIAB-1114 have shorter or acute angle between them indicating that these two responded similarly and the differences between them was proportional in all target locations. Genotypes located at more distance from center of biplot are less stable and near to origin genotypes are more stable (Jones, 1926). RRI-7 are more stable than NIAB-1114 in 2015. An average tester coordinate (ATC) horizontal and vertical axes is drawn such that it passes through the biplot origin and the average location and show the stability and mean yield of each genotype (Yan and Nicholas, 2006). Genotypes and environments on the same parallel line or ordinate have similar yield and a genotype or environment on the right side of the mid-point of ATC vertical axis has higher yield than those of left hand side.
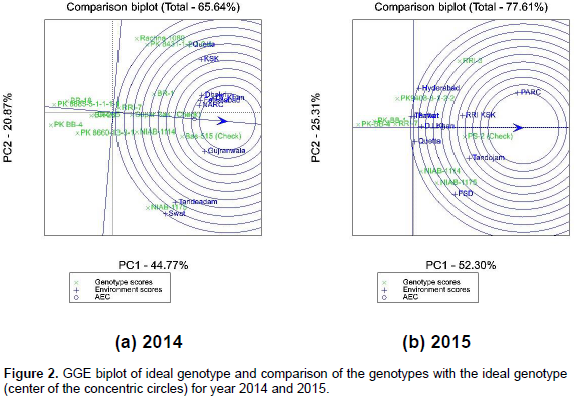
Figure 2a and b shows that PK BB-4 was the least yielding genotype among all the studied locations as the angle of its vector is obtuse with respect to all the environment vectors, in both years. While the check variety Basmati 515 was above average in 2014 and PS 2 check variety in 2015, in all the locations as indicated by the longest vector and acute angle with respect to all the other location vectors. The smaller the absolute length of projection of a genotype, the more stable it is (Fehr, 1987). The biplots in Figure 2a and b further showed that NIAB 1147, Rachna 1080 and PK 8431-1-2-1-2-4 were the least stable genotypes and showed unstable yield performance at all the locations in 2014 as indicated by longer vectors/distance from ATC horizontal. During 2015, NIAB 1175, NIAB 1114 and RRI 3 were the least stable genotypes, as indicated by the longer distances from ATC horizontal.

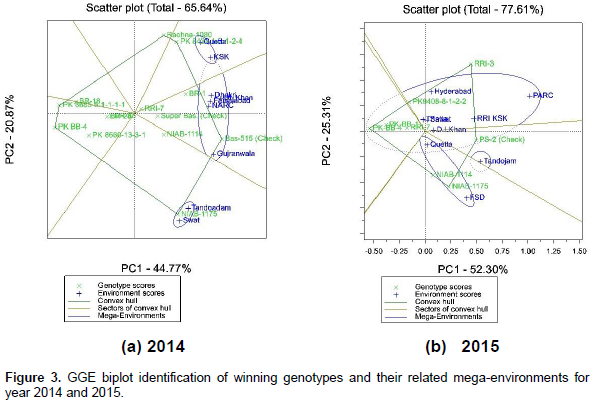
Super Basmati and RRI 7 were the most stable genotypes in 2014, while RRI 7, PK BB-4 and then PS 2 were the most stable in year 2015 as indicated by shorter distances from ATC horizontal axis (Figure 2a and b). According to the biplot shown in Figure 3a and b, the corner genotypes that are the most responsive ones, can be visually determined. These corner genotypes were PK 8685-5-1-1-1-1, Rachna 1080, Basmati 515, NIAB 1175 and PK BB 4 in 2014 whereas PK BB 4, RRI 3, PS 2 and NIAB 1175 during the next year, 2015. Further, locations are divided into three sectors or mega-environments in both years. During the first year, 2014, the first sector represents Quetta and Kala Shah Kaku (KSK) with genotype Rachna and PK 8431-1-2-1-2-4 as the most favorable genotypes. The second sector represents Dhokri, D.I.Khan, NARC Islamabad, Faisalabad, Dhokri and Gujranwala, with genotype Basmati 515 as the most favorable.

The third sector represents Tondojam and Swat, with genotype NIAB 1175 as the most favorable. Likewise, during second year 2015, first sector represents Hyderabad, PARC Islamabad, Swat, RRI Kala Shah Kaku, D.I. Khan, with genotype RRI 3 as the most favorable genotypes. The second sector represents Quetta and Faisalabad, with genotype NIAB 1175 as the most favorable. The third sector represents Tondojam, with genotype PS 2 as the most favorable. Also, those genotypes within the polygon were less responsive to location than the corner genotypes. For example, in the second sector of locations in 2014, NIAB 1114 and Super Basmati were less responsive to corner winning genotype, that is, Basmati 515 at this specific location.
AMMI analysis
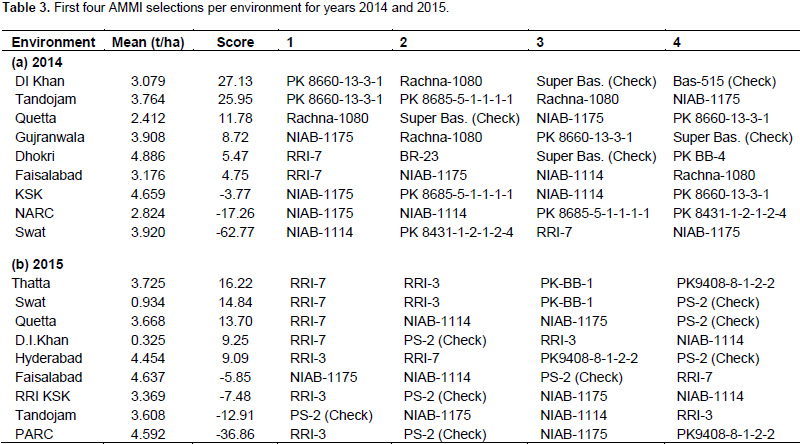
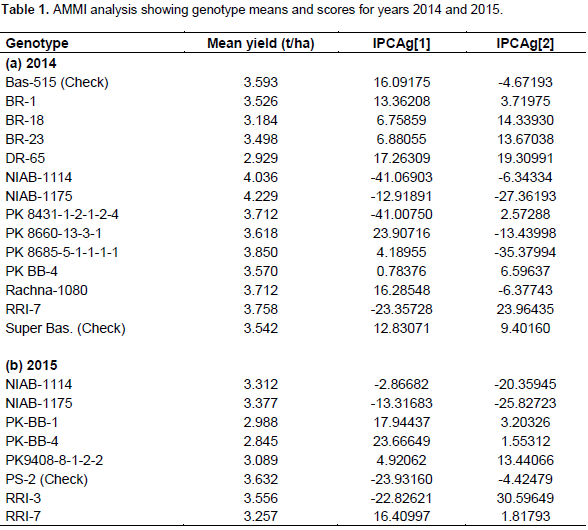
The mean paddy yield (t/ha) value (Table 1a and b) of genotypes averaged over environments indicated that the genotype NIAB 1175 has the highest (4.2 t/ha) paddy yield followed by NIAB 1114 (4.03 t/ha), PK 8685-5-1-1-1-1 (3.85 t/ha) and RRI-7 (3.75 t/ha) during the first year while during the second year PS 2 showed the highest (3.63 t/ha) paddy yield followed by RRI-3 (3.55 t/ha) and NIAB 1175 (3.37 t/ha). The environments mean paddy yield ranged from Dhokri (4.88 t/ha) to Quetta (2.41 t/ha) in 2014, whereas Faisalabad (4.64 t/ha) to DI Khan (0.33 t/ha) during the second year 2015. Table 2a and b shows IPCA[1] and IPCA[2] scores, which represent the adaptability of a genotype over environments and association between genotypes and environment (Albert, 2004). Regardless of the positive of negative signs, genotypes with large scores have high interactions and unstable, whereas genotypes with small scores or close to zero have low interaction and stable (Zobel et al., 1988).
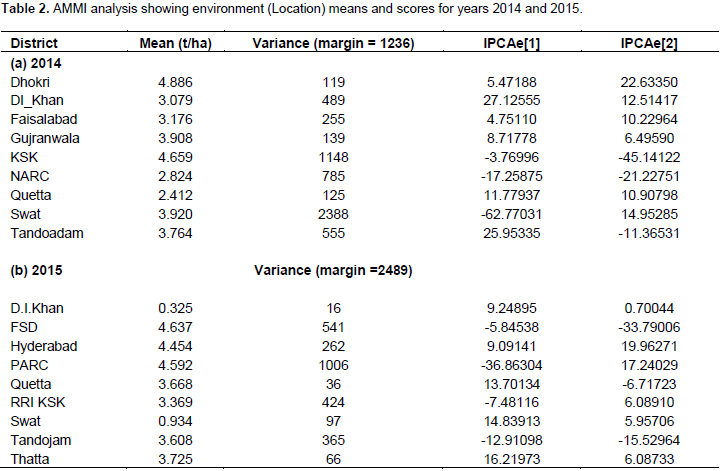
Therefore, RRI Kala Shah Kaku and Hyderabad were the most stable and rich environments while Swat and PARC Islamabad are the most unstable and poor environments among all in 2014 and 2015, respectively. The same results are shown in GGE biplot indicated by the length of the vectors. Based on IPCA[1] scores and multiplicative interaction between IPCAs of genotypes and environment, ranking of the genotypes in each environment can be visualized. Table 3a and b shows the ranking of the genotypes according to their performances in respective environments for the year 2014 and 2015, respectively. The candidate variety RRI-7 performed best in two locations (Dhokri and Faisalabad) in terms of yield and four locations (Thatta, Swat, Quetta and DI Khan) in 2014 and 2015, respectively. Likewise, genotype NIAB-1175 performed best in three locations (Gujranwala, Kala Shah Kaku and NARC) and one location (Faisalabad) in 2014 and 2015, respectively.
Genotype NIAB 1175 has the highest (4.2 t/ha) paddy yield followed by NIAB 1114 (4.03 t/ha), PK 8685-5-1-1-1-1 (3.85 t/ha) and RRI-7 (3.75 t/ha) in the first year while in the second year, PS 2 showed the highest (3.63 t/ha) paddy yield followed by RRI-3 (3.55 t/ha) and NIAB 1175 (3.37 t/ha). The environments mean paddy yield ranged from Dhokri (4.88 t/ha) to Quetta (2.41 t/ha) in 2014, whereas Faisalabad (4.64 t/ha) to DI Khan (0.33 t/ha) in the second year 2015. PK BB-4 was the least yielding genotype among all the studied locations in both the years. Super Basmati and RRI 7 were the most stable genotypes in 2014, while RRI 7, PK BB-4 and then PS 2 were the most stable in year 2015. While the check variety Basmati 515 was above average in 2014 and PS 2 check variety in 2015, in all the locations. NIAB 1147, Rachna 1080 and PK 8431-1-2-1-2-4 were the least stable in 2014, while NIAB 1175, NIAB 1114 and RRI 3 were the least stable genotypes in 2015. RRI Kala Shah Kaku and Hyderabad were the most stable and rch environments, while Swat and PARC Islamabad are the most unstable and poor environments among all in 2014 and 2015, respectively.
The authors have not declared any conflict of interests.
REFERENCES
|
Agriculture Statistics of Pakistan (2006). Ministry of Food, Agric. and Livestock, Govt. of Pakistan, Islamabad.
|
|
|
|
Amirjani MR (2011). Effect of salinity stress on growth, sugar content, pigments and enzyme activity of rice. Int. J. Bot. 7:73-81.
Crossref
|
|
|
|
|
Anonymous (2006). Agricultural Statistics of Pakistan (2006). GOP, MINFAL, Economic Wing, Islamabad.
|
|
|
|
|
Ashikari M, Sakakibara H, Lin S, Yamamoto T, Takashi T (2005). Cytokinin oxidase regulates rice grain production. Science 309:741-745.
Crossref
|
|
|
|
|
Davis MD, Rutgar JN (1976). Yield of F1, F2, and F3 hybrids of rice (Oryza sativa L). Euphytica 25:587-595.
Crossref
|
|
|
|
|
Domitruk DR, Duggah BL, Fowler DB (2001). Genotype-environment interaction of no-till winter wheat in Western Canada. Can. J. Pl. Sci. 81:7-16.
Crossref
|
|
|
|
|
Duncan DB (1955). Multiple range and multiple F test. Biometrics 11:1-42.
Crossref
|
|
|
|
|
Fehr WR (1987). Genotype x environment interaction. In: Principles of Cultivar Development, Theory and Technique Macmillan Publishing Co., New York 1:247-258.
|
|
|
|
|
Honarnejad RS, Abdollahi MS, Mohammad S, Dorosti H (2000). Consideration of adaptability and stability of grain yield of progressive rice (Oryza sativa L.) lines. Res. Agric. Sci. 1:1-9.
|
|
|
|
|
Jones JW (1926). Hybrid vigor in rice. J. Am. Soc. Agron. 18:423-428.
Crossref
|
|
|
|
|
Kawai T, Amano E (1991). Mutation Breeding in Japan. Plant Mut. Breed. Crop Improv. 1:47-77.
|
|
|
|
|
Khush GS (2005). What it will take to feed 5.0 billion rice consumers in 2030. Plant Mol. Biol. 59:1-6.
Crossref
|
|
|
|
|
Khush GS, Paule GM, Cruz NMD (1979). Rice grain quality evaluation and improvement in IRRI. Proc. Workshop on chemical aspects of rice grain quality, IRRI, Los Benos, Laguna, Philippines pp. 21-22.
|
|
|
|
|
Kueneman EA (2006). Improved rice production in a changing environment: From concept to practice. Int. Rice Comm. NWSL. 56:1-21.
|
|
|
|
|
Linnemann AR, Westphal E, Wessel M (1995). Photoperiod regulation of development and growth in bambara groundnut (Vigna subterranea). Field Crops Res. 40(1):39-47.
Crossref
|
|
|
|
|
McLaren CG, Chaudhary C (1994). Use of additive main effects and multiplicative interaction models to analyze multi-location rice variety trials. Paper presented at the FCSSP Conference, Puerton Princesa, Palawan, Philippines.
|
|
|
|
|
Pakistan Economic Survey (2015). Report of Agriculture by Ministry of Pakistan. Economic Adviser's Wing, Finance Division, Government of Pakistan, Islamabad pp. 28-29.
|
|
|
|
|
Prasad KV, Singh RL (1990). Stability analysis of yield and yield components and construction of selection indices of direct seeded rice in frost season. 20-23 October 1992. National Agril. Res. Inst. Caribbean Agricultural Research and development Institute, Guyana. Ann. Rev. Conf. Proc. pp. 63-71.
|
|
|
|
|
Qayyum A, Mufti MU, SA Rabbani (2000). Evaluation of different genotypes for stability in yield performance. Pak. J. Sci. Ind. Res. 43(3):188-190.
|
|
|
|
|
Sagar MA, Ashraf M, Akram M (1988). Grain quality of new Pakistani rice lines. Int. Rice Res. Newsl. 13:10.
|
|
|
|
|
Singh VP (1997). Variability of quality indices in aromatic rice germplasm. Int. Rice Res. Newsl. 22:22.
|
|
|
|
|
Srividya A, Vemireddy LR, Hariprasad AS, Jayaprada M, Sridhar S (2010). Identification and mapping of landrace derived QTL associated with yield and its components in rice under different nitrogen levels and environments. Int. J. Plant Breed. Genet. 4:210-227.
Crossref
|
|
|
|
|
Steel RGD, Torrie JH (1980). Principles and Procedures of Statistics. 2nd ed. McGraw-Hill, New York.
|
|
|
|
|
Tai GCC (1971). Genotypic stability analysis and its application to potato regional trials. Crop Sci. 11:184-190.
Crossref
|
|
|
|
|
Yan W, Nicholas AT (2006). Biplot analysis of multi-environment trial data: Principles and applications. Can. J. Pl. Sci. pp. 623-645.
Crossref
|
|