Full Length Research Paper

ABSTRACT
The purpose of this study was to determine the concentration of selected metals (Fe, Zn and Cu) in vegetables and the soil contaminating levels due to irrigation, using Flame Atomic Absorption Spectrophotometer (FAAS). The wet digestion and sequential fractionation extraction procedures were employed to solubilize the metals from the collected samples. The results obtained from this study showed overall concentration of selected metals Fe, Zn and Cu respectively, in the range of (358.17 to 547.17), (45.63 to 62.46) and (10.20 to 15.07) (mg /Kg) in the edible parts of sampled vegetables whereas, concentrations (mg/kg) of the metals in the soil samples were found to be in the ranges of (12051 to 20065), (69.37 to 123.77) and (68.47 to 146.10) for Fe, Zn and Cu, respectively. The modified Tessier sequential extraction procedure was used to fractionate the above three metals from the soil samples into five fractions. In this study the detected metals were predominantly concentrated in residual fraction (F5); zinc was mainly associated with the residual fraction (F5) (87.14 to 96.40%) which is highly stable. The mobility factors of Zn, Fe and Cu were 0.908 to 3.044, 0.216 to 0.443 and 0.314 to 1.968, respectively. The concentrations of Fe and Cu in the soil and vegetable samples were above the recommended limit of both WHO and FAO; also, Zn vegetable samples was above the limit. However, Zn for the soil samples was smaller than WHO and FAO recommended limit. Based on facts obtained from this study, it was suggested that concerned official body (ies) take the necessary precaution measures to clean the polluted area.
Key words: Metals, sequential fractionation, soil, vegetables, quantity.
INTRODUCTION
Metals are elements, present in chemical compounds as positive ions, or in the form of cations (+ ions) in solution. Heavy metals are among the most serious environmental pollutants due to their high toxicity, abundance and ease of accumulation by various plant and animal organisms. Increase of heavy metals in the soil can be attributed to the contribution of effluent from waste water treatment plants, industries, mining, power stations and agriculture (Guevara-Riba et al., 2004). Heavy metals are one of a range of important types of contaminants that can be found on the surface and in the tissue of fresh vegetables. Heavy metals, such as cadmium, copper, lead, chromium and mercury, are environmental pollutants, particularly in areas under irrigation with wastewater (Garcia et al., 1981). Plants take up heavy metals by absorbing them from airborne deposits on the parts of the plants exposed to the air from the polluted environments as well as from contaminated soils through root systems. Also, the heavy metal contamination of fruits and vegetables may occur due to their irrigation with contaminated water (Al Jassir et al., 2005).
Soils may become contaminated by the accumulation of heavy metals and metalloids through emissions from the rapidly expanding industrial areas, mine tailings, disposal of high metal wastes, leaded gasoline and paints, land application of fertilizers, sewage sludge pesticides, wastewater irrigation, coal combustion residues, spillage of petrochemicals, and atmospheric deposition (Khan et al., 2008). Heavy metal contamination in agricultural soils may lead to the disorder of soil functionality and retardation of plant growth, and influence human health through a contaminated food chain (Khan et al., 2008).
Sequential fractionation extraction techniques are commonly used to fractionate the solid-phase forms of metals in soils. Many sequential extraction procedures have been developed, particularly for sediments or agricultural soils, and despite numerous criticisms, they remain very useful (Christian et al., 2002). The mobility and bioavailability of heavy metal depend absolutely on their speciation or chemical forms. These forms are determined by sequential extraction technique, this method gives vivid information about metal affinity to the soil components together with the strength to which they are bound to the soil matrix. Also heavy metal fractions can give detail about soil origin, biological and physicochemical availability, and their mode of occurrence, mobility and transportation of trace metals (Kotoky et al., 2003). Some methods used in heavy metal analysis are AAS, EDXRF and ICP (Abolino et al., 2002). For analysis of various fractions obtained by sequential extraction, AAS, ICP-MS and ICP- AES and ICP-OES are used (Iwegbue, 2007). In addition, Milkessa (2013) used FAAS. ICP-MS and AAS are most preferred because they are not prone to polyatomic interferences and are less affected by matrix suppression (Harrison et al., 1981).The method used in the present study for analysis was AAS due to its availability. AAS is simple, sensitive and selective and has the advantage of being a fast method of analysis (Katz, 1984).
The aim of this study was to detect and determine the concentrations of beneficial as well as toxic metals viz. Fe, Cu and Zn in samples of soils and selected vegetables from irrigation farms around Eastern Industry Zone, in which pesticide, fertilizer, municipal and industrial sewage effluents are known to be discharged into surrounding irrigation farms. Cabbage, lettuce, and tomato were selected and most commonly consumed edible vegetables, which are cultivated by using effluent wastewater, due to lack of clean irrigation water. The study is necessary, as a large number of people consume the vegetables grown in this area. To date there is enough information research report on the levels of selected metal concentrations in soils and vegetables, to elucidate the extent of the problems posted by agricultural practice and this industry zone on the environment.
MATERIALS AND METHODS
Description of the study area
This study was conducted around EIZ in Dukem, Ethiopia. Dukem Town was founded in 1914 and is one of the 18 special zones of the Oromia Regional State of Akaki Woreda which is located at 37 Km distance from Addis Ababa City. It is a town in central Ethiopia, to the South of Addis Ababa and 10 Km to North West of Bishoftu Town. Its astronomical location is 08º45'25"-08º50'30" North Latitude and 38º51'55" 08º56'5" East Longitude (Abebe, 2012).
The EIZ of Ethiopia is located at 35 km southeast of Addis Ababa, and 680 Km from the port of Djibouti with 200 hectares of land in Dukem. For Ethiopia, EIZ is the first and largest-scale industrial park. The Ministry of Industry of Ethiopia requires the EIZ to focus on Chinese companies in the area of textile, apparel, building materials (including east steel, cement factory), mechanical manufacturing, and agricultural processing. Currently, 26 Chinese firms are operational and producing different products for export markets having agreement with EIZ in all targeted areas. In addition to the present 26 manufacturing industries, more than 20 other manufacturing industries are about to join the EIZ (Gebregeorgis, 2016). This implies that more municipal waste, gasses and wastewater from various industry of EIZ is discharged to the surrounding environment.
Chemicals, reagents and instruments
The instruments used for this study was FAAS, Agilent technology with model no. 210 for toxic heavy metal determination of vegetable and soil samples and a Mcroprossecer based PH-EC-TDS Meter; Model 1615 was used for the determination of soil pH and conductivity.
All the chemicals used were analytical reagent grade. Deionized water and distilled water were used for all preparation and dilution purposes throughout the study. Nitric acid, HNO3 (69%), ammonium acetate (NH4Ac) Sodium acetate (NaAc), potassium chloride (KCl), acetic acid (HAc), magnesium chloride (MgCl2), hydroxide hydrochloride (NH2OH.HCl), sulphuric acid, H2SO4 (98%) and hydrogen peroxide, H2O2 (30%) and hydrochloric acid (HCl) were used for digestion. Stock standard solutions of 1000 ppm were prepared for the selected metals (Fe, Cu and Zn).
All sample containers and glassware used in the present study were washed in detergent and soaked in 30% nitric acid for 2 h to leach out adsorbed metal ion. They were then rinsed in tap water followed by deionized water before drying in dust free area (APHA, 1999).
Sample collection and preparation
The soil, and vegetable samples were collected from vegetable samples in February, 2017: about 1 kg edible part of cabbage (Brassica oleracea), lettuce (Lactuca sativa) and tomato (Lycopersicon esculentum Miller). To this effect, three farmer farmlands were selected and three subsamples were taken for collecting representative edible parts of the vegetables. The collection was done manually. The representative reputable samples were thoroughly mixed to give a composite sample as representative fraction of the vegetables. The bruised or rotten portions were removed and the remaining samples were packed in polyethylene bags for transporting to the Debre Zeit Agricultural Research Center Agricultural Chemistry lab (DZARC ANRL). In the laboratory, the collected plant samples were washed with tap water and then with distilled water to eliminate adsorbed dust and particulate matters. The vegetable samples were cut and chopped into small pieces, using plastic knife in order to facilitate drying. Accordingly, the samples were air-dried for six days and further dried in hot air oven at 50-60°C for 24 h, to remove moisture and maintain constant mass. The dried samples were ground into powder using acid washed commercial mortar and pestle and then sieved to 2 mm mesh size. The sieved samples were finally stored in polyethylene bags and kept in desiccators until the time of digestion.
Soil samples (about 1 kg) were collected from 0-20 cm depth from the site where the vegetables were grown (for each vegetable type) with an auger (Poggio et al., 2008) and the control soil sample was collected 2 km away from the study area. Then the samples were placed in clean polyethylene bags and transported to the DZARC ANRL for pretreatment and analysis. The composite soil samples were air-dried in a dry and dust-free place at room temperature (25 0C) for 5 days, followed by oven drying to constant weights. The samples were then ground with a mortar and pestle to pass through a 2-mm sieve and homogenized. The dried, sieved, and homogenized soil samples were stored in clean and dry containers till digestion.
Digestion of soil and vegetable samples
The 0.5 g dried and homogenized soil samples were transferred in to 100 mL digestion flask in triplicate. In each of these flasks, 5 mL of deionized water and 30 mL of a mixture HNO3 (69%) and 37% HCl with volume ratio of 5:1 were added. The sample dissolved in the acid mixture was digested in digestion hood (at 200°C) for 1 h and kept to cool. After adding 2 mL of H2O2 to the cold digestion mixture, the final, the mixture was filtered out through Whatman No. 42 filter paper to a 100 mL volumetric flask and finally diluted to the mark with distilled water (Loon, 1985). The varying filtrates obtained above were analyzed for the total content of each heavy metal by FAAS in Holeta Agricultural Research Center Chemistry Lab. The blank reagent was also digested following the same procedure as the soil sample.
A 0.5 g of homogenized powdered vegetables sample was placed in borosilicate digestion flask to which 10 mL of acid mixture containing HNO3- HCl-H2O2 (8:1:1, v/v/v) ratio were added. The mixture was heated at 120°C over 3 h on block digester. After digestion was completed, the clear and colorless solution was filtered out into 100 mL volumetric flask. Each digestion tube were rinsed with distilled water to collect any possible residue, and added to the volumetric flask and finally made up to volume with distilled water. All the dilute samples were stored in 100 mL plastic bottles (high density polyethylene) until analysis. Each vegetable sample was digested and analyzed in triplicate to confirm precision of the result. The blank solution was prepared by taking a mixture of 8 mL HNO3, 1 mL HCl and 1 mL H2O2 and treating similarly as that of the sample (Street, 2008). The heavy metal concentrations were analyzed by FAAS in Holeta Agricultural Research Center Chemistry Lab.
Heavy metal fractionation in soil samples
The modified Tessier’s procedure, Ma and Rao (1997) and Yoseph (2015) was used to determine operationally defined chemical species of the metals from soil. Five operationally defined fractions of the metals were removed by these sequential extractions. The SEP operationally groups heavy metals into five fractions: Soluble and Exchangeable Fraction (F1), the Fraction Bound to Carbonates (F2), the Fraction Bound to Iron and Manganese Oxides (F3), the Fraction Bound to Organic Matter (F4) and the Fraction Bound to Soil Matrix (Residual Fraction) (F5).
Method detection limit
Method detection limit is defined as the minimum concentration of analyte that can be measured. In other words, it is the lowest analyte concentration that can be distinguished from statistical fluctuations in a blank (Gezahegn, 2013). Three replicate blank samples were digested following the same procedures utilized for digesting the soil and vegetable samples. Each blank were assayed for its metal contents Fe, Zn and Cu by FAAS. The standard deviation (SD) of the three replicate blanks was calculated to determine the MDL (David and Terry, 2008). Method detection limit (MDL) was then calculated according to equation indicated below:
MDL = YB +3SD
Where, YB = Blank mean.
Method validation
In the present study due to the absence of certified reference materials for soil and vegetable samples in our laboratory, the validity of the digestion procedure, precision and accuracy of FAAS were assured by spiking soil and vegetable samples with standard of known concentration. The spiked and non spiked vegetables and soil samples were digested following the same procedure employed in the digestion of the respective samples and analyzed in similar condition as shown in Appendix Table 1. Then the percentage recoveries of the analytes were calculated by:

Where, CM = concentration of metal of interest.
Statistical analysis
The analyses of variance ANOVA were performed to examine the significance level of all parameters measured. Least Significant Difference (LSD) test was used for means comparison. The level of significance for mean comparison was p<0.05. Methodological precision was therefore evaluated with standard deviation (SD).
RESULTS AND DISCUSSION
Physico-chemical analysis of soil samples
Conductivity is a measure of the ability of aqueous solution to carry an electric current that depends on the presence and total concentrations of ions, their mobility and valance and on the temperature (Mulugeta, 2014). In this work, conductivities of the soil samples collected from EIZ irrigation farmlands were determined at 25°C. In the collected soil samples growing tomato, cabbage and lettuce the conductivities were found to be 0.78±0.08, 0.50±0.01, and 0.43±0.04 mS/cm, respectively, and the control soil showed 0.84 ±0.01 mS/cm, which is significantly higher than cabbage and lettuce grown soil (Table 1). The relatively low electrical conductivity was observed in lettuce soil and relatively highest electrical conductivity was observed in tomato soil. Therefore, lettuce-growing soils are able to give a toxic amount of metal from a small amount of soil. In line with this, Murray and McBride (1994) indicated that soils with low electrical conductivity (EC) are able to give a toxic amount of metal from a small amount of soil (Hizkeal, 2012).
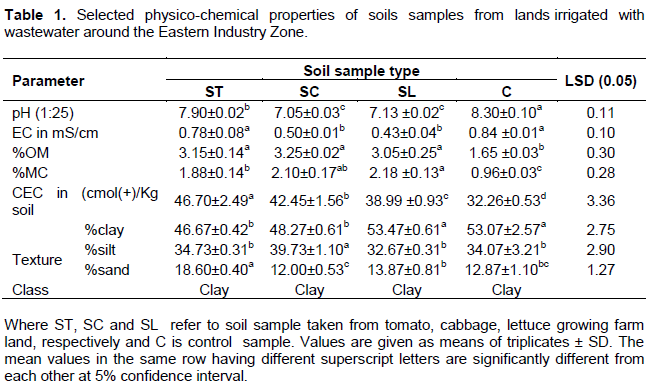
The pH value of the soils ranged from 7.13±0.02 to 8.30±0.10 (Table 1). According to Hizkeal (2012) soils with pH range of 5.6- 6.0, 6.1-6.5, 6.6-7.4, 7.4-7.8 and 7.8-8.4 are moderately acidic, slightly acidic, neutral or nearly neutral, slightly alkaline and moderately basic respectively, similarly soil with pH above 8.5 are strongly alkaline. Based on this, soil samples collected from tomato growing areas were moderately basic and soil samples collected from cabbage growing areas were nearly neutral whereas soil samples collected from lettuce growing areas were nearly neutral. Therefore, it indicates that the alkaline ranges of soils are known to limit the mobilization of heavy metals and thus minimize the uptake of heavy metals by plants (Sharma et al., 2007). Generally, most of the heavy metals are less available to plants under alkaline conditions than under acid conditions. pH is one of the factors which influence the bioavailability and the transport of heavy metal in the soil and heavy metal mobility decreases with increasing soil pH due to precipitation of hydroxides, carbonates or formation of insoluble organic complexes (Uduma, 2013). Heavy metals are generally more mobile at pH <7 than at pH >7. The amount of heavy metals mobilized in soil is a function of pH, properties of metals, redox conditions, soil chemistry, organic matter content, clay content, cation exchange capacity and other soil properties (Uduma, 2013).
Soil organic matter is a principal variable that affects the spatial distribution of heavy metals in soil (Afshin and Farid, 2007). Increase in soil organic matter content leads to elevation of soil adsorption capacity hence enhancing the accumulation of trace metals. Organic matters can therefore, be considered as an important medium through which heavy metals are incorporated into the soil (Afshin and Farid, 2007). Soil found in all type of samples investigated generally contained very high organic matter content with the highest for cabbage soil (3.25±0.02%). The organic matter content of the soil in this study area was generally higher when compared to that obtained by Inobeme et al. (2014); Gilbert and Osibanjo (2009) in a similar study for the control soil sample was 1.65±0.03%.
Cation exchange capacity (CEC) is a measure of the quantity of cations that can be adsorbed and held by a soil. CEC is used as a measure of fertility, nutrient retention capacity, and the capacity to protect ground-water from cation contamination. CEC is dependent on the organic carbon and clay in soil. In general, the higher the organic carbon and clay content, the higher the CEC. CEC is an important parameter of soil, because it gives an indication of the type of clay mineral present in the soil and its capacity to retain nutrients against leaching (Landon, 1991). The vegetable growing soil samples were obtained very high CEC in range 32.26±0.53 to 46.70±2.49 cmol (+)/kg soil indicating its very high capacity to retain the cation. According to Metson (1961), the CEC were very high (> 40 cmol (+)/ Kg, high (25 to 40 cmol (+)/ Kg), moderate and (12 to 25 cmol (+) /Kg) ranges Generally, CEC is derived from the clay and organic matter (OM) fractions (Landon, 1991) and can be affected by the different soil management practices such as cultivation, pesticide, fertilization and irrigation (Gao and Chang, 1996).
The texture class was also determined using the ‘textured triangular diagram. Soil suspension at a given depth becomes less as the particle settles. Its value at different time is related empirically to particle size, so that, by selection of times, a density can be a measure of sand, clay and silt. As indicated in Table 1, soil texture was similar for all samples. The particle size distribution of the soil showed that the soil contained higher composition of clay than silt and sand in all soil samples. Trace metals have preferential accumulation in the clay and silt fractions of soil. Generally, the concentrations of heavy metal in soil increase with decrease in the sizes of the soil particles (Inobeme et al., 2014).
Levels of heavy metals in soil samples
The concentrations of Zn, Fe and Cu in the digested samples of soil were determined by FAAS. The concentrations of these metals are presented with their respective SD in Table 2, samples iron were much higher than others in all soil types.
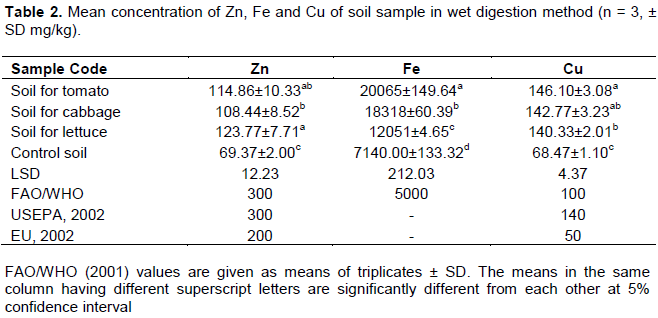
As shown in Table 2, the recorded results of accumulated metals in soil showed that iron and copper showed relatively higher values for lands irrigated with wastewater around the Eastern Industry Zone compared to zinc. This indicates that the wastewater might contain more sources of these metals.
Zinc in soil samples
The natural range of zinc in soils is 10 to 300 mg/kg (Eddy et al., 2006). Zinc is the basic component of a large number of different enzymes and plays structural, regulatory, and catalytic functions. It also has very important role in DNA synthesis, normal growth, brain development, bone formation, and wound healing. However, at high level, Zinc is neurotoxin (Adelekan and Abegunde, 2011). As shown in Table 2, the soil concentration of zinc in this study was within these natural ranges with values ranging between 108.44±8.52 mg/kg to 123.77±7.71 mg/kg. In the similar, Milkessa (2013) reported the concentration of zinc in soil samples range between 60.09-414.12 mg/kg. The soil of lettuce had the highest contents (123.77±7.71 mg/kg) of Zn, while the soil of cabbage had the smaller concentration (108.44 mg/kg) of Zn. The WHO/FAO permissible limit of zinc in soil is 300 mg/kg. So, the concentration of zinc obtained is found to be below the permissible limit set by WHO/FAO (2001).
Iron in soil samples
Iron is the most abundant and most essential constituent for all plants and animals. On the one hand, at high concentration, it causes tissues damage and some other diseases in humans. It is also responsible for anemia and neurodegenerative conditions in human being (Fuortes and Schenck, 2000). As shown in Table 2, the results indicate that soil samples contained Fe in the concentration range of 12051±4.65 and 20065±149.64 mg/kg. This is lower than the value of iron the content reported by McGrath et al. (2001) as 80000 mg/Kg for certain contaminated soil. However, other studies indicated lower values of iron as compared to what was obtained in this study. The WHO/FAO (2001) permissible limit of iron in soil is 5000 mg/kg. Therefore, the concentration of iron found in the three soil samples from lands irrigated with wastewater around the Eastern Industry Zone might be harmful for human health. Comparison of iron level in the soil samples with that of the control soil sample (7140.00±133.32 mg/kg) indicates that the higher levels obtained from all samples could possibly be attributed to the high levels of iron in the wastewater discharged from the industry zone.
Copper in soil samples
Copper is an essential trace element, it is necessary for many enzymes. It is needed for the normal growth and development. High concentration of Cu causes hair and skin discolorations, dermatitis, respiratory tract diseases, and some other fatal diseases in human beings (Khan et al., 2008). Copper content was determined in three vegetable originated soil samples. All the tested samples contained the significant amount of Cu. As shown in Table 2, above, highest level (146.10 ±3.08 mg/kg) of Cu was found in tomato soil and the soil of lettuce had the smallest level (140.33±2.01 mg/Kg) of Cu. WHO/FAO (2001) permissible limit of lead in soil is 100 mg/kg. In addition, the concentration of copper was above the concentration permissible limit set by EU (2002); USEPA (2010) as shown in Table 2. Therefore, the concentration of copper found in the three soil samples from farmlands irrigated with wastewater around the Eastern Industry Zone might be harmful for human health. Comparison of copper level in the soil samples with that of the control soil sample 68.47±1.10 mg/Kg) indicates that the higher levels obtained from all samples could possibly be attributed to the high levels of copper in the wastewater discharged from the industry zone.
Heavy metal concentration in vegetable samples
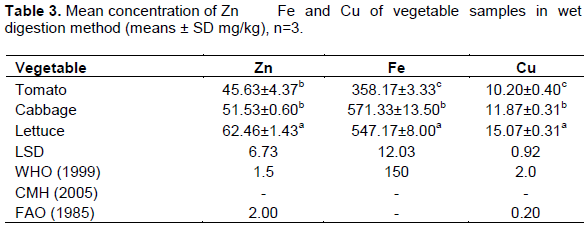
Vegetables like cabbage (Brassica oleracea L.), lettuce (Lactuca sativa L.) and tomato (Lycopersicon esculentum Miller) were analyzed for total metals content. The level of heavy metals in vegetables varies by the ability of plants to selectively accumulate some of these elements. Bioavailability of the elements depends on the nature of their association with the constituents of a soil. Additional sources of these elements for plants are rainfall, atmospheric dusts, plant protection agents and fertilizers that can be absorbed through the leaf blades (Gezahegn, 2013). The concentrations of, Zn, Fe and Cu in sample of vegetables (cabbage, lettuce and tomato) that grown with wastewater discharges of factories around EIZ irrigation farm land were presented in Table 3. From the study, it is revealed that most of the metals were accumulated to greater or lesser extents in the vegetable samples with compared to WHO standard as shown below in Table 3. The vegetables are consumed by the urban population of the city of Dukem and cities present near Dukem like Addis Ababa, Debre Zeit, etc. thus exposing the population to dangerous levels of heavy metals. The results presented demonstrate that there is a risk associated with consumption of vegetables grown on these irrigation land farm, with the vegetable still looking apparently healthy and growing well despite accumulating heavy metals to concentrations, which substantially exceed maximum values considered safe for human consumption.
The results of this study, heavy metal concentrations in vegetable samples were compared with WHO permissible values Source, WHO (1999), CMH: Chinese Ministry of Health. The means in the same column having different superscript letters are significantly different from each other at 5% confidence interval.
Distribution of zinc in vegetables
In this study, results show that the levels of zinc in the vegetables studied had a range of 45.63±4.37-62.46±1.43 mg/kg and WHO (1999) permissible limit is 1.50 mg/kg (Table 3). All the ventures exhibited very high concentration compared to the permissible limit set by WHO (1999); CMH (2005); FAO (1985). The concentration of Zn in vegetables was found to be in the order of Lettuce > Cabbage > Tomato. The high concentration of Zn and other trace heavy metals present in the parts of the vegetables may be due to the absorption ability of the plants to get the trace heavy metals from the polluted soils.
Distribution of iron in vegetables
In this study, Fe concentration from the plants sites varied between 358.17±3.33-571.33±13.50 mg/kg and WHO (1999) permissible limit is 150 mg/kg (Table 3). Akubugwo et al. (2012) reported an even higher iron metal content of up to 147.41 mg/Kg in the Amaranthus hybridus vegetables. The concentration of Fe was almost all the ventures exhibited very high concentration compared to its permissible limit. By this way, the concentration of iron in vegetables was found to be in the order of Cabbage > Lettuce > Tomato. The high concentration of Fe and the other trace heavy metals present in the parts of the plants may be due to the absorption ability of the plants to get the trace heavy metals from the polluted soils. Iron as an essential element for all plants has many important biological roles in the processes as diverse as photosynthesis, chloroplast development and chlorophyll biosynthesis (Marschner 1995). In humans, increased body stores of iron have been shown to increase the risk of several estrogen-induced cancers (Liehr and Jones, 2001).
Distribution of copper in vegetables
In this study, Cu concentration from the vegetable sites varied between 10.20±0.40-15.07±0.31 mg/kg and WHO (1999) permissible limit is 2.0 mg/kg (Table 3). The concentration of Cu in the study vegetables were ventures exhibited high concentration compared to its permissible limit set by WHO (1999); CMH (2005); FAO (1985). The concentration of copper in vegetables was found to be in the order of Lettuce > Cabbage > Tomato. The high concentration of Cu present in the parts of the plants may be due to the absorption ability of the plants to get the trace heavy metals from the polluted soils. Cu is especially important in seed production, disease resistance, and regulation of water. Copper is indeed essential, but in high doses it can cause anaemia, liver and kidney damage, and stomach and intestinal irritation (Martinez and Motto, 2000).
Heavy metal transfer factor (TF) from soil to vegetables
The transfer coefficient is therefore calculated by dividing the concentration of heavy metals in vegetables by the total heavy metal concentration in the soil (Tasrina et al., 2015).

Where, CMV = Concentration of metal in edible part of vegetable and CMS = Concentration of metal in soil.
In the present study, the TF of different heavy metal from soil to vegetable are presented in Figure 1. Higher transfer factors reflect relatively poor retention in soils or greater efficiency of vegetables to absorbs metals. Low transfer factor reflects the strong sorption of metals to the soil colloids (Wierzbicka, 1995). The TF or PCF value ranges were: Zn (0.40 to 0.50), Fe (0.02 to 0.05) and Cu (0.07 to 0.11) and the trend of TF for heavy metal in vegetable samples investigated are in order: Zn > Cu > Fe.
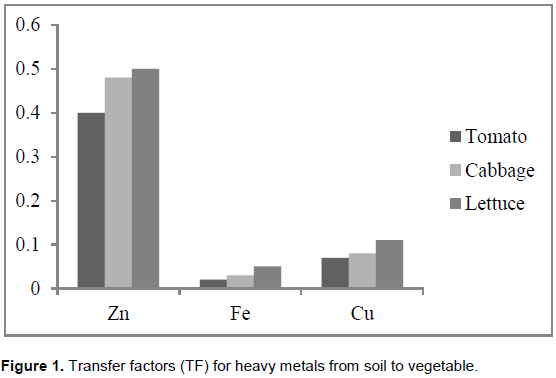
The mobility of metals from soil to plants is a function of the physical and chemical properties of the soil and of vegetable species, and is altered by innumerable environmental and human factors (Alloway and Ayres, 1997; Tasrina et al., 2015). The highest TF values were found to be 0.50 for Zn. These might be due to higher mobility of these heavy metals with a natural occurrence in soil and the low retention of them in the soil than other toxic cations (Alloway and Ayres, 1997; Tasrina et al., 2015). According to the soil to plant transfer factor (TF) calculated for tested metals and leafy vegetables consumed by the local residents, it can be concluded that Zn is high accumulator among the investigated metals. However, the higher concentrations of this metal are due to the waste water irrigation, solid waste combustion, agrochemicals and vehicular exhausts.
Comparison of metals in the plants and soil samples
Mostly, the concentrations of essential and non-essential metals are higher in soils than vegetables grown on the same soils. This indicates that only a small portion of soil metals is transferred to the vegetables and the root acts as a barrier to the translocation of heavy metals within plant (Davies and White, 1981). The concentrations of metals in the vegetables and their corresponding soil samples are given in Appendix Table 2 for the study sites. The concentrations of detected metals were found to be higher in the soil samples than in the vegetables. This may reveal that the main source of metal contents of vegetables is from their corresponding soil content, which might be affected by industrial effluent, the environmental interferences like pesticides, fertilizers, and other additives that farmers use. Variations in transfer factor among the different vegetables may be attributed to differences in the concentration of metals in the soil and differences in element uptake by different vegetables (Deribachew et al., 2015).
Determination of the concentrations of selected heavy metals in the five chemical fractions of soils
Soil has long been regarded as a repository for society’s wastes. Gradually mobilized by biogeochemical processes, soil contaminants can pollute water supplies and consequently enter the food chains. Metals, such as Zn, Fe and Cu are all potential soil pollutants. Soils consist of heterogeneous mixtures of organic and inorganic solid components as well as a variety of soluble substances. Therefore, metal distribution among specific forms varies widely based on the metal’s chemical properties and soil characteristics (Milkessa, 2012). Thus, it is important to evaluate the availability and mobility of metals to establish environmental guidelines for potential toxic hazards and to understand chemical behavior and fate of heavy metal contaminants in soils (Milkessa, 2013).
The sequential extraction used in this study is useful to indirectly assess the potential mobility and bioavailability of heavy metals in the soils. The five chemical fractions are operationally defined by an extraction sequence that follows the order of decreasing solubility (Tessier et al., 1979).
Assuming that bioavailability is related to solubility, then metal bioavailability decreases in the order: exchangeable > carbonate > Fe-Mn Oxide > organic > residual. This order is just a generalization and offers only qualitative information about metal bioavailability. Based on the above information, one can further assume that metals in the non-residual fractions are more bioavailable than metals associated with the residual fraction. The non-residual fraction is the sum of all fractions except the residual fraction. The highest amounts of metal were concentrated in the residual fraction Appendix Table 3. This indicates that metals were mostly associated with more stable soil fractions and should be less available to growing plants. The statistical analysis (ANOVA) performed on the results obtained from the sequential extraction procedure showed that metal concentrations in soil were significantly different (P < 0.05) from each other.
Zinc in soil fractionation
Percentage of zinc present in soil samples were F5 > F3 > F4 >F2 > F1 (Table 4). The greater level of zinc in the residual fraction probably indicates the greater tendency for zinc to become unavailable once it is in soils.
The mobility and bioavailability of zinc in the samples is found to be in the order of lettuce originated soil > tomato originated soil > cabbage originated soil > control sample (Table 6). Zn was mostly associated with the residual fractions and Fe-Mn Oxide fractions. Zn has the lowest concentration in the exchangeable and carbonate fractions (Table 4). The strong association of Zn with residual and organic fraction was also reported by Fayun et al. (2008) in soil collected around industrial zone. Zn has the lowest concentration in the carbonate, exchangeable and Fe-Mn oxide fractions were reported by Adekola et al. (2012).
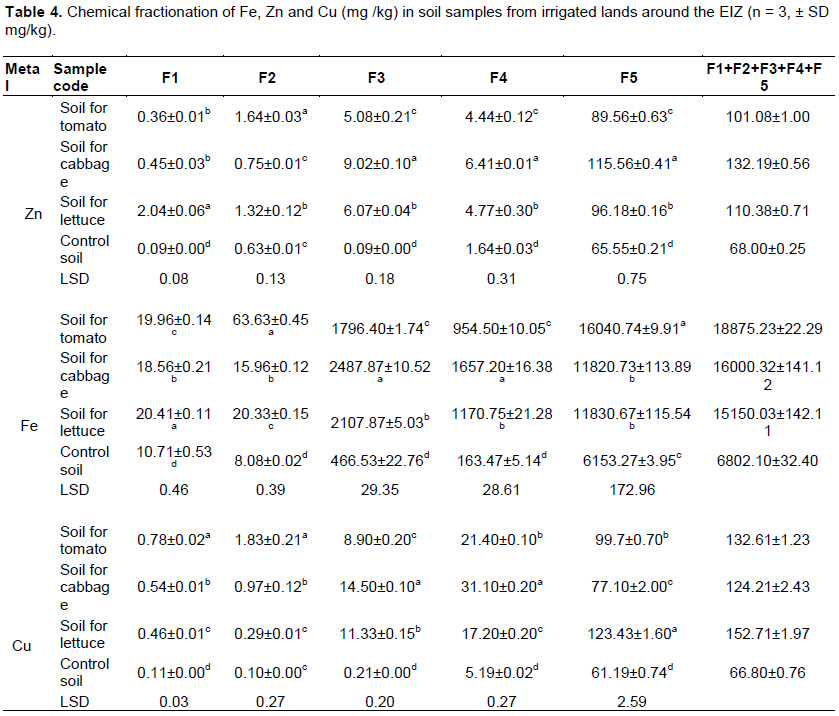
Iron in soil fractionation
Percentage of iron present in soil samples were F5 > F3> F4 > F2 > F1 (Table 4). The greater level of iron being in the residual fraction probably indicates the greater tendency for iron to become unavailable once it is in soils. A metal in F1 and F2 (soluble and exchangeable and carbonate bound) fraction is the most mobile and is readily available for biological uptake by the plant. The mobility and bioavailability of iron in the samples is found to be in the order of tomato originated soil > lettuce originated soil > cabbage originated soil > control sample. Adekola et al. (2012) reported Fe was found to be most concentrated in the residual fraction as well as in the organic and Fe-Mn oxide bound fractions to a lesser degree. However, Navas and Lindhorfer (2003) also reported Fe to be most concentrated in the residual fraction.
Copper in soil fractionation
Percentage of copper present in soil samples were F5 > F4 > F3 > F2 > F1 (Table 4). The greater level of copper in the residual fraction probably indicates the greater tendency for copper to become unavailable once it is in soils. The mobility and bioavailability of copper in the samples is found to be in the order of tomato originated soil > cabbage originated soil >lettuce originated soil > control sample. Many researchers have reported varying concentrations of Cu in different fractions. Adekola et al. (2012) reported high percentage concentration of Cu in organic matter, Fe-Mn oxide and residual fraction. The dominance of Cu in the organic phase has also been reported by others (Chukwujindu, 2007).
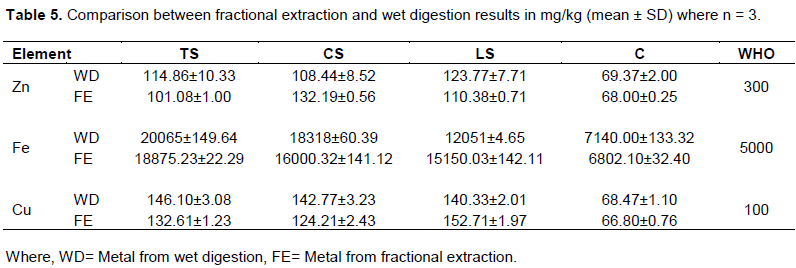
Comparison between result of fractional extraction and wet - digestion procedures
As depicted in Table 5, for all of the samples, the concentration of Zn, Fe and Cu determined in wet digestion method are found to be greater than the total concentration obtained from fractional analysis, except Fe for the cabbage soil (CS) and lettuce soil (LS) and Cu for lettuce soil. In a similar study, Yoseph (2015) reported that concentration of lead and cadmium in wet digestion method are greater than total concentration obtained from fractional analysis.
Element recoveries
Validation of the analytical results was tested by recovery experiments because there was no standard reference material (SRM), which is more preferential or needed to control the accuracy of the method studied, in our laboratory. An important consideration in the reliability of a sequential extraction data is the percentage recovery relative to a single digestion using a mixture of strong mineral acids or generally, a mixture of strong acids at the digestion of the residual phase of the sequential extraction protocol employed (Boch et al., 2002).
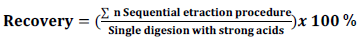
Where, n is the concentration of a given element and the single digestion with strong acids used for reference was a mixture of strong acids used in the residual fraction digestion (Boch et al., 2002). The analytical results acquired are depicted in Appendix Table 4.
Comparison of Heavy Metals Concentration from the Current Study with those Reported on the Literature
The detected metals (Zn Fe, and Cu) levels in vegetables samples (tomato, cabbage and lettuce) from fields irrigated with the Eastern Industry Zone were compared with different literature reported in Appendix Table 5.
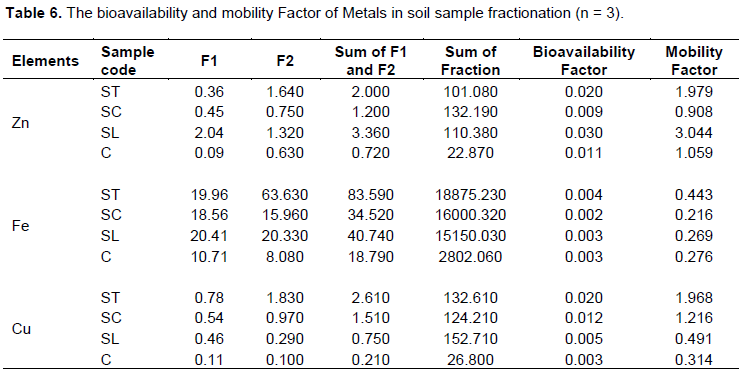
Bioavailability and mobility factors of heavy metals
The sequential fractionation extraction procedures results provided information on the potential mobility and bioavailability of the elements investigated in this research. The distribution of heavy metals in the sample allows us to predict their mobility and bioavailability. The bioavailability factor was expressed as the ratio of the available concentration of a metal in soil to its total concentration. It shows the potentials of a particular metal from the soil matrix to enter the soil solution from which it can be absorbed by plants. MF was expressed as percentage of the Bioavailability factor (Kabata and singh, 2001).
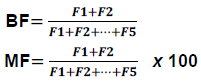
Table 6, shows the mobility, and bioavailability factors for all the sequential extractions steps. The high MF and BF values of soil Zn may be interpreted as symptoms of relatively high liability and biological availability of the metals in soil. Similar characteristics distribution patterns were observed for Cu (Table 6). The average mobility of Zn Fe and Cu levels in all the five fraction fractions were in the order: Zn> Cu > Fe.
CONCLUSION
As stated earlier, the major purpose of this study was to find out the level of metals in soil, from three-farmer farm and three subsamples from each farm for each edible part of the vegetables (tomato, cabbage and lettuce) were determined. The soil and vegetable samples were subjected to wet-digestion, sequential extraction and the concentration of detected metals were determined via FAAS. The concentration of these metals in the soil display the following decreasing trend: Fe > Cu > Zn. These concentrations of Fe and Cu except Zn in soil samples were above the recommended level set by FAO/WHO (2001), EU (2002) and USEPA (2002) for irrigation soil. The concentration of heavy metals in the vegetable samples display the following decreasing trend: Fe > Zn > Cu. The study revealed that the concentrations of all metals in the vegetables were found to be above the safe limits set by different international organizations for consumption, posing a serious health hazard to humans. Therefore, regular monitoring of soils and vegetables are essential to prevent excessive build-up of the toxic heavy metals in food. Thus, the health risk and the extent of metal contamination can be reduced. The soil–plant transfer factor (TF) decreased in the following order- TFZn > TFCu > TFFe. A sequential fractionation extraction procedure was used to fractionate Fe, Cu and Zn present in soils of tomato, cabbage and lettuce and reference (control) soils. The mobility and bioavailability of these metals were studied and a very high amount of these metals were concentrated at the residual, organic and Fe-Mn Oxide fractions. However, a very small concentration of these heavy metals was also found at the exchangeable and carbonate fractions. Mobility factor of, Fe, Cu and Zn in soil samples ranged from 0.216-0.443, 0.491-1.968 and 0.908-3.044, respectively.
CONFLICT OF INTERESTS
The authors have not declared any conflict of interests.
REFERENCES
|
Abebe A (2012). Assessment of urban expansion in the case of Dukem town using remote sensing and GIS techniques. MSc thesis, Addis Ababa University, Addis Ababa, Ethiopia. |
|
|
Abolino O, Aceto M, Mentasticti E, Sarzanini C, Petrella F (2002). Assessments of metal availability in contaminated soil, by sequential extraction. Water Soil and Air Pollution 49:345-557. |
|
|
Adekola FA, Inyinbor AA, Raheem AMO (2012). Heavy metals distributions and speciation in soil around a Mega Cement Factory in North-Central Nigeria. Ethiopian Journal of Environmental Studies and Management 5(1):11-12. |
|
|
Adelekan BA, Abegunde KD (2011). Heavy metals contaminations of soil and groundwater at automobile mechanic village in Ibadan, Nigeria. International Journal of Physical Sciences 6(5):1045-1058. |
|
|
Afshin K, Farid D (2007). Statistical analysis of accumulation and sources of heavy metals Occurrence in agricultural soil of Khoshk River banks, Shiraz Iran. America-Eurasian Journal of Agriculture and Environment 5:565-573. |
|
|
Akubugwo EI, Obasi A, Chinyere GC, Eze E, Nwokeoji O, Ugbogu EA (2012). Phytoaccumulation effects of Amaranthus hybridus L grown on buwaya refuse dumpsites in Chikun, Nigeria on heavy metals. Journal of Biodiversity and Environmental Sciences 2:10-17. |
|
|
Al Jassir MS, Shaker A, Khaliq MA (2005). Deposition of heavy metals on green leafy vegetables sold on roadsides of Riyadh City, Saudi Arabia. Bulletin of Environmental Contamination and Toxicology 75(50):1020-1027. |
|
|
American Public Health Association (APHA) (1999). American water works association, Water environment federation. Standard methods of the examination of water and wastewater, 20thed. New York: American Public Health Association, APHA, AWWA, and WPCF. |
|
|
Christian G, Sylvaine T, Michel A (2002). Fractionation studies of trace elements in contaminated soils and sediments: A Review of sequential extraction procedures. Trends in Analytical Chemistry 21:451-467. |
|
|
Chukwujindu MAI (2007). Metal fractionation in soil profiles at automobile mechanic waste dumps. Waste Management Research 25:585-593. |
|
|
David AA, Terry P (2008). Limit of blank, limit of detection and limit of quantitation. Clinical Biochemist Review 29:49-52. |
|
|
Dingkwoet DJ, So Danladi SM, Gabriel MS (2013). Comparative study of some heavy and trace metals in selected vegetables from four local government areas of Plateau State, Nigeria. Journal of Environmental Science, Toxicology and Food Technology 6(3):2319-2399. |
|
|
Eddy NO, Odoemelem SA, Mbaba A (2006). Elemental composition of soil in some dumpsites. Journal of Environmental Agricultural Food Chemistry 5:1349-1365. |
|
|
European Union (EU) (2002). Heavy metals in wastes, European Commission on Environment. |
|
|
Food and agriculture organization (FAO) (1985). Water Quality for Agriculture. Irrigation and drainage paper No. 29, Rev. 1. Food and agriculture organization of the United Nations, Rome. |
|
|
FAO/WHO (2001). Food additives and contaminants. Joint codex alimentarius commission, FAO/WHO Food standards Program 34:745-50. |
|
|
Fuortes L, Schenck D (2000). Marked elevation of urinary zinc levels and pleural-friction rub in metal fume fever. Veterinary and Human Toxicology 42(3):164-165. |
|
|
Gao G, Chang C (1996). Changes in cation exchange capacity and particle size distribution of soils associated with long term annual applications of cattle feed lot manure. Soil Science 161:115-120. |
|
|
Garcia WJ, Blessin CW, Inglett GE, Kwolek WF (1981). Metal Accumulation and crop yield for a variety of edible crops grown in diverse soil media amended with sewage sludge. Journal of Environmental Science and Technology 15(7):793-804. |
|
|
Gebregeorgis AK (2016). Ethio-China economic relations: nature of China's foreign direct investment in Ethiopia. MSc thesis, Addis Ababa University, Addis Ababa, Ethiopia. |
|
|
Gebrekidan A, Weldegebriel Y, Hadera A, Van der Bruggen B (2013). Toxicological assessment of heavy metals accumulated in vegetables and fruits grown in Ginfel river near Sheba Tannery, Tigray, Northern Ethiopia. Ecotoxicology and Environmental Safety 95:171-178. |
|
|
Gezahegn L (2013). Chemical fractionation of selected metals in the soil of waste disposal sites of Dire Dawa Textile Factory and their contents in the sweet potato Leaves. MSc. Graduate research project, Haramaya University, Haramaya, Ethiopia. |
|
|
Gilbert U, Osibanjo O (2009). Assessment of soil pollution by slag from an automobile battery manufacturing plant in Nigeria. African Journal of Environmental Science and Technology 3(9):239-250. |
|
|
Girmaye BR (2012). Heavy metal and microbial contaminants of some vegetables irrigated with wastewater in selected farms around Adama town, Ethiopia. MSc. Graduate project, Haramaya University, Haramaya, Ethiopia. |
|
|
Guevara-Riba A, Sahuquillo A, Rubio R, Rauret G (2004). Assessment of metal mobility in dredged harbour sediments from Barcelona, Spain. Science of the Total Environment 321:241-255. |
|
|
Harrison RM, Laxen DPH, Wilson SJ (1981). Environmental science and technology. Journal of Environment 38:25-32. |
|
|
Hizkeal T (2012). Determination of copper, zinc, cadmium, and lead concentrations in traffic density roadside soils in some selected town of east Ethiopia. MSc. Graduate project, Haramaya University, Haramaya, Ethiopia. |
|
|
Inobeme A, Ajai AI, Iyaka YA, Ndamitso M, Uwem B (2014). Determination of physicochemical and heavy metal content of soil around paint industries in Kaduna. International Journal of Scientific and Technology Research 3(8):221-225. |
|
|
Iwegbue CMA (2007). Determination of trace metal concentrations in soil profiles of municipal waste dumps in Nigeria. Waste Management Resource 25:585. |
|
|
Kabala C, Singh BR (2001). Fractionation and mobility of copper, lead, and zinc in soil profiles in the vicinity of a copper smelter. Journal of Environmental Quality 30(2):485-492. |
|
|
Katz SA (1984). Determination of heavy metals in sewage sludge. Environmental Chemistry 3:78-953. |
|
|
Khan MJ, Jan MT, Farhatullah, Khan NU, Arif M, Perveen S, Alam S, Jan AU (2011). The Effect of using Wastewater for Tomato. Pakistan Journal of Botany 2:1033-1044. |
|
|
Khan S, Cao Q, Zheng YM, Huang YZ, Zhu YG (2008). Health risk of heavy metals in contaminated soils and food crops irrigated with waste water in Beijing, China. Environmental Pollution Series 152(3):686-692. |
|
|
Khan SA, Liu X, Shah BR, Fan W, Li W, Khan SB, Ahmad Z (2015). Metals uptake by wastewater irrigated vegetables and their daily dietary intake in Peshawar, Pakistan. Ecological Chemical Engineering Science 22(1):125-139. |
|
|
Kotoky P, Bora BJ, Baruah NK, Baruah J, Baruah P, Borah GC (2003). Chemical fractionation of heavy metals in soil around oil installation, Assam. Chemical Speciation and Bioavailability 15(4):115-125. |
|
|
Landon JR. (1991). Booker Tropical Soil Manual: a handbook for soil survey and agricultural land evaluation in the tropics and subtropics. John Wiley and Sons Inc., New York. |
|
|
Liehr JG, Jones JS (2001). Role of iron in estrogen-induced cancer. Current Medicinal Chemistry 8:839-849. |
|
|
Liu WX, Li HH, Li SR, Wang YW (2006). Heavy metal accumulation of edible vegetable cultivated by people's of Republic of China. Bullet of Environmental Contamination and Toxicology 76:163-170. |
|
|
Loon JC (1985). Selected methods of trace metal analysis biological and environmental samples. New York 5:3685-3689. |
|
|
Ma LQ, Rao GN (1997). Chemical fractionation of cadmium, copper, nickel, and zinc in contaminated soils. Journal of Environmental Quality 26(1):259-264. |
|
|
Marschner H (1995). Mineral nutrition of higher plants, 2nd edition. Academic Press, Toronto. |
|
|
Martinez CE, Motto HL (2000). Solubility of lead, zinc and copper added to mineral soils, Environmental Pollution 107(1):153-158. |
|
|
McGrath SP, Zhao FJ, Lombi E (2001). Plant and rhizosphere process involved in phytoremediation of metal-contaminated soils. Plant Soil 232(2):214. |
|
|
Milkessa MA (2013). Chemical fractionation of selected heavy metals in the soils in The Vicinity Of Waste Water Disposal Sites in Dire Dawa Textile Factory. MSc. project work, Haramaya University, Haramaya. |
|
|
Mohod CV (2015). A review on the concentration of the heavy metals in vegetable samples like spinach and tomato grown near the area of Amba Nalla of Amravati City. International Journal of Innovative Research in Science, Engineering and Technology 4(5):2788-2792. |
|
|
Mulugeta E (2014). Determination of levels of some essential and nonessential metals in municipal water supply of west Shoa zone, Ambo town, Ethiopia. MSc. Graduate thesis, Haramaya University, Haramaya, Ethiopia. |
|
|
Murray B, McBride MB (1994). Environmental chemistry of soils, 1st edition. Oxford. |
|
|
Navas A, Lindhorfer H (2003). Geochemical speciation of heavy metals in semi-arid soils of the central Ebro valley (Spain). Journal of Environment International 29(1):61-68. |
|
|
Perveen S, Samad A, Nazif W, Shah S (2012). Impact of sewage water on vegetables quality with respect to heavy metals in Peshawar Pakistan. Pakistan Journal of Botany 44(6):1923-1931. |
|
|
Poggio M, Hepperle E, Marsan FA (2008). Metals pollutions and human bioaccessibility of topsoils in Grugliasco, Italy. Environmental Pollution 157:680-689. |
|
|
Sharma RK, Agrawal M, Marshall F (2007). Heavy metal contamination of soil and vegetables in sub urban areas of Varanasi, India. Elsevier Inc. 6:357-362. |
|
|
Street RA (2008). Heavy metals in South African medicinal plants research center for plant growth and development, PhD Dissertation, University of KwaZulu-Natal, Pietermaritzburg, South African. |
|
|
Uduma AU (2013). Sequential extraction procedure for partitioning of lead, copper, cadmium and chromium in contaminated arable soils of Nigeria. American Journal of Environment, Energy and Power Research 1(9):186 208. |
|
|
United State Environmental Protection Agency (USEPA) (2010). Risk-based concentration table. United State Environmental Protection Agency, Washington, DC, USA. |
|
|
World Health Organization (WHO) (1999). Permissible limits of heavy metals in soil and plants (Geneva: World Health Organization), Switzerland. |
|
|
Yoseph Y (2015). Chemical fractionation of heavy metals in soil around Tinshu Akaki River Addis Ababa, Ethiopia. MSc. Graduate research project, Haramaya University, Haramaya, Ethiopia. |
|
Copyright © 2024 Author(s) retain the copyright of this article.
This article is published under the terms of the Creative Commons Attribution License 4.0


