Full Length Research Paper
ABSTRACT
Bridging the yield gaps is of major concern to rice breeders and agronomists under rainfed rice cultivation. The yield performance of lowland and upland rainfed rice varieties was investigated in farmers’ and researchers’ field conditions at four locations in Ifakara. Selected agronomic practices namely; recommended fertilizer (80 kgN/ha), spacing of 20 cm × 20 cm, weed free fields and high yielding varieties of TXD306, Komboka and Tai for lowland rainfed, and NERICA1, NERICA2 and NERICA4 for upland rainfed rice. Moreover, farmer selected varieties Supa India and WahiPesa were used as the local control in this research. The study revealed that yield performance of lowland rainfed rice varieties and in farmers’ fields ranged between 2.9 and 6.9 t ha-1, while in the upland rainfed rice the yield ranged between 2.5 and 5.4 t ha-1. This was similar to yield that was obtained from the researchers’ fields which ranged between 2.4 and 8.5 t ha-1 in lowland and between 1.8 and 4.8 t ha-1 in upland fields. The yield gap analysis revealed that the gap of between 35 and 60% previously reported in lowland rice was narrowed to 0 to 12.1%, while in the upland rice from 24.5 to 28.6% previously reported to 0% and excess yield over the potential yields and yields previously reported by farmers. The performance of all improved rice varieties at farmers and researchers’ field were significantly higher compared to the local check varieties Supa India and WahiPesa. It was concluded that, providing farmers with selected good agronomic practices and supervision of farmers in field management activities enhanced rice productivity under farmers’ conditions and narrowed or bridged the yield gaps that existed.
Key words: Upland rice, good agronomic practices (GAPs), lowland rice, productivity, yield gaps.
INTRODUCTION
Rice (Oryza sativa L.) is one of the most important cultivated crops in the world. Rice has been reported to be grown on more than 162 million hectares worldwide by 2010 (GRiSP, 2013). In Tanzania, rice is the second important staple cereal crop next to maize in terms of production and consumption (MAFSC, 2009; Mghase et al., 2010; USDA, 2013) and ranks first in Ifakara area, Kilombero district. A total area of 330,000 ha of land is suitable for rice cultivation in the country (MAFSC, 2009). About 72% of the land for rice is under rainfed lowland rice ecosystem, while 20% of it is under upland rainfed rice ecosystem, making a total of about 92% rice production in Tanzania from rainfed ecosystems. Only 8% rice cultivation in Tanzania is under irrigated rice ecosystem. However, rice yield under rainfed ecosystems in Tanzania is always lower due to moisture stress as well as use of low yielding local varieties grown with or without fertilizer application in farmers’ fields (GRiSP, 2013).
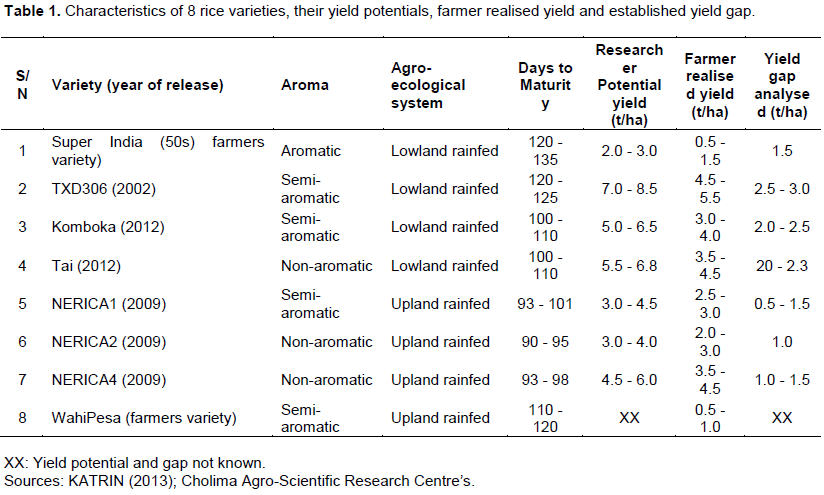
Despite the release and dissemination of improved rice varieties in the rainfed rice ecosystem such as NERICAs (New Rice for Africa), that is, NERICA1, NERICA2, NERICA4, and NERICA7 with potential yields ranging between 3.0 and 7.0 t/ha in upland ecosystem and TXD306, TXD 88, TXD 85, Tai and Komboka with potential yields ranging between 5.0 and 8.5 t/ha in lowland ecosystem which was released between 2000 and 2012, the farmers have not yet bring their yield close to the yield potentials realized by researchers (Katrin, 2013). The rice yields in farmers’ fields have been reported far below the potential yield. For example, a report by GRiSP (2013) which showed yields from farmers fields ranged between 0.8-1.0 and 1.5-2.0 t/ha in the upland and lowland rainfed ecosystems, respectively. These yields are far lower from the potential yields established by researchers (Katrin, 2013).
Another report established by Agricultural research institutes KATRIN and Cholima Agro-Scientific Research centres (Table 1), showed that the yields from farmer fields ranged between 0.5 and 5.5 t/ha in lowland rice depending on the variety used. While in the upland rice ecosystem yield ranged between 0.5 and 4.5 t/ha with use of improved NERICA rice varieties. Crop production capacity can be evaluated by estimating potential yield and water-limited yield levels as benchmarks for crop production under rainfed conditions. The differences between these theoretical yield levels and actual farmers’ yields define the yield gaps (Van Ittersum et al., 2013), and particularly explicit knowledge about these yield gaps is essential to guide sustainable agricultural intensification. However, specific constraints reported to dictate the productivity and yield potential of different locations, and therefore location specific management changes and interventions are required to close the observed yield gap (Mueller et al., 2012). In order to boost rice productivity and reduce yield gaps in Ifakara the ecosystem specific analyses of yield gaps were very potential in addressing the yield production constraints of selected rice varieties under rainfed environment.
The study analyzed the upland rainfed and lowland rainfed rice varieties separately to quantify the yield gap (Yg), that is, the difference between water-limited yield potential at researchers’ field (Yw) and actual yield (Ya) at farmers’ field. The study found a yield gap of between 35 and 60% in lowland rainfed rice ecosystem. While in the upland rainfed rice ecosystem a yield gap of between 24.5 and 28.6% was found between farmers obtained yields and the researchers yield potentials (Katrin, 2013; Merlos et al., 2015). Therefore, intervention plans to boost farmer yield outputs closer to expected yield potentials established by researchers was found essential at the study site in Ifakara.
Previous studies on use of good agronomic practices reported that good plant spacing, use of improved varieties, and use of fertilizers increased the yields under farmers’ field conditions in other areas (Zaman et al., 2013; Saito et al., 2010; Meertens et al., 2003). However, the low level of rice production and productivity at Ifakara and Tanzania in general are caused by several reasons including small holder farmers’ limited access to rice information (Ronald et al., 2014; Mkanthama, 2013). According to Chapman and Tripp (2003), there are concerns with poor performance of public extension, including its inability to consistently deliver useful information to resource-poor farmers. The good agronomic practices and technologies reported were not very well known to most farmers cultivating rice on small scale in Ifakara. In order to increase their production, access to good agronomic practices (GAPs) such as improved seed varieties, plant spacing, fertilizer and application rate, weeding time and frequency practices were needed.
The resulting growth and yield performances of selected eight rice varieties under farmers and researcher growing condition were analyzed to investigate how (GAPs) is effective on closing or narrowing the previously reported yield gap.
MATERIALS AND METHODS
Description of the study sites
The study was undertaken in Ifakara area, Kilombero district, which lies between 8° 04’ to 8° 15’ South and 36° 65’ to 36° 69’ East, at an altitude ranging between 257 and 330 m above sea level. The field experiments were carried out at the following four locations in rainfed conditions. Two farmers managed fields were at Kibaoni (08° 07’ S and 36° 68’ E) and Michenga (08° 12’ S and 36° 66’ E). The two researcher managed fields were at the Agriculture Research Institute KATRIN (08° 04’ S and 36° 68’ E) and Lumemo substation (08° 15’ S and 36° 67’ E).
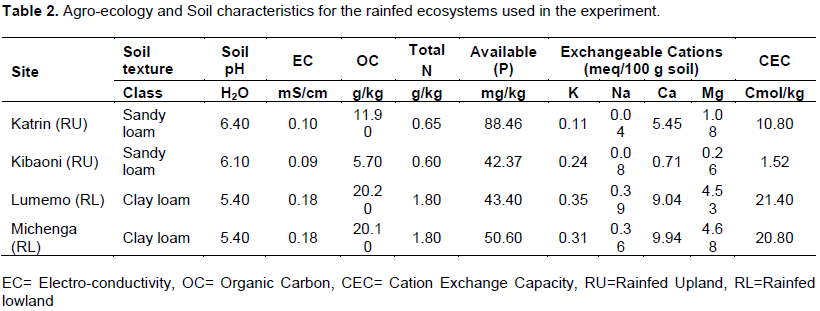
In an attempt to bridge the yield gaps between farmers and researchers yields, the farmers and researchers applied the same agronomic practices (GAPs) such as rice varieties, spacing of 20 × 20 cm2, fertilizer at same rate of 80 kg N/ha, weeding frequency of two time in a season, seeding in line, and thinning to two seedling per hill. The researcher was monitoring all the field management activities accomplished. Ifakara site is considered to have high potential for rice productivity growth; its climate reported to be sub-humid tropical, with an average of 1400 mm per annum and the annual temperature ranged between 28 and 33°C (Katrin, 2012). The area is generally gently sloping with an alluvial sandy loam soils on the flat area and the upper zone is dominated by pale sand of granitic gneiss origin (Katrin, 2012).
Experimental design and crop management
The experiments were carried out under the field condition in a randomized complete block design (RCBD) layout, in plot sizes of 40 m2 with four replications. Experimental units comprised twenty-rows of 10 m length each, with row-to-row spacing of 20 cm and plant-to-plant spacing of 20 cm. Spacing between blocks and between plots were 1 and 0.5 m, respectively. Five seeds were directly sown per hill. After germination the seedlings were thinned to two plants per hill for both farmers field and researcher field conditions in the upland rice and lowland rice ecosystems.
The yield potential and yield gap previously reported for the varieties used in this study are summarized in Table 1. The soil status of the plots before sowing is shown in Table 2. All plots in farmers managed field and researcher managed fields were fertilized with a standard rate of 80 kg N/ha of urea applied at the effective tillering stage by broadcasting method. Weeding was done twice at vegetative and at maximum tillering stages.
Data collection and sampling techniques
Data were collected on some phenological growth and yield components traits such as days to 50% flowering and 90% maturity, and above ground biomass (SDt), number of tillers, and plant height. Others traits were yield and yield components including number of panicles, total number of spikelets per panicle, number of fertile spikelets per panicle, thousand grain weight and grain yield.
Measurement of yield and yield components
An area of 1 m2 was sampled for yield and yields components analyses. The total number of panicles, number of fertile and sterile spikelet per panicle was counted from 5 randomly selected panicles in the 1 m2 plot areas. The 1000 grains were physically counted and weighed to get the 1000 grains weight in (g) at 14% grain moisture content using the procedures described by (Gomez, 1972).
Biomass yield
The total sun-dry weight of the above ground biomass of plants occupying the 1 m2 area were weighed at maturity, then converted to tons per hectare (tha-1) as described by Fageria (2010), whereby plants in a sampling area were cut at 4 cm above the ground and sun dried for three days and weighed to get the total biomass weights above the ground then threshed to get the grain weight. Then the straws were dried at 80°C until a constant dry weight obtained.
Grain yield
This was taken as the total grain weight per plot in grams after threshing then converted to tons per hectare (tha-1). The grain yields of the selected rice varieties were determined according to (Yoshida, 1981) as follows:
GY= (P × SP × FS × 1000GW × 10-5) (1)
where GY is grain yield (tha-1), P is number of panicles (m-2), SP is number of spikelets per panicle, FS is percentage filled spikelets or grain and GW is 1000-grain weight (g).
Grain harvest index (HI)
This was taken as the ratio of grain weight to the total above ground biomass yield computed from an area of 1 m2. This index was obtained using the relationship established by Fageria (2010) where,
HI = Grain weight (g) / Total weight above ground (Grain + Straw) g (2)
Data analysis
The data obtained in the experimental field trials were subjected to analysis of variance (ANOVA) using (GenStat, 2011) 14th edition and Excel (Microsoft) for graphs and tables. Mean separation was done using Tukey’s significance difference test, and the treatments were compared at (P≤ 0.05).
RESULTS
Phenological and growth characteristics of selected rice varieties
Phenological characteristics
The selected improved rice varieties and two local rice varieties varied over genotype and environment (Table 3). For example, the 50% flowering time in upland and lowland rainfed rice ecosystems, varied among rice genotypes and the site, respectively. The period to 50% flowering was longer in the lowland rainfed rice ecosystem than in the upland rainfed rice ecosystem (Table 3). Flowering for Michenga lowland site was about 69 to 87 days depending on the rice genotypes, and was shorter than that of Lumemo site about 9 to 11 days, while in the Upland rice sites; the days to 50% flowering of all rice genotypes at Kibaoni were shorter by 4 to 5 days compared to that at KATRIN site although such differences were not statistically significant. NERICA 2 had slightly the shortest 50% flowering than all other upland rice genotypes at both Kibaoni and KATRIN sites. The farmers variety (WahiPesa) delayed by 8 to 9 days to reach 50% flowering compared to NERICA2, which was earliest variety at Kibaoni and KATRIN sites (Table 3).
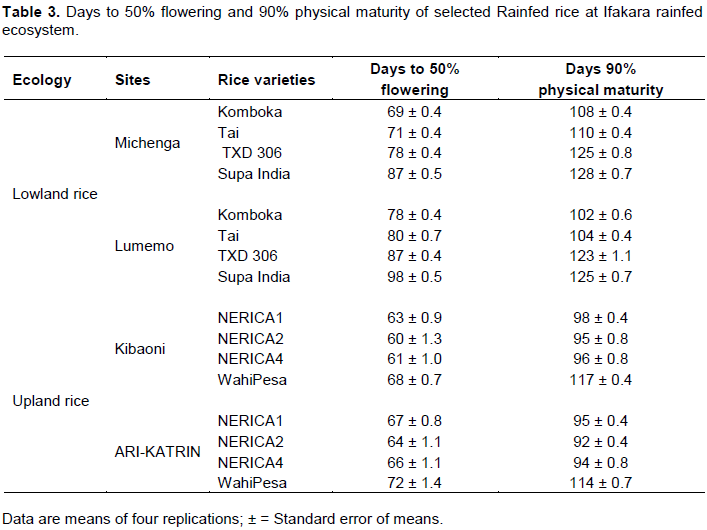
The 90% physical maturity time in both upland and lowland rainfed rice ecosystems varied among rice genotypes and the sites (Table 3). Varieties Komboka and Tai were matured earlier compared to TXD 306 (SARO5) and Supa India by 15 to 18 and 19 to 23 days at Michenga and Lumemo sites, respectively (Table 3). The farmers’ variety Supa India matured relatively same as TXD 306 (SARO5) though delayed by 3 to 2 days.
For the Upland rice ecosystem, the 90% physical maturity was relatively the same at Kibaoni and at KATRIN upland rice sites, though delayed by 2 to 3 days longer at Kibaoni. NERICA 2 had the shortest 90% maturity than all other upland rice genotypes both at Kibaoni and KATRIN. The local variety (WahiPesa) delayed by 22 days to reach 90% physical maturity compared to NERICA2, the earlier variety at Kibaoni and KATRIN sites, respectively (Table 3).
Growth characteristics
In the lowland rainfed ecosystem, the number of tillers in the lowland rainfed rice ecosystems was significantly greater at the Lumemo researcher managed site for the improved rice varieties Komboka, Tai and TXD 306 than at Michenga farmer managed site. However, at both sites the local variety Supa India produced significantly lower number of productive tillers compared to other rice varieties tested (Figure 1A). At Michenga farmer managed site, there was no significant difference between Komboka and Tai varieties in the number of tillers per unit area, where a decreasing trend in number of tillers from Komboka, Tai, TXD306 and Supa India was observed (Figure 1A).
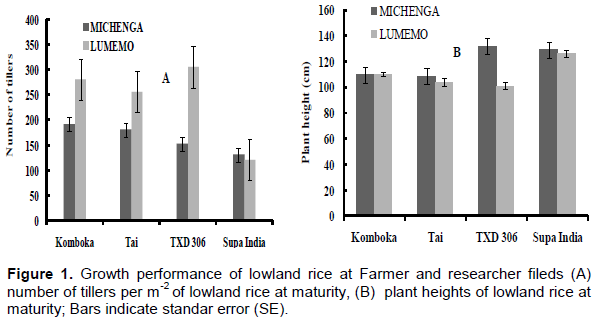
Rice plant height under lowland rainfed rice ecosystem were not significantly different regardless of sites for Komboka, Tai and Supa India, while TXD 306 variety showed significant difference among the sites (Figure 1B). At Michenga farmer managed site, TXD 306 was significantly taller than at Lumemo researcher managed site. This characteristic was against the normal plant height behavior for TXD 306. Supa India, the local check variety of the farmers showed the tallest plants regardless of sites (Figure 1B).
In upland rainfed rice ecosystem, the number of tillers varied significantly with varieties both at Kibaoni farmer managed site and at ARI-KATRIN researcher managed site. The local check variety, WahiPesa produced relatively similar small number of tillers both at Kibaoni (farmer managed) and ARI-KATRIN researcher managed sites (Figure 2A).
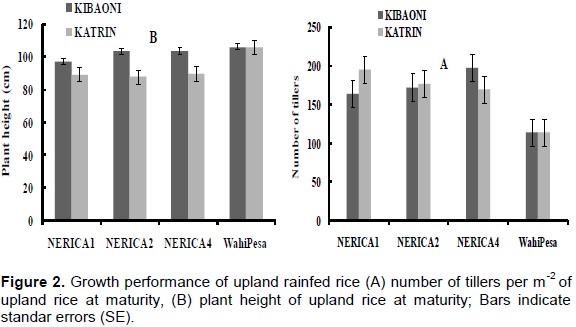
The plant height in upland rainfed ecosystem significantly differed among the sites (Figure 2B). At Kibaoni all varieties showed no difference in plant heights, while at ARI-KATRIN researcher managed site, WahiPesa local check variety was the tallest than all other upland rainfed rice varieties grown. All NERICA’s varieties showed no significant difference in plant heights regardless of sites (Figure 2B).
Yield and yield components
Biomass yield (Dry weights)
The total biomass yield (straw plus grain weights) in the lowland rainfed rice ecosystem was significantly different among sites (Figure 3A). The total biomass yield of all selected lowland rainfed rice plus the local check variety produced significantly larger biomass yield at Lumemo researcher managed site compared to Michenga farmer managed site. However, the farmers’ variety Supa India produced the smallest total biomass yield at both Michenga and Lumemo sites. The improved lowland varieties TXD 306, Komboka and Tai produced significantly larger total biomass yield than the local variety Supa India at Lumemo researcher managed site, and Michenga farmer managed sites (Figure 3A).
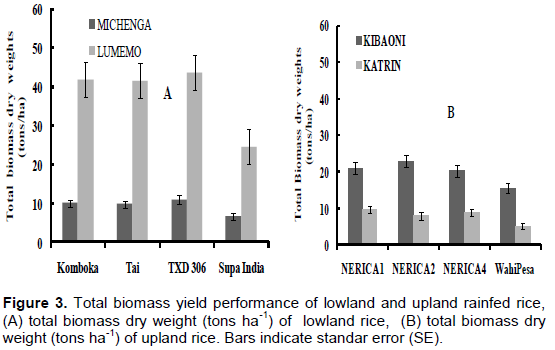
In the upland rainfed rice ecosystem, the total biomass yield of all selected upland rice varieties including the farmers local check variety, showed significantly higher total biomass yield at Kibaoni farmer managed site than that produced at ARI-KATRIN researcher managed site (Figure 3B). NERICA2 produced the largest total biomass yield at Kibaoni followed by NERICA1 and NERICA4, WahiPesa the farmers’ local check variety produced the smallest total biomass yield. NERICA2 had a significantly larger biomass yield compared to that from the farmers’ local check variety WahiPesa. The farmers managed upland rainfed rice site at Kibaoni produced significantly higher total biomass yield than the researcher managed upland rainfed rice site at AR-KATRIN (Figure 3B).
Grain yield
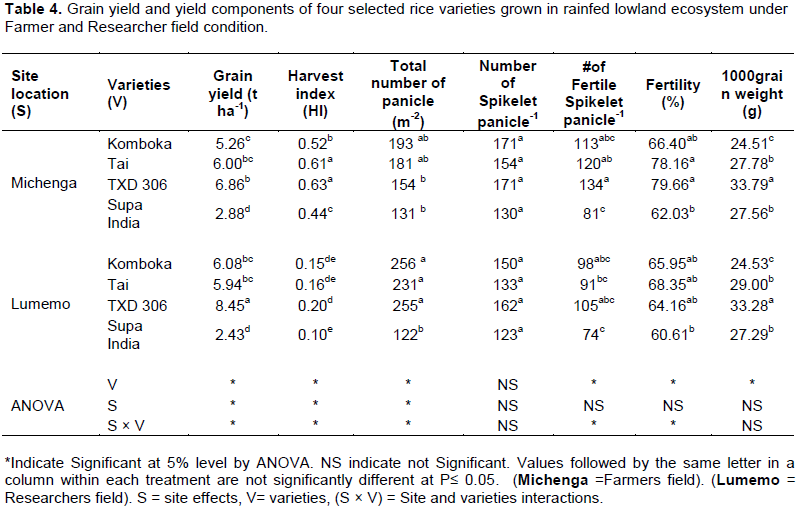
In the lowland rainfed rice ecosystem, the grain yields of TXD 306 were significantly higher at Michenga and Lumemo (Table 4). TXD 306 had a yield of 6.86 t/ha at Michenga farmer managed field and 8.45 t/ha at Lumemo researcher managed field. These yields were significantly higher than the grain yields of other lowland rainfed rice investigated, followed by Komboka and Tai which showed relatively similar grain yield performance (Table 4). Supa India variety which was selected by farmers as a local check produced the lowest grain yields 2.88 and 2.43 t/ha at Michenga and Lumemo sites, respectively.
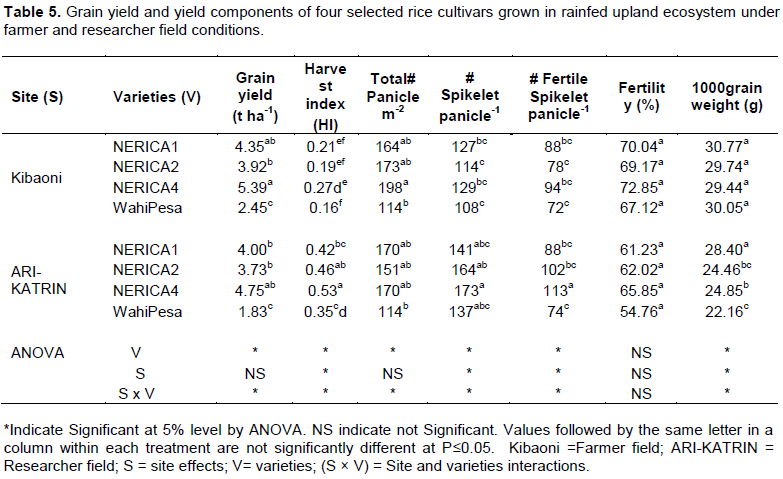
In the upland rainfed rice ecosystem, the results showed that the grain yield of improved rice varieties NERICA1 produced 4.35 and 4.00 t/ha, NERICA2 produced 3.92 and 3.73 t/ha and NERICA4 produced 5.39 and 4.75 t/ha at farmer and researcher fields, respectively (Table 5). These yields were significantly higher than those of the local check WahiPesa rice variety which performed poorly with grain yield of 2.83 and 1.83 t/ha at Kibaoni farmer managed field and at ARI-KATRIN researcher managed field, respectively (Table 5). The interactions in grain yields per unit area were observed to be significant at both lowland and upland rainfed ecosystems, between sites and rice varieties, respectively (Tables 4 and 5).
Yield components
The yield components such as harvest index, number of panicles per unit area, number of spikelets per panicle, fertile spikelets per panicle, fertility percentage ratio and 1000 grain weight varied on genotypes and the sites (Tables 4 and 5).
The harvest index (HI) in the lowland rainfed rice ecosystem, at Michenga farmer managed site were significantly higher than the harvest index at Lumemo reasearcher managed site. At Michenga farmer managed site, TXD 306 and Tai produced the highest harvest index ratio than all other varieties used with ratio of 0.6, followed by Komboka, and Supa India with ratio of 0.4 produced the lowest harvest index (Table 4). At Lumemo researcher managed site, TXD 306 had a significantly higher harvest index than Supa India but was not significantly different from Tai and Komboka (Table 4).
In upland rainfed ecosystem, the havest index at ARI-KATRIN researcher managed site were significantly higher than those at Kibaoni farmer managed site (Table 5). At both sites NERICA4 had a significantly higher harvest index ratio (HI), followed by NERICA2 and NERICA1 which were not statistically significant different in harvest index, and the local check variety WahiPesa indicated significantly lower harvest index at ARI-KATRIN and Kibaoni sites, respectively (Table 5). The interactions in harvest index ratio were observed to be significant at both lowland and upland rainfed ecosystems between sites and rice varieties (Tables 4 and 5).
The number of panicles per unit area in the lowland ecosystem was significantly different between Michenga farmer managed site and Lumemo researcher managed site (Table 4). At Michenga panicles per unit area were not statistically significant different though Komboka and Tai produced relatively higher panicles per unit area followed by TXD 306 and lastly Supa India. At Lumemo site Komboka, TXD 306 and Tai were not significantly different from each other in the number of panicles per unit area, but significantly had higher number of panicles per unit area than Supa India variety (Table 4).
In the upland rainfed ecosystem, the number of panicles per unit area was not significantly different between Kibaoni farmer managed site and ARI-KATRIN researcher managed site. All rice varieties used were statistically similar in the number of panicles per unit area at each site except for NERICA 4 and WahiPesa at Kibaoni which differed significantly (Table 5). The interactions in the number of panicles per unit area were observed to be significant at both lowland and upland rainfed ecosystems between sites and rice varieties (Tables 4 and 5).
The number of spikelets per panicle in the lowland rainfed rice ecosystem was not significantly different between Michenga and Lumemo sites and among varieties (Table 4). In the upland rainfed rice ecosystem, there was a significantly higher number of spikelets per panicle at ARI-KATRIN site ranging between 137 and 141 than at Kibaoni site with number of spikelets per panicle ranging between 108 and 129. There was no statistically significant difference among the varieties in the number of spikelets per panicle at Kibaoni and ARI-KATRIN (Table 5). The interactions in the number of spikeletes per panicle were significant in the upland rainfed ecosystem between sites and rice varieties (Table 5).
The fertile spikelets per panicle in the lowland rainfed ecosystem were not statistically different between Michenga farmer managed and Lumemo researcher managed sites (Table 4). However, there was a significant difference among rice varieties in the number of fertile spikelets per panicle at Michenga and Lumemo sites (Table 4).
In the upland rainfed rice ecosystem the number of fertile spikelets per panicle were significantly different between Kibaoni farmer managed and ARI-KATRIN researcher managed sites. At Kibaoni there were no significant differences in the number of fertile spikelets per panicle. While at ARI-KATRIN highly significant differences in the number of fertile spikelets per panicle was observed among the rice varieties (Table 5). NERICA4 had significantly higher number of fertile spikelets per panicle than all other upland rice varieties used, followed by NERICA2 and NERICA1, while WahiPesa was the least (Table 5). The interactions in the number fertile spikelets per panicle were observed to be significant at both lowland and upland rainfed ecosystems, between sites and rice varieties (Tables 4 and 5).
In the lowland rainfed ecosystem, the fertility percentage ratio was not significantly different between Michenga farmer managed site and Lumemo researcher managed site (Table 4). However, there were significant differences in fertility percentage ratio among the rice varieties at Michenga farmer managed site and Lumemo researcher managed site (Table 4). At both sites the local check Supa India indicated significantly lower fertility percentage ratio (Table 4). In the upland rainfed ecosystem, the fertility percentage ratio among improved rice varieties was not significantly different between Kibaoni farmers managed site and ARI-KATRIN researchers managed site (Table 5). The interactions in the fertility percentage ratio between sites and rice varieties were observed to be significant at both lowland and upland rainfed ecosystems (Tabls 4 and 5).
In the lowland rainfed ecosystem, 1000 grain weight was not significant different between Michenga farmers managed site and Lumemo researcher managed site (Table 4). There were varietal significant differences at both Michenga and Lumemo sites respectively (Table 4). TXD 306 variety had significantly the heaviest 1000 grains weights 33.8 and 33.3 g at Michenga and Lumemo sites, respectively. The local check Supa India variety indicated the lightest 1000 grain weight at both sites (Table 4).
In the upland rainfed ecosystem; a 1000 grain weights was significantly heavier at Kibaoni farmer managed site than at ARI-KATRIN researcher managed site (Table 5). At kibaoni, there was no significant differences between the rice varieties tested, while at ARI-KATRIN, NERICA1 had significantly heavy 1000 grain weight (28.4 g) than all other rice varieties, followed by NERICA4 (24.9 g),
NERICA2 (24.5 g) and WahiPesa had the lowest 1000 grain weight (22.2 g) (Table 5). The interactions in a 1000 grain weight between sites and rice varieties were significant at the upland rainfed ecosystems (Table 5).
Correlation between yield and yield components of selected rice varieties
A highly positive correlation between yield components and grain yields of selected lowland and upland rainfed rice varieties was observed (Table 6), and the correlation varied significantly with sites location and the yield components. In the lowland rainfed rice ecosystem; the grain yields at Lumemo researcher managed site was highly correlated with the fertile spikelets per panicle, number of spikelet per panicle, and number of panicles per unit area. However, 1000grain weight and grain filled ratio percentage contributed less to the final yield differences between the rice varieties (Table 6). At Michenga farmer managed site, the yield correlated well with the fertile spikelets per panicle, the percentage grain filled ratio, and the number of spikelet per panicle (Table 6). While the number of panicles per unit area and a 1000 grain weights contributed less to the final yield differences among the rice varieties.
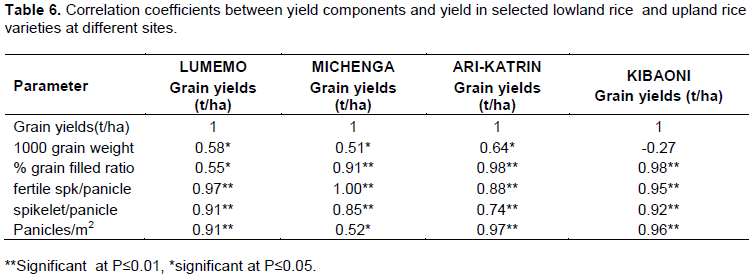
In the upland rainfed rice ecosystem, yield at ARI-KATRIN researcher managed site was highly correlated with the percentage grain fertility ratio, number of panicles per unit area, fertile spikelets per panicle and number of spikelet per panicle (Table 6), but a 1000 grain weight contributed less to the final yield differences among the rice varieties. At Kibaoni farmer managed site, the yield correlated well with the percentage grain filled ratio, number of panicles per unit area, fertile spikelets per panicle and number of spikelet per panicle (Table 6), but was negatively correlated to the 1000 grain weight (Table 6).
Yield gap analysis after implementation of selected GAPs in farmers’ fields
Yield gap is defined as the difference between maximum attainable yield and actual yield obtained by farmers. Maximum attainable yield refers to the highest yield that could be reached by a crop in a given environment. In the present study analyses of average yield obtained under farmers’ field management in comparison to the previous reported yield potentials by research institution and farmers’ realised yields (Table 7), which showed that, the yield gap particularly in the lowland rainfed rice ecosystem was reduced and in the upland the analysis showed a closed or excess yield were obtained.
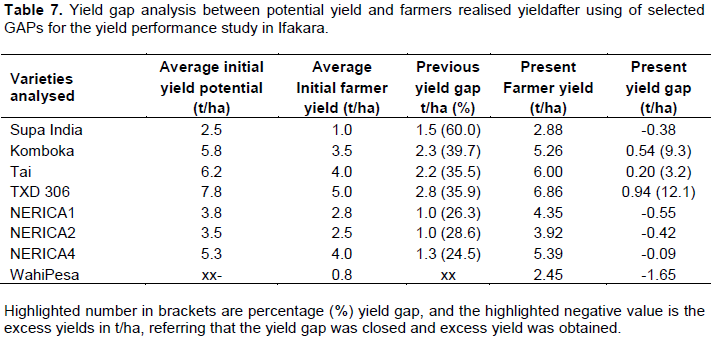
In the lowland rainfed ecosystem the local check Supa India variety produced significantly higher grain yields under farmer field management in excess about 0.38 t/ha from the previous researchers yield potentials reported in ARI-KATRIN and Cholima Agro-Scientific Research Centers (2013), while the varieties Komboka, Tai and TXD 306 indicated reduction in the yield gap from between 2.2 and 2.8 t/ha previously reported gap from 0.2 to 0.9 t/ha in the present study (Table 7). While in the upland rainfed ecosystem, the gap analysis indicated that after application of the selected good agronomic practices the yields was significantly higher in farmers’ field. The local check WahiPesa variety produced an excess yield of about 1.65 t/ha from the initial farmers yield reported. All NERICA varieties produced excess yield of between 0.09 and 0.55 t/ha. Implying that the negative gap value meant the yield produced at farmers field were in excess of the potential yields reported by researchers (Table 1), for all the rice varieties investigated in the study (Table 7).
DISCUSSION
Agronomic traits perfomance
In general, the agronomic performance of improved rice varieties both in lowland and upland ecosystem was earlier in terms of 50% flowering and 90% physical maturity than the local check traditional varieties selected by farmers. These finding were in line with those of Heuer et al. (2003), who found better agronomic performance of Oryza sativa (IR 64) × Oryza glaberrima (TOG5681) interspecific progenies within Back cross one (BC1) and Back cross two (BC2) populations compared to their O. sativa parent in irrigated lowland conditions in the Sahel. However, the upland rice varieties tested in the present study were the earliest in flowering and maturing, therefore are suitable for areas with short growing seasons due to short growth duration compared to the lowland rice varieties investigated by the present study.
Yield and yield components traits
The higher performance in total biomass yield of improved rice varieties (Figure 3A and 3B) in the present study were associated with higher productivity of selected rice varieties, the varieties with the highest accumulated shoot dry weight had the highest grain yields (Tables 4 and 5). Similar findings were reported by Yun et al. (1997), that the superior yield of Japonica indica hybrids was associated with the higher capability of reserve formation under the upland condition. Higher total biomass accumulation characteristics in all improved rice varieties investigated in this study were also in line with the results by Katsura et al. (2007), who reported rice yield mainly depends on ability of dry matter production of the variety. Thus low number of tillers was responsible for the reduction in total biomass yield of farmers selected varieties Supa India and WahiPesa varieties under lowland and upland rainfed ecosystem.
In the present study, the grain yield of improved lowland and upland rainfed rice varieties were significantly higher than the local check varieties both at farmers and researchers’ fields (Tables 4 and 5). Higher yielding varieties are responsive to fertilizer application, in the present study use of 80 kgN/ha of nitrogen fertilizer applied at the effective tillering stage, increased the yields in farmers’ field condition relatively the same as that of researcher managed fields. These findings were in partial agreement with those of Meertens et al. (2003) and Fageria et al. (2006) who reported that use of fertilizer application in fields increased the grain yield of rainfed rice ecosystem. Moreover, broadcasting seeds as the traditionally ways of sowing seeds used by most farmers in rainfed rice ecosystem has been reported to give low plant population and as a misuses of land resources, which leads to low yields (GRiSP, 2013). Therefore, sowing seeds or planting in spacing of 20 cm × 20 cm used in the present study for all rice varieties investigated increased tremendously the yields of farmers field relatively same as that obtained by the researcher fields, making the production in farmers fields attain the yield potentials established by research institution. These results were in partial agreement to those reported by Zaman et al. (2013) who found that the yields of spacing of 30 × 15 cm was higher compared to the grain yield in spacing 30 × 20 cm which had lower plant population per unit area.
The rice performance in both lowland and upland rainfed ecosystems investigated in terms of grain yields and yields components was found to vary considerably with rice genotypes and sites. Yoshida et al. (2006) and Matsunami et al. (2009) reported positive correlations between grain yields and number of spikelets per panicle when evaluating the high yielding varieties in lowland and upland ecosystem. These results are in partial agreement with the findings of the present study, whereby the high yields of improved and local check varieties were highly correlated with the number of spikelet per panicle. Moreover, the number of harvestable tillers is as good as the number of panicles per plant and according to Zou et al. (1991) tillering capacity of varieties is one of the most important characters determining yield potentials. These findings are in partial agreement to the present findings in which the number of panicles per unit area was proportional to the number of effective tillers per plant. Thus, the number of panicles per plant was among the
yield parameters responsible in determining yields of the selected rainfed rice varieties in both upland and lowland rainfed rice ecosystem (r = 0.96** and 0.97**) in the upland rice at Kibaoni and ARI-KATRIN respectively, and in the lowland rice (r = 0.52* and 0.91**) at Michenga and Lumemo sites.
Yield gap narrowing or bridging
Understanding the small-scale farm production constraints is essential in designing intervention plans and targeting to boost smallholder farm yield output (Arias et al., 2013). As specific constraints dictate the productivity and yield potential of different regions, region-specific management changes and interventions are required to close the observed yield gap (Mueller et al., 2012). The yield performance analysis of selected rice varieties under lowland and upland ecosystem in the present study showed that after application of the provided good agronomic practices (GAPs) such as improved rice varieties, spacing of 20 cm × 20 cm, sowing seeds in line (or in rows), two weeding times, and 80 kgN/ha urea fertilizer application bridged the yield gaps for some of the rice varieties investigated and reduced in others. The farmers yield increased significantly in both lowland and upland rainfed rice ecosystems relatively same as that of the researchers (Tables 4 and 5). Thus, good field crop management is an important key in rice production and was responsible in bridging the yield gaps between farmers and researchers yields. These observations are in line with those reported by Affholders et al. (2016) who analysed the yield gaps of various crops and found that the share of yield variation due to crop management was greater or equal to the share of yield variation due to the main climatic drivers of crop production, and that variation in soil fertility, weed infestation and agronomic management were factors that explains the yield gaps.
In the lowland rainfed ecosystem application of GAPs increased the yield and narrowed the yield gaps previous reported. For example, the yield gap in TXD 306 variety the gap dropped from 35.9 to 12.1% yield gap remained between farmers’ realised yields and the researcher yield potentials. It is therefore that 23.8% gap reduction realized yields in the study. Komboka variety indicated about 30.4% gap reduction, and narrowed the previously yield gap reported from 39.7 to 9.3% yield gap. Tai variety had the highest percent of reduction in yield gap from 35.5% yield gap previously reported in previous study to 3.2% yield gap remained in this study. This is about 32.3% reduction in the yield gap from the previous one. However, the local check variety Supa India in this study produced higher yield than the potential yield reported, and therefore the application of good agronomic practices used found to bridge the gap existed between farmers and researchers yields and gave excess yield of0.38 t/ha (Table 7).
The yield gaps of 24.5 to 28.6% previously reported between farmers realized yield and researchers yield potentials in the upland rainfed rice ecosystem was found to drop to zero and excess yield were observed in all improved NERICA rice. The local check WahiPesa rice variety also produced excess yield about 1.7 t/ha comparing to the reported yields under farmers (Table 7).
CONCLUSION
The study revealed that the yield performance of lowland rainfed rice varieties was higher than that of the upland rainfed rice varieties at farmers and researcher managed fields. The performance of all improved lowland and upland rice varieties at farmers and researchers managed sites were significantly higher compared to the local check varieties (Supa India and WahiPesa) selected by farmers.
The GAPs applied in the study narrowed the yield gap from 35.5 to 60% in lowland rainfed rice from 3.2 to 12.1% , while in the lowland local check variety Supa India was closed and excess yield of about 15.2% was realized. The GAPs in the upland rainfed rice ecosystem bridged or closed the yield gap and excess yield in all the improved upland varieties was obtained, while the local check WahiPesa yielded 1.7 t/ha in excess of the previous reported yields was obtained.
Thus, it was recommended that, provisioning farmers with GAPs such as improved rice varieties, plant spacing of 20 cm × 20 cm, early weeding and recommended fertilizer application accompanied with farmers supervision in field management, enhanced the high productivity and narrowed the yield gap that existed between farmers realised yields and researchers’ yields potentials in rainfed rice ecosystems in Ifakara.
CONFLICT OF INTERESTS
The authors have not declared any conflict of interests.
ACKNOWLEDGEMENTS
The authors thank Joshua’s Family and the University of Dar es salaam (UDSM) for providing funds to the first author to study at the University of Dar es Salaam.
REFERENCES
|
Affholder F, Poeydebat C, Corbels M, Scopel E, Tittonell P (2016). The yield gap of major food crops in family agriculture in the tropics: Assessment and analysis through field surveys and modelling. Field Crop Research 143:106-118. |
|
|
Arias P, Hallam D, Krivonos E, Morrison J (2013). Smallholder integration in changing food markets. Food and Agriculture Organization of the United Nations Rome 45 p. |
|
|
Chapman R, Tripp R (2003). Changing incentives for agricultural extension: A review of privatized extension in practice. Agricultural Research and Extension Network 132:11. |
|
|
Fageria NK (2010). Optimal nitrogen Fertilization timing for upland rice. National Rice and Bean Research Center of Embrapa, Brazil. 19th World Congress of Soil Science, Soil Solutions for a Changing World, 1-6 August, 2010, Brisbane, Australia pp. 176-179. |
|
|
Fageria NK, Baligar VC, Clark RB (2006). Physiology of Crop Production. New York: The Haworth Press. |
|
|
GenStat (2011). Statistical package. Fourteenth Edition. VSN International Ltd. |
|
|
Gomez KA (1972). Techniques for field experiments with rice. International Rice Research Institute, Los Ba-os Philippines. |
|
|
Global Rice Science Partnership (GRiSP) (2013). Rice almanac, 4th edition. Los Ba-os Philippines: International Rice Research Institute 280 p. |
|
|
Heuer S, Miezan KM, Sié M, Gaye S (2003). Increasing biodiversity of irrigated rice in Africa by interspecific crossing of Oryza glaberrima (Steud.) × O. sativa (L.). Euphytica 132:31-40. |
|
|
Katrin (2012). KATRIN Agricultural Research Institute Bulletin 22 p. |
|
|
Katrin (2013). KATRIN Agricultural Research Institute Bulletin 28 p. |
|
|
Katsura K, Maeda S, Horie T, Shiraiwa T (2007). Analysis of yield attributes and crop Physiological traits of Liangyoupeijiu, a hybrid rice recently bred in China. Field crops Research 103:170-177. |
|
|
Ministry of Agriculture Food Security and Cooperatives (MAFSC) (2009). National Rice Development Strategy. |
|
|
Matsunami M, Toshinori M, Kokuban M (2009). Growth and yield of New Rice for Africa (NERICAs) under different Ecosystems and Nitrogen Levels. Plant Production Science 12:381-389. |
|
|
Meertens CC, Kajiru GJ, Ndege LJ, Enserink HJ, Brouwer J (2003). Evaluation of on-farm soil fertility research in the rain fed lowland rice fields of Sukumaland, Tanzania. Experimantal Agriculture 39:65-79. |
|
|
Merlos FA, Monzon JP, Mercau JL, Taboada M, Andrade FH, Hall AJ, Jobbagy E, Cassman KG, Grassini P (2015). Potential for crop production increase in Argentina through closure of existing yield gaps. Field crop Research 184:145-154. |
|
|
Mghase JJ, Shiwachi H, Nakasone K, Takahashi H (2010). Agronomic and Socio economic Constraints to higher yielding of upland rice in Tanzania. African Journal Agriculture Research 5:15-158 |
|
|
Mkanthama JM (2013). An Analysis of Use of Good Agricultural Practices in Rice Production: A Case Study of Bagamoyo and Dakawa Areas, Tanzania. MSC Dissertation Jomo Kenyatta University of Agriculture and Technology, Kenya. |
|
|
Mueller N D, Gerber JS, Johnston M, Ray DK, Ramankutty N, Foley JA (2012). Closing yield gaps through nutrient and water management. Nature 490:254-257 |
|
|
Ronald B, Frankwell D, Honesta N (2014). Assessment of information needs of rice farmer in Tanzania; A case study of Kilombero District, Morogoro". Library Philosophy and Practice (e-journal). |
|
|
Saito K, Azoma K, Sié M (2010). Grain Yield Performance of Selected Lowland NERICA and Modern Asian Rice Genotypes in West Africa. Crop Science 50:281-291. |
|
|
United States Department of Agriculture (USDA) (2013). Production, Supply and distribution online. |
|
|
Van Ittersum MK, Cassman KG, Grassini P, Wolf J, Tittonell P, Hochman Z (2013). Yield gap analysis with local to global relevance – A review. Field Crop Research 143:4-17 |
|
|
Yoshida H, Horie T, Shiraiwa T (2006). A model explaining genotypic and environmental Variation of rice spikelet number per unit area measured by cross- locational experiments in Asia. Field Crops Research 97:337-343. |
|
|
Yoshida S (1981). Fundamentals of rice crop Science. International Rice Research Institute, Los Ba-os Philippines. |
|
|
Yun S, Wada Y, Maeda T, Miura K, Watanabe K (1997). Growth and yield of Japonica × Indica hybrid cultivars under direct seeding and upland cultivation conditions. Japanese Journal of Crop Science 66:386-393 |
|
|
Zaman F, Mondal B, Sarkar MAR, Paul SK (2013). Effect of variety and weeding regime on the yield components and yield of Aus rice. Journal of Bangladesh Agricultural University 11:17-21. |
|
|
Zou Y, Tang Q, Hu C, Liu S, Xiao D (1991). Dynamic simulation for rice growth and yield II. The comparison and application of rice tillering statistical models. Crop Research 5:18-22. |
|
Copyright © 2024 Author(s) retain the copyright of this article.
This article is published under the terms of the Creative Commons Attribution License 4.0


