ABSTRACT
The objective of this study was to evaluate the regimes of temperature and rainfall in Belém, PA, Brazil, with emphasis on the start of the dry season in order to provide planning support for agricultural activities during years of climatic anomolies in the region. An initial analysis was done of the metropolitan region of Belém comparing it to the typology of Amazonian climates using rainfall data from 1971 to 2014 and creating an annual index of precipitation anomolies (AIPA). The temperature regime was described using a homogeneous rainfall dataset from 1990 to 2014. The hydrological balance was estimated for the period 1990 to 2014 using an index of capacity of soil water availability equal to 100 mm to identify the months with deficit or excess of soil water. Box plots were analyzed by decade and maximums of daily rainfall for the month of August were used. The Pareto principle was applied to 9 indices to assess the effects of rainfall quantity in relation to anomalous years. Although the metropolitan region of Belém is for the most part categorized by the Af2 climate type it is possible to have prolonged soil water deficit from August through November, an effect that is intensified by the El Niño phenomenon. Furthermore, in the month of August there were years with extreme rainfall events, such as that of August 7th, 2010 where 72.4 mm of rainfall occurred representing 53% of total monthly rainfall. This event can be explained by the intense waves of humidity coming from the East that amplified local rainfall. During the last two decades extreme daily rainfall events have become more frequent, and rainfall reductions in the region have tended to intensify in areas that historically receive less rainfall such as the transition between the Amazonian and Savannah biomes. Therefore, in La Niña or El Niño years, the month of August can be considered to be the signal for meso- and large-scale atmospheric mechanisms that influence precipitation regimes and that can have a negative effect of the region’s agricultural productivity.
Key words: Precipitation rate, El Niño, La Niña.
Over the last decades, extreme air temperature and rainfall events have been studied at a global, national, regional, and local scale. Globally, detailed analyses of those extremes were discussed in the fourth report of the Intergovernmental Panel on Climate Change (IPCC, 2007) and reinforced in the most recent report (IPCC, 2014) due to its changes in magnitude and frequency. Extreme events reflect conditions anomalous to the climatology of a region and may last from a few days to years (De Sousa, 2015). In climate assessments and future climate projections, short-term events have been considered more important than the long-term events owing to their higher frequencies and intensities (intense rainfall, heat and cold waves, droughts) in a climate change scenario (Lewis et al., 2011; Marengo et al., 2016; Espinoza Villar et al., 2011).
The general circulation of the atmosphere (Van der Ent et al., 2010), the digital terrain models, land use, and cover patterns are determinant in the distribution, volume and intensity of rainfall globally and mainly in the Amazon Basin. The Amazon Basin has an estimated area of 6.3 million km2, of which approximately 5 million km2 are in Brazilian territory. The remainder of this area belongs to countries such as Bolivia, Colombia, Ecuador, and Peru. This region is bound in the west by the Andes Mountain Range, which plays a major role in the region’s climate dynamics.
In the north, the Guiana Shields act as a barrier for trade winds from the North Atlantic Ocean, while the Atlantic Ocean lies to the east, to where all water caught in the basin flows. To the south of the region, the effects on meteorological variables are impacted by the Brazilian Highlands (Amanajás, 2012). The Amazon plays an important role in energy, water and mass transport in the soil-plant-atmosphere system providing ecosystem goods and services on a continental scale. The services provided by atmospheric flows are responsible for the maintenance of the regional and global climate, such as: The storage and absorption of excess carbon from the atmosphere, the transport of trace gases, aerosols and water vapor to remote regions and, mainly, recycling of precipitation (Rocha et al., 2015).
The Amazon is considered the world’s largest tropical rainforest (Verburga et al., 2014) and is very important as a source of heat to the atmospheric circulation both locally (Fu and Li, 2004; Li and Fu, 2004) and globally (Nobre et al., 2009). The region is considered to be a moisture sink for the atmosphere, indicating that it rains more than the rate of evapotranspiration. The main source of moisture is supplied by the Equatorial Atlantic Ocean, transported by trade winds (Arraut et al., 2012), which influences the region's rainfall regime. The sources of moisture come from the North and South Tropical Atlantic Ocean, with a flow from East to West during all seasons of the year (Satyamurty et al., 2013). During the rainy season, the South Tropical Atlantic (Drumond et al., 2014) is the largest supplier of moisture in the region, and in the rainy season, 32% of precipitated water comes from evapotranspiration (Rocha et al., 2015).
According to Reibota et al. (2010), the Intertropical Convergence Zone (ITCZ) may act in two ways in the north region of Brazil. In one, convective clusters are formed along this front and reach the Amazon basin when they move west and, in the other, trade winds interact with sea breeze to form instability lines that move inland and recover when moving west, often reaching the Andes (Cohen et al., 2014). In addition, according to Marcuzzo et al. (2013), some cold fronts also contribute to rainfall in the region and may go as far as the Brazilian west-most state of Acre, dropping the temperature down to 4°C.
Those mechanisms promote oscillations in the equatorial Pacific Ocean that impact the local meteorological systems by enhancing or inhibiting the development of convection clouds, thus compromising the climatology of rainfall events (Sansigolo, 2000). In years featuring El Niño - Southern Oscillation (ENSO), which occurs when the equatorial Pacific Ocean has anomalous sea surface temperature (SST), the rainy season finishes earlier, with long dry spells. In years under the influence of La Niña, which is characterized by abnormal cooling of SST in the tropical Pacific Ocean, the Amazon experiences excessive rainfall. El Niño and La Niña are large-scale mechanisms that significantly
impact meteorological conditions such as pressure, temperature, relative air humidity, cloud cover, wind, and precipitation (Boers et al., 2015).
The rainy season, as well as the extreme rainfall events in the Amazon region, deserves attention due to their negative impacts on economic and social activities. They are fundamental to the maintenance of agricultural crops in the region, because they may reduce grain productivity (Santos et al., 2013), particularly due to extended periods of soil water deficit. The objective of this study was to evaluate the thermal-water regime in Belém, highlighting the month of August as a strategy to subsidize agricultural planning in years with climatic anomalies in the region.
Study region and climate conditions
The city of Belém is located in the western Amazon region, in the northeast portion of the state of Pará, and, given its proximity with the equator and the Atlantic Ocean; it features high air temperatures that influence the relative humidity in the region. Medium-scale meteorological systems such as sea breeze, large-scale systems such as the Easterly Waves Disturbance (EWD), the Intertropical Convergence Zone (ITCZ), Bolivia high, and instability lines, among others, are the mechanisms that modulate weather and climate in the Amazon and affect the rainfall regime in Belém (Santos, 2014).
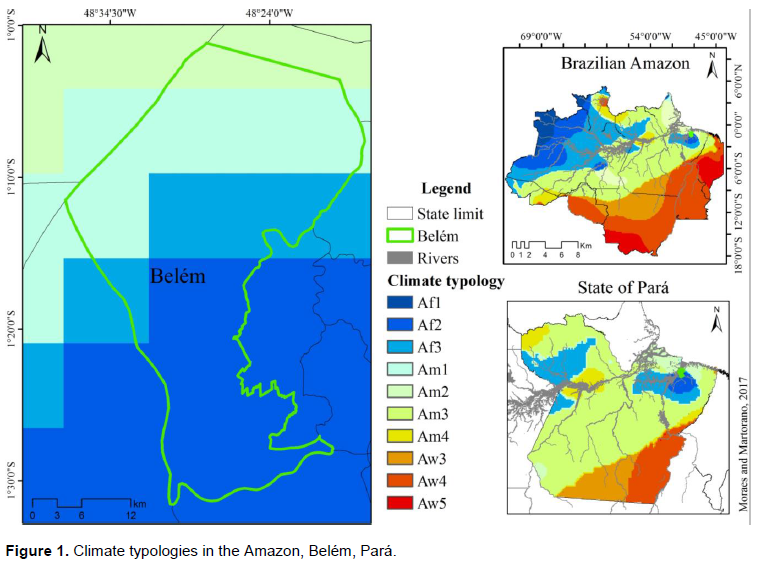
The climatic typology map of the Brazilian Amazon generated at the Agrometeorology Laboratory of Embrapa Amazônia Oriental was utilized for the study to locate Belém and identify the predominant subtype in the capital of Pará. The Köppen climate classification is one of the most widely used climate classification systems and the Amazon typology is classified as Tropical Moist Climates, with occurrence of average temperatures above 18°C in all months that is included in the "A" group. According to Tourne et al. (2016) and Martorano et al. (2011) it is possible to identify three climatic types by the Köppen method, but according to the adaptation of Martorano et al. (1993) there are 10 typological zones in the region. In Af typology, there are variations with three patterns (Af1, Af2 and Af3), occurring predominantly in the state of Amazonas. In the typology Am, 4 subtypes (Am1, Am2, Am3, Am4) are found, which prevail in the northeast-southwest direction, and the typical areas of Aw have three subtypes (Aw3, Aw4 and Aw5) Leste-South of the Legal Amazon.
Data base and descriptive statistics analysis
Considering the limitation of long historical series with meteorological data in the Amazon, an analysis was made using descriptive statistics, considering a database of the meteorological station of the National Institute of Meteorology (Instituto Nacional de Meteorologia - INMET) in the city of Belém (01° 27' S; 48° 30' W; 10 m). Monthly rainfall records over 43 years were analyzed, comprising the period from 1971 to 2014. Data on the synoptic charts provided by the National Institute for Space Research, more specifically the Center of Weather Forecast and Climate Studies (Instituto Nacional de Pesquisas Espaciais/Centro de Previsão de Tempo e Estudos Climáticos – INPE/CPTEC), were consulted. EUMETSAT’s Meteosat satellite imagery (copyright 2010-2012 EUMETSAT) of 9:00 am UTC on August 7th, 2010 (Color IR 9) was also analyzed. That day is considered to have featured the largest rainfall event in the historical series evaluated.
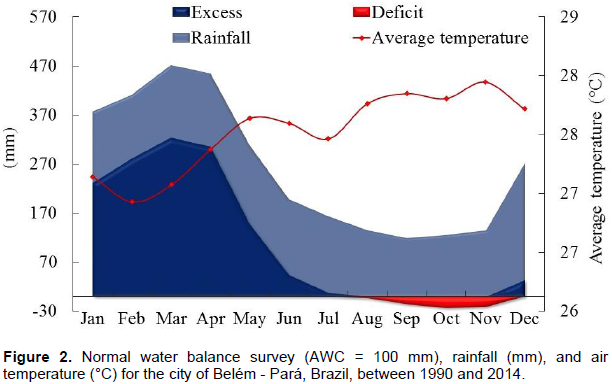
A detailed analysis was conducted for the month of August based on meteorological data of Belém in order to identify possible fluctuations, caused by anomalous years. This water deficit is acknowledged as the main factor in the reduction of pasture availability for livestock farms in the region and of water supply to the horticultural belt surrounding Belém. Water balances were surveyed adopting the soil’s available water capacity (AWC) of 100 mm based on surpluses and deficits in grass and annual crops. The mean air temperature and solar radiation data used was between 1990 and 2014, the longest homogeneous period found, to strengthen the evidence that August features a soil water scarcity process.
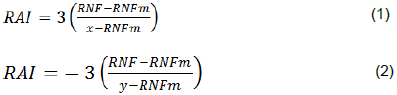
The calculation to determine the annual rainfall anomaly index (RAI) in Belém followed the methodology by Rooy (1965) adapted by Freitas (2005), according to Equations 1 and 2, with the classes adapted as a function of the rainfall in August:
Where RAI is the rainfall anomaly index; RNF (mm) is the rainfall observed; RNFm (mm) is the mean rainfall; x (mm) is the average of the ten highest values observed; and y (mm) is the average of the ten lowest values observed.
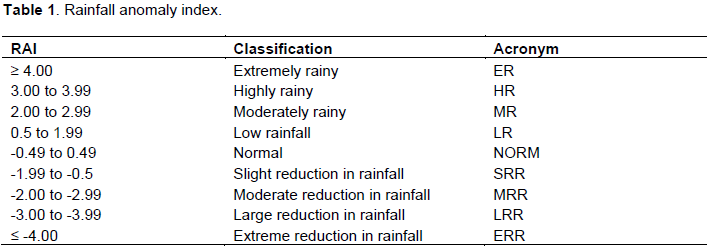
After the calculations, the RAI was classified according to nine categories, described in Table 1. Once the anomalies were determined, negative rainfall anomalies (values below -1,0), associated with large-scale mechanisms such as El Niño, and positive anomalies (values above 1,0), characterizing the influence of La Niña, were analyzed.
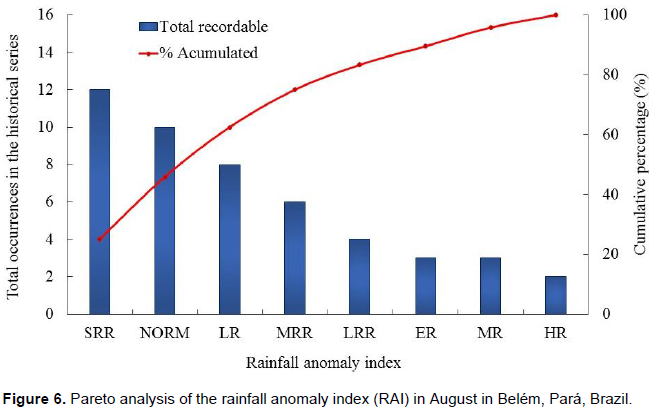
The data were split into four decades and a box-plot analysis was carried out. Another analysis was performed adopting Pareto principle to verify whether the quantitative effects of rainfall are prioritized regarding anomalous years, considering the indices Extremely Rainy (ER), Highly Rainy (HR), Moderately Rainy (MR), Low Rainfall (LR), Normal (NORM), Slight Reduction in Rainfall (SRR), Moderate Reduction in Rainfall (MRR), Large Reduction in Rainfall (LRR), and Extreme Reduction in Rainfall (ERR). Pareto analysis is a statistical technique in decision-making used for the selection of a limited number of tasks that produce significant overall effect, known as the 80/20 rule.
Climate typology in the Brazilian Amazon, with emphasis on Belém, Pará
According to the analyzed data, in the study area the mean annual rainfall varies between 2,600 and 2,900 mm. This conditions place Belém in climatic subtype Af2 (Figure 1). Monthly rainfall can exceed 60 mm with rainfall anomalies fluctuating between the above averages.
Climatic anomalies and soil water balance in Belém, Pará
The rainy season goes from December to May, with values close to 470 mm in March, and the dry season goes from June to November, with mean values of 119 mm. The reduction in rainfall begins in June and reaches the lowest point in September, with the driest month features rainfall equal to or above 60 mm. Water deficits can be observed starting in August and reach values close to 30 mm between October and November. Soil water deficiency (AWC = 100 mm) in August was detected in 11 years between 1990 and 2014 in the city of Belém. Surpluses between 100 and 140 mm were observed in four years (Figure 2). Additionally, mean monthly air temperature was lowest during the rainy season, ranging from 27.0 to 27.5°C between January and May. In the dry season, confirmed by the soil water deficits between August and November, thermal conditions reach almost 28°C. However, on a yearly basis, the highest mean temperatures are close to 28°C in November and the lowest are close to 27°C in February, which indicates that the mean thermal oscillations do not exceed 1°C (Figure 2).

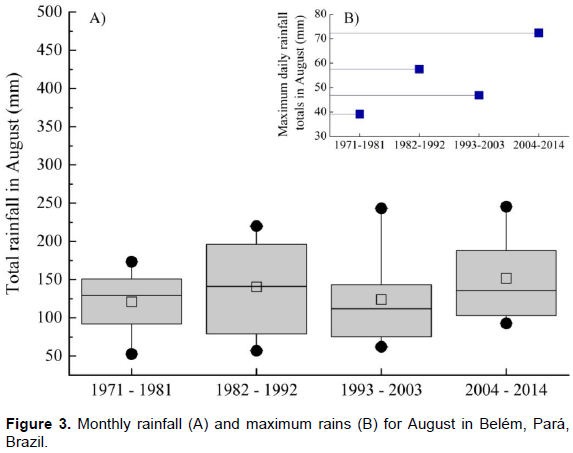
An analysis of the month of August per decade showed that the mean monthly rainfall is between 100 and 150 mm, reaching up to 250 mm as shown from 1993 to 2003 and from 2004 to 2014 or going as low as around 50 mm from 1971 to 1981 and from 1982 to 1992. It was also found that maximum rainfall variability was greater between 1982 and 1992. Maximum rainfall events between 1992 and 2003 were well distributed in August. The last ten years analyzed, that is, 2004 to 2014 were the most asymmetric in the whole historical series (Figure 3A).
Isolated extreme events were concentrated in the decade 1993 to 2003 (Figure 3A), explained by the predominance of negative anomalies with rainfall reduction, which were concentrated with values in the first quartile, expressing negative asymmetry in that decade. The maximum rainfall events in August,in that decade, were below 50 mm (Figure 3B), reinforcing that in years of climatic extremes with low rainfall.
Specifically, August behaves as an indicator month, both registering heavy rains at short intervals, which trigger flooding in the city, as well as the occurrence of prolonged periods without rain, which limit the water stocks in the soil and compromise crop yield and pastures in peri-urban areas.
To further support the responses in the rainfall oscillation pattern in Belém, the results presented show that, between 1971 and 1990, more positive anomalies occurred, with 11 years showing extreme events with higher rainfall and nine years with below-average rainfall. Between 1990 and 2014, the process was inverted, with 12 years featuring negative anomalies and nine years with positive anomalies, showing that rainfall in August has decreased over the last 23 years in Belém (Figure 4B). According to De Souza et al. (2004), negative rainfall anomalies in the Belém region are associated with positive anomalies in SST in most of the North Atlantic. Those authors highlight that the variability in regional rainfall in the Eastern Amazon and northeast Brazil is caused by a combined effect between equatorial Pacific (ENSO) and gradients in the South Atlantic.
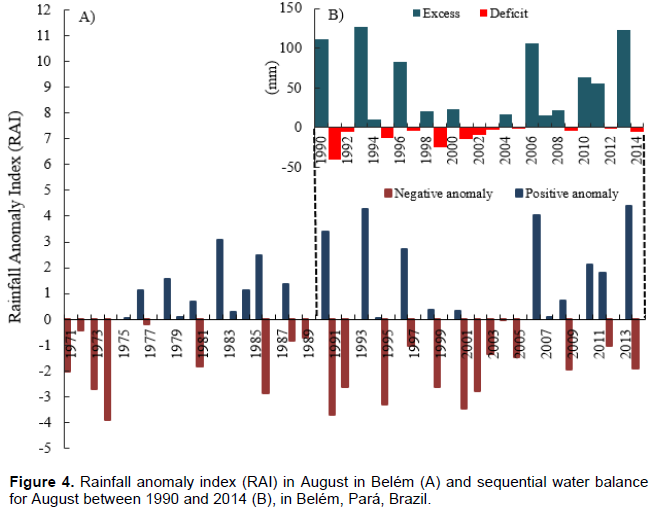
In 1982 and 2001, two anomalous climate contrasts were identified, characterized by the simultaneous occurrences of El Niño and the SST gradients for the North and Intertropical Atlantic, with simultaneous La Niña and SST gradient in the Atlantic Intertropical. Thus, in 1982 the anomalies were positive (La Niña), but positive in 2001 negative (El Niño), being that in all analyzed series occurred more years with negative anomalies (Figure 4A). Therefore, these results reinforce that it is possible in Belem to trigger agrometeorological alerts as early as August when it is confirmed whether the years will be, for example El Niño. This information reinforces that the results presented in Figure 2 show that the water deficit initiated in August can extend until December, requiring the replacement of water in the soil to the agricultural crops.
The analyses of the frequency of totals rainfall in August showed that 80% of the amount of rainfall in that month came from events between 60 and 180 mm. Frequencies from 60 to 80 mm and from 120 to 140 mm occur in 16% of the events, being the largest occurrences observed. The histogram shows that Belém is characterized by not having rainfall below 40 mm in August, following a normal distribution in the Gaussian curve in almost all rainfall ranges according to the historical series analyzed (Figure 5).
About 80% of the anomalies in rainfall events in August in the city of Belém can be explained by the SRR, NORM, LR, and MRR indices (Figure 6). Extreme events, such as LRR and ER, are observed in fewer than 20% of the years. However, when those events do occur, they cause large economic losses for agriculture and may be linked to large-scale factors that significantly impact meteorological conditions, such as El Niño and La Niña.
Medium-scale effects of the ENSO mechanism lead to changes in mean total rainfall in August, matching studies by Maier et al. (2016), who found significant changes in meteorological conditions such as rainfall in the region. The mean total rainfall in August during the years analyzed is 137.37 mm. It was observed that the rainfall in 56% of the years was above average or on average, while the remaining years were below average. When the years with anomalies are analyzed, it is seen that the last 20 years had a predominance of negative anomalies, but that the intensity of positive anomalies overcome the negative ones, which justifies the rainier years in August, that is, with mean rainfall above the local conditions.
In terms of maximum rainfall over 24 h, the historical series shows that August 7th, 2010 featured 72.40 mm of rain, which shows that, although it is a month with low rainfall, extreme events can occur during it. This episode could be explained by consulting synoptic charts provided by INPE. It was observed that, in 2010, the warnings were of a weak El Niño, which highlights the influence of this mechanism on rainfall anomalies in the Amazon. It was also observed that the wind at 500 hPa on August 6th and 7th, 2010 indicated an expansion of Bolivia high, which intensifies the effects on weather conditions in the Amazon (Figure 7).
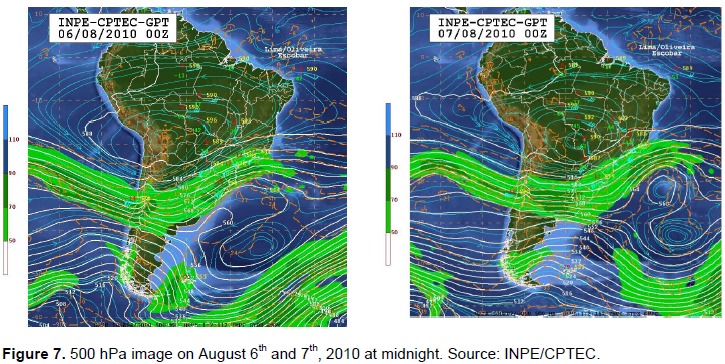
The analyses of those synoptic charts pointed out a large anticyclone whose center was between Paraguay and the Brazilian border state of Mato Grosso near the coordinates 20° S and 55° W, whence a crest extended across Brazil’s South region. This anticyclone flow also caused air subsidence and, consequently, adiabatic compression, factors that maintained weather conditions virtually cloud free and with low relative air humidity in central Brazil. The meteorological prognostics supported the existence of an intense geopotential gradient with strong south winds at 20° S coming from the Pacific, crossing Argentina, and extending into the Atlantic close to coastal areas of the South and Southeast regions of Brazil, which was associated with a cyclone vortex that fed the frontal system on the surface.
Images from NOAA (National Oceanic and Atmospheric Administration) satellites on that day (Figure 8) showed the presence of highly vertical clouds due to the moisture advection in eastern South America. The regions in shades of gray indicated little-vertical clouds and the regions in shades of white in the north portion of the Amazon indicated the presence of an ITCZ, with the presence of highly vertical clouds colder at the top, that is, mostly cumulonimbus, which are associated with more intense rains and featuring ice at the top, thus reflecting the intense white in the images.
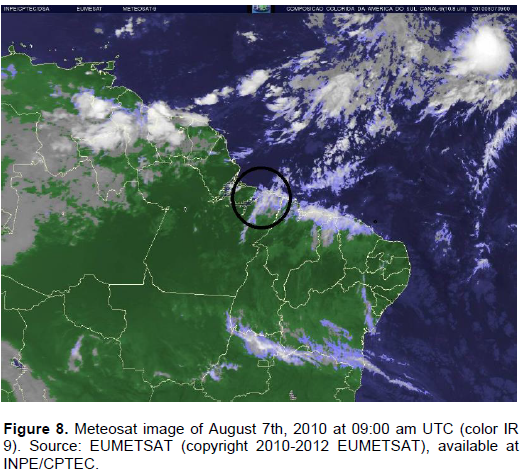
Therefore, it is observed that those convection clouds were above Belém on August 7th, 2010, which indicates that the largest rainfall over the 43 years analyzed can be explained by the presence of this localized phenomenon. It must be pointed out that this rainfall event represented 53% of the rain of the month of August in 2010. That event supports the statements by Dos Santos (2015) regarding the occurrence of short-duration extreme events in the region.
The meteorological systems that modulate extreme events, intensifying or reducing rainfall in the region, may be associated with a strong El Niño and La Niña or be caused by convection clusters that intensify intense short-duration rains. Over the 43 year analyzed (1971 to 2014), specifically in August, it was observed that, since it is a transition month between the rainy to the less rainy seasons, rainfall rates are reduced, but extreme events may occur in years featuring ENSO, as observed in August 7th, 2010 (Figure 8). That event was influenced by relative air humidity coming from easterly waves, showing medium- and large-scale effects associated with the El Niño observed in that year. That suggests teleconnections between the meteorological systems that modulate the dynamics in South America with the Amazon (Reibota, 2014).
Extreme single-day rainfall events compared to the monthly climatologic average were associated with large-scale mechanisms that intensify local weather conditions. The combination between atmospheric modulators on the time and climate scales account differently for the variation of extreme rainfall in August, thus contributing to the occurrence of surplus rainfall in years featuring La Niña and deficits in years of El Niño, with strong intensification of water deficit values over the last two decades.
The period between August and November can bring economic consequences for producers due to the
reduction in productivity in non-irrigated crops as well as the environmental impacts in areas that need replenishment of water in the soil to supply the water demands of the crops and cover losses due to the evapotranspiratory process. It is observed that in years with extreme events, such as a strong El Niño, the problems due to lack of water to agricultural crops are intensified. On the other hand, in climate change scenarios, the models indicate that the consequences tend to increase by the intensity and severity of these effects at a global and regional scale.
The authors have not declared any conflict of interests.
REFERENCES
|
Arraut JR, Nobre C, Barbosa HMJ, Obregon G, Marengo JA (2012). Aerial Rivers and Lakes: Looking at Large-Scale Moisture Transport and Its Relation to Amazonia and to Subtropical Rainfall in South America. J. Clim. 25(2):543-556.
Crossref
|
|
|
|
Amanajás JC, Braga CC (2012). Padrões espaço-temporal pluviométricos na Amazônia Oriental utilizando análise multivariada. Rev. Bra. Agrometeorologia 27(4):423-434.
Crossref
|
|
|
|
|
Boers N, Donner RV, Bookhagen B, Kurths J (2015). Complex network analysis helps to identify impacts of the El Ni-o Southern Oscillation on moisture divergence in South America. Clim Dyn. 45:619.
Crossref
|
|
|
|
|
Cohen JCP, Fitzjarrald DR, D'Oliveira FAF, Saraiva I, Barbosa IRS, Gandu AW, Kuhn PA (2014). Radar-Observed Spatial and Temporal Rainfall Variability Near The Tapajós-Amazon Confluence. Rev. Bra. Meteorol. 29:23-30.
Crossref
|
|
|
|
|
De Sousa AML, Rocha EJP, Vitorino MI, Souza PJO, Botelho MN (2015). Variabilidade espaço-temporal da precipitação na Amazônia durante eventos. Enos. Rev. Bras. Geogr. Fis. 8(1):013-024.
|
|
|
|
|
De Souza EB, Kayano MT, Ambrizzi T (2004). The regional precipitation over the eastern Amazon/northeast Brazil modulated by tropical Pacific and Atlantic SST anomalies on weekly timescale. Rev. Bra. Meteorol. 19(2):113-122.
|
|
|
|
|
Dos Santos JGM (2015). Transporte de umidade na Amazônia e sua Relação com a temperatura da superfície do mar dos Oceanos adjacentes utilizando as simulações do CMIP5. Tese (Doutorado em Ciência do Sistema Terrestre) – Instituto Nacional de Pesquisas Espaciais -INPE-, São José dos Campos.
|
|
|
|
|
Drumond A, Marengo JA, Ambrizzi T, Nieto R, Moreira L, Gimeno L (2014). The role of Amazon Basin moisture on the atmospheric branch of the hydrological cycle: a Lagrangian analysis. Hydrol. Earth Syst. Sci. 11(1):1023-1046.
Crossref
|
|
|
|
|
van der Ent RJ, Savenije HHG, Schaefli B, Steeleâ€Dunne SC (2010).
|
|
|
|
|
Espinoza VJC, Ronchail J, Guyot JL, Junquas C, Vauchel P, Lavado CWS, Drapeau G, Pombosa LR (2011). Climate variability and extreme drought in the upper Solimões River (Western Amazon basin): Understanding the exceptional 2010 drought. Geophys. Res. Lett. 38:L13406.
Crossref
|
|
|
|
|
Freitas MAS (2005). Um Sistema de Suporte à Decisão para o Monitoramento de Secas Meteorológicas em Regiões Semi-Áridas. Rev. Technol. 19(1):84-95.
|
|
|
|
|
Fu R, Li W (2004). The influence of the land surface on the transition from dry to wet season in Amazonia. Theor. Appl. Climatol. 78:97-110.
Crossref
|
|
|
|
|
IPCC (2007). Climate Change 2007: Impacts, Adaptation and Vulnerability. Contribution of Working Group II to the Fourth Assessment Report of the Intergovernmental Panel on Climate Change, ML Parry, OF Canziani, JP Palutikof, PJ van der Linden and CE Hanson, Eds., Cambridge University Press, Cambridge, UK. 976 pp.
|
|
|
|
|
IPCC (2014). Climate Change 2014: Mitigation of Climate Change. Contribution of Working Group III to the Fifth Assessment Report of the Intergovernmental Panel on Climate Change [Edenhofer O, Pichs-Madruga R, Sokona Y, Farahani E, Kadner S, Seyboth K, Adler A, Baum I, Brunner S, Eickemeier P, Kriemann B, Savolainen JS, Schlömer C, Von S, Zwickel T, Minx JC (eds.)]. Cambridge University Press, Cambridge, United Kingdom and New York, NY, USA.
|
|
|
|
|
Lewis SL, Brando PM, Phillips OL, Van der Heijden GMF, Nepstad D (2011). The 2010 Amazon Drought. Science P. 331.
Crossref
|
|
|
|
|
Li W, Fu R (2004). Transition of the large-scale atmospheric and land surface conditions from the dry to the wet season over Amazonia as diagnosed by the ECMWF. re-analysis. J. Clim. 17(7):2637-2651.
Crossref
|
|
|
|
|
Maier ÉLB, Costi J, Barreira S, Simões JC (2016). Precipitação na América do Sul: médias climáticas e padrões da variabilidade no período entre 1979 e 2008. Rev. Bra. Geogr. Fís. 9(1):032-046.
|
|
|
|
|
Marcuzzo FFN, Romero V (2013). Influência do El Ni-o e La Ni-a na Precipitação Máxima Diária do Estado de Goiás. Rev. Bra. Meteorologia 28(4):429-440.
Crossref
|
|
|
|
|
Marengo JA, Tomasella J, Alves LM, Soares WR, Rodriguez DA (2011). The drought of 2010 in the context of historical droughts in the Amazon region, Geophys. Res. Lett. 38:L12703
Crossref
|
|
|
|
|
Marengo JA, Aragão LEOC, Cox PM, Betts R, Costa D, Kaye N, Smith LT, Lincoln MA, Vera R (2016). Impacts of Climate Extremes in Brazil: The Development of a Web Platform for Understanding Long-Term Sustainability of Ecosystems and Human Health in Amazonia (PULSE-Brazil). Amer. Meteor. Soc. (8):1341-1346.
|
|
|
|
|
Martorano LG, Pereira LC, Cezar EGM, Pereira ICB (1993). Estudos climáticos do Estado do Pará, classificação climática (Kõppen) e deficiência hídrica (Thornthwhite, Matter). Belém, SUDAM/EMBRAPA, SNLCS pp. 53.
|
|
|
|
|
Martorano LG, Monteiro DCA, Brienza Junior S, Lisboa LSS (2011). Top-bioclimate conditions associated with the natural occurrence of two Amazonian tree species for sustainable reforestation in the State of Para. In: C.A. Brebbia; E. Tiezzi; Y. Villacampa Esteve. (Org.). Ecosystems and Sustainable Development VIII. Spain: Universidad de Alicant. 144:111-122.
Crossref
|
|
|
|
|
Nobre P, Malagutti M, Urbano DF, Almeida RAF, Giarolla E (2009). Amazon deforestation and climate change in a couple model simulation. J. Clim. 22:5685-5697.
Crossref
|
|
|
|
|
Reibota MS, Gan MA, Rocha RP, Ambrizzi T (2010). Regimes de precipitação na América do Sul: Uma revisão bibliográfica. Rev. Bra. Meteorol. 25(2):185-204.
Crossref
|
|
|
|
|
Reibota MS, Santos IA (2014). Influência de alguns padrões de teleconexão na precipitação no norte e nordeste do Brasil. Rev. Bra. Clim. 15(10):28:48.
|
|
|
|
|
Rocha VM, Correia FWS, Fonseca PAM (2015). Reciclagem de precipitação na Amazônia: um estudo de revisão. Rev. Bra. Meteorologia 30(1):59-70.
Crossref
|
|
|
|
|
Rooy MP (1965). A rainfall anomaly index independent of time and space. Notos, Pretoria 14:43-48.
|
|
|
|
|
Sansigolo CA (2000). Influência dos eventos El Ni-o e La Ni-a no regime de precipitação de Pelotas, RS. Rev. Bra. Meteorol. 15(1):69-75.
|
|
|
|
|
Santos PM, Cruz PG, Araújo LC, Pezzopane JRM, Valle CB, Pezzopane CG (2013). Response mechanisms of Brachiaria brizantha cultivars to water déficit stress. Rev. Braz. Zoot. 42(11):767-773.
Crossref
|
|
|
|
|
Santos SRQ, Braga CC, Santos APP, Brito JIB, Campos TLOB (2014). Classificação de eventos extremos de precipitação em múltiplas escalas de tempo em Belém-PA: Utilizando o índice de precipitação normalizada. Rev. Bra. Geogr. Fis. 7(4):629-635.
|
|
|
|
|
Satyamurty P, Costa CPW, Manzi AO (2013). Moisture source for the Amazon Basin: a study of contrasting years. Theor. Appl. Climatol. 111(1-2):195-209.
Crossref
|
|
|
|
|
Tourne DCM, Martorano LG, Brienza Juncior S, Dias CTS, Lisboa ALS, Sarmento SD, Vettorazzi CA (2015). Potential topoclimatic zones as support for forest plantation in the Amazon: Advances and challenges to growing Paricá (Schizolobium amazonicum). Environ. Dev. 18:26-35.
Crossref
|
|
|
|
|
Verburga R, Rodrigues Filho S, Lindoso D, Debortolib N, Litreb G, Bursztyn M (2014). The impact of commodity price and conservation policy scenarios ondeforestation and agricultural land use in a frontier area within the Amazon. Land Use Policy 37:14-26.
Crossref
|
|