Full Length Research Paper

ABSTRACT
Impacts of landuses [old home garden (HG), oilpalm plantation (OP), fallow arable field (FA), grass lawn (GL)] on physico-chemical properties of an ultisol on a flat in the Coastal plains sand of Imo State, Nigeria were evaluated. Landuse significantly (at 5%) influenced the properties sand, organic matter (OM) content, soil reaction (pH), exchangeable cations Ca, Mg, K, exchangeable acidity (Al+H), effective cation exchange capacity (ECEC), base saturation (BS); while available phosphorous (av.P), Ca, Mg, K, Al+H, varied most within and among the management units. Properties varied least in HG, but most in FA and GL. Strong soil acidity and associated problems of nutrient (e.g. Ca, Mg, K) deficiencies, nutrient imbalance, low ECEC were the main limiting factors. The ratio Ca+Mg/Al+H, among other indices OM, Ca+Mg, Al+H, ESP, captured the soils’ degradation best. On its basis, the soils’ qualities were in the order, HG > OP > FA > GL. Management should aim at meeting the conditions of HG and that should include liming to correct nutrient imbalance as it had not been mitigated by long fallow. Indices identified should be considered in developing quantitative models for estimating soil quality in the location of study. Soil property variability as influenced by land fragmentation in the area needs further investigation using geostatistical technique.
Key words: Management, Coastal plains sand, indices of soil quality, soil degradation, soil productivity.
INTRODUCTION
The land of the Coastal plains sand of Imo State, Nigeria is densely populated hence the fragmentation, intensification of landuse and a general lack of virgin forests in the area. The soils are degraded and the degradation is attributed to unsustainability of landuse (Asadu et al., 2008; FDALR, 1999; Lal, 1986; Ogunkunle, 2015; Smalling et al., 1996).
The main rural landuses/land utilization types in Lorji, Aboh-Mbaise L.G.A. of Imo State are the arable cultivation, which include home gardens and oilpalm plantations (Lagemann, 1981; Uzozie, 1975). The grass lawns of schools in the area represent yet another landuse type which is often neglected.
Assessment of soil quality is considered invaluable in determining the sustainability of land management systems (Karlen et al., 1997). Soil quality is differentiated into inherent and dynamic components. While the inherent is determined by soil forming factors (which effects are assessed looking at the entire soil profile), the dynamic focuses on the surface 20 to 30 cm, describing the status or condition of a specific soil due to relatively recent landuse or management decision (Ogunkunle, 2015). According to Rodrigo-Comino et al. (2019), the major topsoil quality indicators are soil texture, soil organic carbon, bulk density and the heavy metals (Fe, Mn, Zn, Cu). On the other hand, Adaikwu and Ali (2013) have noted the suitable indicators for crop production to be soil pH, organic matter (OM) content, total nitrogen, available phosphorus, exchangeable cations, cation exch. capacity (cec), saturated hydraulic conductivity, and base saturation. Oti (2002) recommended silt/clay, fine sand/coarse sand, Ca/Mg, Ca+Mg, Ca+Mg/Al+H, OC and Al-Saturation as reliable indices of erosion of tropical ultisols. It is also recommended that the evaluation of soil quality should incorporate spatial and temporal variation of functions, which should be done in relation to environment and landuse (Idowu, 2003; Ogunkunle, 2015; Young, 1998).
While there had been studies comparing soils under forests (some of which were virgin) with those of arable cultivation to determine the effect of the later on soils of the area (Akamigbo, 1999; Asadu and Bosah, 2003; Nnaji et al., 2002), the same cannot be said of the other landuses recorded in the area of study. And how varied management in a small area will impact the soils was also not investigated.
So, the aim of the study was to determine the long term effect of landuses, oilpalm plantation, arable cultivation, home garden, grass lawn, on physico-chemical properties of soils on a plain in Lorji. With landuse being the only differentiating factor in the sampled area, the specific objectives of the study were to determine:
(1) Intra- and inter-management units’ variations of soils’ physico-chemical properties;
(2) Statuses of parameters under each management unit;
(3) Most important soil quality parameters indicating soil degradation in the location;
(4) Management practice best suited to soils.
MATERIALS AND METHODS
Study area
The location of study is Eziala village, Lorji Nwe-Ekeukwu autonomous community, Aboh-Mbaise Local Government Area, Imo State Nigeria. The place is between Lat. 5°24| to 23.2||N, and Long. 7°16| to 56.9||E. The geology is dominantly Coastal plains sand. It is in the humid tropics with 3 dry months each having less than 60 mm rainfall a month. Total annual rainfall is 2,250 to 2500 mm. Temperatures are high, changing only slightly during the year, with mean daily temperatures of about 27°C (Oti, 2002). Location belongs to the low land rainforest dominated by Oilpalms (Elaeis guineensis) and pennisetum grass species (Igbozurike, 1975). The area of the Coastal plains sand in Imo State, Nigeria is about 3,401.29 km2 (340,129 ha), 61% of which is made up of flat land having not more than 0.5% slope. By the latest (2006) census figures as recorded in the Federal Government of Nigeria Gazette of 2007, the location has an average population density of 1,206 persons/km2, while it is 1,055 persons/km2 for Aboh-Mbaise Local Government Area of the state. The soils are classified as Typic Kandiudult (USDA, Soil Taxonomy)/Haplic Ferralsols (FAO/Unesco) (Ukaegbu, 2014). Oti (2002) describes the soils as acidic, having low CEC, low base saturation, low fertility status and multinutrient deficiencies.
Altitude of site of study is 83 m above sea level. Figure 1 shows location of study.

Experimental design
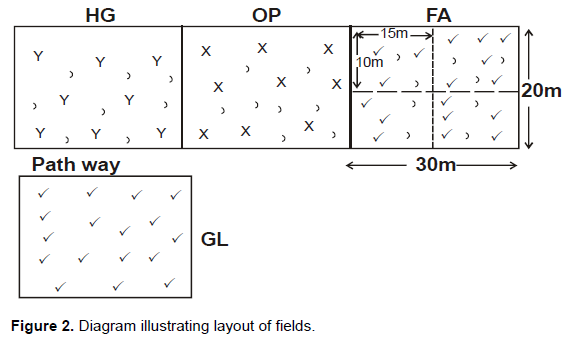
Four landuses were used for the study. These were an old home garden site (HG), oilpalm plantation (OP), fallow arable field (FA), and grass lawn (GL). The different landuses were contiguous. Site of study is a flatland that had been subjected to the same landuses for over 30 years. The oilpalm plantation was sandwiched by the home garden and arable field, while the grass lawn was beside them, separated by a pathway. This layout is illustrated by Figure 2.
The home garden had assorted tree crops that were irregularly spaced, and these included Oilbean (Pentaclethra macrophylla), Ogbono (Irvingia gabonensis), Bitter kola (Garcinia kola), Kola (Cola nitida), Rose Apple (Eugenia jambes), Local Pea (Dacryodes edulis), Oilpalm (Elaeis guineensis), and Mango (Mangifera indica). The home garden had been subjected to cultivation in the past, with the cultivation involving bush clearing with cutlass, burning of trash, making of mounds with hoe, planting of crops such as yam, cassava, maize and vegetables (e.g. telfaria) on the mounds, as well as applying farm yard manure which included ash from the kitchen. The cultivation was on a yearly basis. It was a form of traditional agroforestry practice. However, the plot had been fallow (uncultivated) for six years by the time of the experiment.
The oilpalm plantation plot was planted to oilpalms, with the normal spacing of 9 m in triangular pattern (Komolafe et al., 1979) observed. At the time of the experiment, the plantation was 38 years old. The plot was intercropped with cassava and maize at interval of three years. Cultivation involved clearing of the bush (that is, undergrowths) with cutlass, burning of trash, making of mounds with hoes, planting of crops on mounds, and application of fertilizers (mainly, N, P, K, 15:15:15). At the time of the experiment the plot had not been cultivated for six years, and thus had the oilpalm trees with undergrowths.
The arable field was cultivated mainly to cassava and maize, to which were applied N, P, K, 15:15:15. The cultivation was at interval of three years and also involved slashing with cutlass, mound making with hoes, application of fertilizer (NPK, 15:15:15). At the time of the experiment, the plot was in its first year of fallow.
The grasslawn was made up of mainly Bahama grass and was slashed periodically. At the time of the experiment, the lawn was well kept with low grasses. This plot had not been cultivated for over 30 years.
With the exception of the grasslawn managed by a school, the rest of the landuses (plots) were farmer-managed.
Each of the landuses was taken as a treatment. The experiment was of a randomized complete block design (RCBD).
Sampling
An area of 600 m2 (20 m × 30 m) was mapped out from each management unit and taken as a plot. Total area mapped out from all landuses was thus 2,400 m2. Each of the plots was further subdivided into four equal subplots (150 m2 = 10 m × 15 m) as illustrated in the FA section of Figure 2, for the purpose of sampling. From each subplot, four surface (0-30 cm) samples were systematically collected with the Auger. This meant 16 of such samples were got from each plot, while a total of 64 samples were taken from all plots at this stage of sampling. The four samples from each subplot were then bulked, with the result that each treatment had four bulk samples. Each of the samples thus represented a replicate. A total of 16 bulked samples were therefore collected and used for the study. The depth of sampling represents the average for flat surface soils of the area (Oti, 2002; Ukaegbu, 2014).
Sampling was done once and in the month of June, during the rains when leaching process was at its peak. Sampling was not repeated in the next year as plots under the management of farmers were cultivated.
Laboratory analyses
The soil samples were air-dried and sieved with a 2-mm sieve. The particle size analysis was by the method of Bouyoucos (1951). Soil reaction (pH) was determined using the glass electrode meter at a
soil: water ratio of 1:2.5. Organic carbon was determined using oxidation method modified by Nelson and Sommers (1990). Organic matter was then got by multiplying the value of organic carbon with 1.724. Available phosphorus was determined using Bray II method of Bray and Kurtz (1998). Exchangeable bases were extracted with neutral normal ammonium acetate solution. Ca2+ and Mg2+ in the extract were determined by EDTA titration, while K+ and Na+ were got by flame photometer. Exchangeable acidity was determined by the method of Mclean (1965). Effective cation exchange capacity (ECEC) was calculated as the summation of total exchangeable bases and exchange acidity. Base saturation was got by expressing total exchangeable bases (TEB) as percentage of ECEC.
Statistical analyses
Spatial variability of each parameter within each management unit and over the whole area sampled was determined using coefficient of variation (CV), given by expressing standard deviation as a percentage of mean of parameter. The CVs got were rated based on the rating scale of Wilding et al. (1994): CV (%) £15%, low; >15 £35%, moderate; >35%, high.
The CV values were plotted in the form of frequency distribution graph for each management unit and entire field.
Data of each parameter in the various management units were subjected to Analysis of Variance (ANOVA), with the means for the various units separated by LSD at 5% significance level. Relationships of some indices of soil degradation used in soil evaluation were determined using Pearson’s Product Moment Correlation Model at 5% significance level.
Qualities of soils under different management units were rated on the basis of parameters to determine their usefulness as indices of soil quality.
RESULTS
Variability of soil properties
The variability of soil properties expressed as CV is shown in Table 1, with the attached small letters representing variability groupings according to Wilding et al. (1994).

Parameters with low variation against the management units were: sand, silt, pH, OM, Ca, K, Na, ECEC, BS (HG); sand, clay, pH, OM, ECEC, BS (OP); sand, silt, clay, pH, OM, ECEC, BS (FA); sand, pH, OM, K, Al+H, BS (GL); sand, pH (Entire field). Those with moderate variation were: clay, Mg, Al+H, (HG); silt, av.P, Ca, Mg, K, Al+H (OP); Ca, Mg, K, Na (FA); silt, clay, av.P, Na, ECEC (GL); silt, clay, OM, K, Na, ECEC, BS (Entire field). Those with high variation were: av.P (HG); av.P, Al+H (FA); Ca, Mg (GL); av.P, Ca, Mg, Al+H (Entire field), and none for unit OP.
The line graphs represented by Figure 3a, b, c, d, and e show the distributions of CV values to vary as management and land area. While the parameters whose CVs constitute the peaks of frequency curves vary with management in most cases, those that constitute the lowest points are sand and pH in virtually all the cases. Distributions tend to be normal in HG but skewed in the others.

The analysis of variance (ANOVA) as shown by the capital letters in Table 1 indicated the parameters sand, OM, pH, Ca, Mg, K, Al+H, ECEC, and BS to be significantly influenced by management.
Rating of parameters
The parameters are rated following the ratings of Enwezor et al. (1989) and Chude et al. (2011). The average pH value for plot A is moderately acid, while the others are strongly acid. The OM contents were generally high for soils of the area. Exchangeable Ca was very low for plot D, but only low for the other units. Exchangeable Mg was high (2.63 Cmol kg-1) for plot A, but moderate for the rest, with plot D having the least value of 1.13 Cmol kg-1. Exchangeable K was low for plot A (0.25 Cmol Kg-1), but very low for the rest, with the least value of 0.16 Cmol kg-1 got in plot D. Exchangeable Na was low for plots A, B and D (0.25 - 0.26 Cmol kg-1), but moderate for plot C which value was 0.34 Cmol kg-1. Base saturation was very high for plot A (92.29%), but high for the rest with the least value of 63.48% got in plot D. Available-P was high for all the plots. Exchange acidity for plot A was the least at an average value of 0.63 Cmol kg-1, but highest for plot D which had a value of 1.75 Cmol kg-1. Effective cation exchange capacity (ECEC) was low for plots A and C (8.12 and 6.31 cmol kg-1 respectively) but very low for plots B and D which had values 5.8 cmol kg-1 and 4.92 cmol kg-1, respectively, indicating dominance of 1:1 type of clay. From the ratings it can be seen that the soils, particularly of plots B, C and D, are limited mainly by strong soil acidity, low ecec, as well as low contents of Ca and K.
Nutrient balance
Availability of nutrients for plant uptake does not depend entirely on their absolute values in soils, but also on their ratios/balance. Table 2 shows average values of the ratios Ca/Mg, Mg/K, K/Mg, Ca/TEB, and % (K/TEB) for the various management units.

These ratios are noted to influence the availability of nutrients (Ahukaemere et al., 2014; Msanya et al., 2016; Udo et al., 2009). Table 2 shows plot C to have the highest value of 1.83 for Ca/Mg ratio, while plot B had the least value of 1.36. Msanya et al. (2001) record that Ca/Mg ratio of 2 to 4 are considered favourable for most crops. Udo et al. (2009) record that for Ca:Mg ratio > 5:1, there is possibility of Mg and (with high pH) P inhibition; 3:1 – 5:1 is normal range; while < 3:1 signifies possibility of P inhibition and Ca deficiency. Similarly, Landon (1984) notes Ca/Mg ratio that is less than 3 to result in unavailability of Ca and P. Observed values of the ratio are less than the optimal range indicating possible unavailability of Ca and P. This could be worse for plots B(OP) and D(GL) with the lowest values. Mg/K ratio ranges from 10.52 for plot A to 7.06 for plot D. Landon (1991) records Mg/K ratio of 1 to 4 as optimal for nutrient uptake by plants. Observed values are above the optimal thus signifying imbalance. On the other hand, K/Mg ratio ranges from 0.10 for HG to 0.14 for GL unit. Ahukaemere et al. (2014) note a K/Mg ratio of 3:1 or little wider as favourable for plants; while Udo et al. (2009) record ratio greater than 2:1 could affect Mg uptake. However, the low K/Mg ratio recorded indicates need for liming (Ahukaemere et al., 2014). Ca/TEB ratio varied from 0.22 (GL) to 0.58 (HG). According to Landon (1991), Ca/TEB ratio of less than 0.5 is favourable for the uptake of other cations particularly Mg and/or K. The ratios observed may be indicating availability of Mg and K, except perhaps for plot A. According to Uwingabire et al. (2016) and Uwitonze et al. (2016), % (K/TEB) for topsoil above 2% is considered favourable for most tropical crops. The observed values range from 2.13% for plot D, to 3.33% for plot A, which are therefore conducive for plant growth.
Evaluation by other indices of soil degradation
The factors silt/clay, fine sand/coarse sand, Ca/Mg, Ca+Mg, Ca+Mg/Al+H, OC and Al-saturation had been recommended by Oti (2002) as reliable predictors for identification and delineation of erosion classes for the tropical ultisols. Some of these parameters have been used in evaluating the soils as indicated by Table 3.

The values for Ca+Mg ranged from 2.76 (GL) to 7.01 (HG). Ca/Mg ratio varied from 1.36 (OP) to 1.83 (FA). The ratio Ca+Mg/Al+H had values ranging from 1.58 (GL) to 11.13 (HG). ESP varied from 3.08 (GH) to 5.39 (FA). Silt/clay ratio had values ranging from 0.40 (FA) to 0.49 (HG). These were however, average values for the management units. The coefficients of variation (CV) of these values, among the management units (as shown by Table 3) were 33.98, 11.78, 79.84, 20.0, and 8.14% for the indices Ca+Mg, Ca/Mg, Ca+Mg/Al+H, ESP, silt/clay, respectively. This means Ca/Mg and silt/clay ratios have varied lowly among the management units, while the others varied moderately to highly. Those that varied relatively highly are better differentiators of the management units.
Using the parameters, soils of management units can be rated on the basis of that of the home garden (HG) with best quality or, in the reverse order that of grass lawn (GL) with worst quality. This can be shown using the indices: OM, Ca+Mg, Al+H, Ca+Mg/Al+H. On the basis of OM, the value of 5.68% for HG is taken as 100%. Relative to this, the contents for the other units are:
73.59% (OP); 89.44% (FA); 72.54% (GL). So, the extent to which the other landuses are degraded, in terms of OM are: 26.41% (OP); 10.56% (FA); 27.46% (GL). Using Ca+Mg as basis for evaluation, the value of 7.01 for HG is the standard, taken as 100%. Then the values for the other units, expressed as percentage of that of HG are: 58.91% (OP); 60.63% (FA); 39.37% (GL). So, the extent to which the units are degraded by this index are: 41.09% (OP); 39.37% (FA); 60.63% (GL). Using the ratio Ca+Mg/Al+H as basis for evaluation and taking the value of 11.13 for HG as standard, then the values for the other units, OP, FA, GL are, 30.19, 24.98, 14.20% respectively. So, by this index the extent to which the units OP, FA, GL are degraded are: 69.81, 75.02, and 85.80%, respectively.
In reverse order, the value of Al+H which is highest in the GL (1.75 cmol/kg) can be used as standard. So, as percentage of the GL value, the other units are: 36% (HG); 70.29% (OP), 87.43% (FA). Because this index is in the negative, subtracting these values from 100 gives the actual quality of each of the units thus: 64% (HG); 29.71% (OP), 12.57% (FA).
How these indices of soil quality or degradation relate among themselves is shown in Table 4. The ratio Ca+Mg/Al+H has significant (p<0.5) positive correlation with Ca+Mg and OM, with correlation coefficients (r) of 0.97 and 0.82, respectively; but significant negative correlation with esp and exchangeable acidity with correlation coefficients of -0.94 and -0.96, respectively. ESP and exch. acidity had significant positive correlation (r = 0.97) with each other. Organic matter has correlated with most of the indices. It has significant positive correlation (r = 0.78 to 0.88) with Ca+Mg, Ca/Mg, Ca+Mg/Al+H, but negative correlation (though not significant) with ESP and exch. acidity. This shows OM to influence the indices much. The higher the values of OM, Ca+Mg, and Ca+Mg/Al+H, the greater the quality of soils; while the higher the values of ESP and exch. acidity, the more degraded the soils.

DISCUSSION
Spatial variability of soil properties in any field is due to soil forming factors, including management (Beckett and Webster, 1971; Igbal et al., 2005). In the present study, only management varied while the other factors were constant. Variation in management included differences in crops, soil amelioration/fertilizer application, and in tilling. The influence of management on variability of properties has manifested in various ways.
Available-P varied most in plots A, B, C, with the highest CV of 45.33% recorded in plot C and the least (28.71%) recorded in plot D which had not been fertilized. While tilling/cultivation homogenizes the soils’ particle sizes, it also brings up finer particles (Akamigbo, 1999; Dilkova et al., 1998) hence the sand separate was significantly lower in plot C at 73.8% than the rest. Generally, the particle sizes had least variation in plot C. The high within-field variation of some of the properties in plot C is attributed to the fact of the plot being the most recently cultivated. Beckett and Webster (1971) reported that variability rises in recently fertilized fields but reduces with fallow. Burning of trash might have contributed to the high variability of exch. acidity (Al+H) in plot C. The biggest within field CV for exch. acidity of 43.79% was recorded in plot C. while the least (8.0%) was recorded in plot D. Fraser and Scott (2011) as well as Nye and Greenland (1964) recorded the burning of timber and trash to not only increase soil pH but also to contribute to the spatial variability of soil acidity. Relatively high values of OM and ECEC in plot C might have arisen from fertilizer application. Ellerbrock and Gerk (2016) found all types of fertilizer to increase CEC and SOM in soils.
Most parameters: OM, pH, av.P, exchangeable bases, BS, ECEC; had their biggest values in plot A (HG). This is attributed to the greater addition of organic matter in the plot as had also been recorded for fallow forests in the area (Akamigbo, 1999; Asadu and Bosah, 2003; Nnaji et al., 2002). Trees and shrubs with their deep roots have been noted by Young (1998) to mobilize bases from soil substrate which help counteract soil acidity, increase nitrogen content and produce enough biomass to maintain soil humus content. The other management practices lack these qualities. Residual effect of soil amendments/organic manuring of the HG unit might as well have contributed to the quality of the soils. Application of woodash as well as animal manures to the acid ultisols of southeast Nigeria has been noted to significantly reduce the soils acidity (Ano and Ubochi, 2007; Nottidge et al., 2006). Such amendments have been found to persist in soils seven years after application (Wuest and Reardon, 2016). This further explains some of the contrasts with earlier studies. Nnaji et al. (2002) found soil pH, BS and av.P to be significantly lower in forest soil, while OC, TN, total exch. acidity and cec were higher relative to the cultivated. With the exception of exch. acidity which was significantly lower in plot A, the other chemical properties were higher in the plot than in the others. The relatively low variability of soil properties in HG unit (plot A) agrees with Ghartey et al. (2012) who found natural fallows to decrease soil variability.
Generally, variations of properties within management units were less than those over the entire field. The reasons, according to Beckett and Webster (1971) include the fact that variances increase with size of area sampled; the between-field component of variance for properties much affected by management tends to be greater than that of more durable properties; the bulking of samples masks the within field component of variance. However, properties have varied on disparate scales. Sand and pH had low variation within management units and entire field, indicating macrouniformity. On the other hand, OM, ECEC, BS generally had low variation within management units but moderate variation over the entire field. The other properties, particularly av.P, Ca, Mg, exch. acidity varied highly within field and over the entire field. These later properties can be said to be microvariable and most influenced by management. Zheng et al. (2009) noted strong spatial dependency of soil properties to be related to structural intrinsic factors such as texture, parent material and mineralogy, while weak spatial dependency is related to random extrinsic factors such as plowing, fertilization and other soil management practices.
The rate of variation of parameters within a small area of 2,400 m2 in the study is attributable to land fragmentation and accompanying differences in management. The limit of 33% (CV) set by Akamigbo (1986) to signify homogeneity within a map unit in the area of study has been exceeded in the small area sampled. Soil sampling in the area for fertility survey should therefore be at high intensity.
By rating, the soils particularly of plots B, C and D are limited mainly by strong soil acidity, low ECEC, low contents of Ca and K. This is supported by low Ca/Mg and K/Mg ratios, as well as high Mg/K ratio signifying nutrient imbalance, the potential to limit availability of Ca, Mg, and P, while indicating the need for liming. Relating soils of units OP, FA, and GL to that of HG further showed the parameters OM, Ca+Mg, Ca/Mg, Al+H, Ca+Mg/Al+H, ESP as indices of degradation. The parameters that have varied more proved to be better indices of degradation. Among these indices, the ratio Ca+Mg/Al+H varied most as shown in Table 3 and captured the degradation most. The soil qualities as quantified by the index (Ca+Mg/Al+H) are in the order HG>OP>FA>GL. The other management practices accentuate soil acidification more than the HG unit. Though OM had not captured the full extent of degradation, it had significant positive correlation with the positive indices Ca/Mg, Ca+Mg, Ca+Mg/Al+H, thus showing its significance on the soils’ qualities. These characteristics identified as indices of soil quality can be used to develop quantitative models for estimating soil quality in the area (Brevik et al., 2016). The soils, particularly of OP and FA, can be improved by adding organic manure, liming and planting of legumes. The soil conditions of HG unit should generally guide soil management in the area. In the absence of virgin forests, soils of old home garden sites that are fallow for not more than seven (7) years can be used as standards to measure the extent of degradation of soils under other landuses.
CONCLUSION
Landuse has influenced physico-chemical properties of the soils. Strong soil acidity and associated problems of nutrient deficiencies are the main soil fertility constraints, which have been captured best by the ratio Ca+Mg/Al+H. Based on the index the order of qualities of the soils of the management units were HG>OP>FA>GL. Management should aim at meeting the standards of the home garden site. Study has shown organic manuring and liming as critical for the soils management.
CONFLICT OF INTERESTS
The authors declare no conflict of interest.
REFERENCES
|
Adaikwu AO, Ali A (2013). Assessment of some soil quality indicators in Benue State. Nigeria Journal of Soil Science 23(2):66-75. |
|
|
Ahukaemere CM, Eshett ET, Ahiwe C (2014). Characterization and fertility status of wetland soils in Abia State agro-ecological zone of southeastern Nigeria. Nigerian Journal of Soil Science 24(1):147-157. |
|
|
Akamigbo FOR (1986). Soil variability within map units in areas of low and undulating relief: A case study on Abakaliki/Okigwe anticlinorium, eastern Nigeria. Nigerian Agricultural Journal 21:81-29. |
|
|
Akamigbo FOR (1999). Influence of Landuse on Soil Properties of the humid tropical agroecology of Southeastern Nigeria. Nigerian Agricultural Journal 30:59-76. |
|
|
Ano AO, Ubochi CI (2007). Neutralization of Soil acidity by animal manures: Mechanism of reaction. African Journal of Biotechnology 6(4):364-368. |
|
|
Asadu CLA, Bosah CS (2003). A comparative study of the soils of the Upper coal-measure Residua under cropped-grass-forest land continuum in Eastern Nigeria. East African Agricultural and Forestry Journal 68(4):2005-2212. |
|
|
Asadu CLA, Nweke FI, Enete AA (2008). Soil properties and intensification of traditional farming systems in sub-Saharan Africa. Agro-Science 7(3):186-192. |
|
|
Beckett PHT, Webster B (1971). Soil Variability: A review. Soil and Fertilizers 34(1):1-15. |
|
|
Bouyoucos GJ (1951). A recalibration of the hydrometer method for making mechanical analysis of soils. Agronomy Journal 43:435-438. |
|
|
Bray RH, Kurtz LT (1998). Determination of total and available forms of phosphorus in soils. Soil Science 59:39-45. |
|
|
Brevik EC, Calzolari C, Miller BA, Pereira P, Kabala C, Baumgarten A, Jordan A (2016). Soil Mapping, Classificaiton, and modeling: History and future directions. Geoderma 264:256-274. |
|
|
Chude VO, Malgwi WB, Amapu IY, Ano OA (2011). Manual on Soil Fertility Assessment. Federal Fertilizer Department in Collaboration with National Programme for Food Security, Abuja, Nigeria. P. 62. |
|
|
Dilkova R, Kerchev G, Kercheva M (1998). Evaluating and grouping of soils according to their susceptibility to anthropogenic degradation. Advances in GeoEcology 31:125-131. |
|
|
Ellerbrock RH, Gerke HH (2016). Analyzing Management-induced dynamics of soluble organic matter composition in soils from long-term field experiments. Verdose Zone Journal 15:4. |
|
|
Enwezor WO, Udo EJ, Usoroh NJ, Ayotade KA, Adepeta JA, Chude VO, Udegbe CI (1989). Fertilizer use and Management Practices for Crops in Nigeria. Series No 2. Fertilizer Procurement and Distribution Division, Federal Ministry of Agriculture, Water Resources and Rural Development, Lagos, Nigeria P. 163. |
|
|
Federal Department of Agricultural Land Resources (FDALR) (1999). Status of Agricultural Landuse in Nigeria. In: Evolving an Effective Agricultural Landuse Policy for Nigeria. Abuja, Federal Ministry of Agriculture and Natural Resources, P. 165. |
|
|
Fraser MA, Scott BJ (2011). Variability of acidity in agricultural soils - The impact of timber burning at Land clearing. Soil Research 49:223-230. |
|
|
Ghartey EO, Dowuona GNN, Nartey EK, Adjadeh TA (2012). Assessment of variability in the quality of an Acrisol under different landuse systems in Ghana. Open Journal of Soil Science 2:33-43. |
|
|
Idowu OJ, Aduramigbo VO, Ande FT (2003). Variability in Surface Properties of an Alfisol as Function of Types of Landuse. Communications in Soil Science and Plant Analysis 34(19&20):3045-3058. |
|
|
Igbal I, Thomasson JA, Jenkins JN, Owens PR, Whisler FD (2005). Spatial variability analysis of soil physical properties of alluvial soils. Soil Science Society of America Journal 69(4):1338-1350. |
|
|
Igbozurike MU (1975). Vegetation Types. In: Ofomata GEK (ed.). Nigeria in Maps: Eastern States. Benin City, Ethiope Pub. House P. 146. |
|
|
Karlen DL, Mausbach MJ, Doran JW, Cline RG, Harris RF, Schuman GE (1997). Soil quality: A concept, definition and framework for evaluation. Soil Science Society of America Journal 61:4-10. |
|
|
Komolafe MF, Adegbola AA, Are LA, Ashaye TI (1979). Agricultural science for West African Schools and Colleges (2nd edn). Ibadan, Univ. Press. Ltd. P. 228. |
|
|
Lageman J (1981). Problems of agricultural production in the humid tropical lowlands. In: Agroforestry, Proceedings of a Seminar held in CATIE Turrialba, Costa Rica, 23 February - 3 March, 1981. |
|
|
Lal R (1986). Soil Surface Management in the tropics for intensive landuse and high and sustained production. In: Advances in Soil Science, Springer Verlag, New York Inc., 5:1-108. |
|
|
Landon JR (1984). Tropical Soil Manual. Booker Tate Ltd. P. 476. |
|
|
Landon JR (1991). Booker Tropical Soil Manual: A handbook for Soil Survey and Agricultural Land Evaluation in the Tropics and Sub-tropics. New York, Longman Inc. P. 474. |
|
|
Mclean EO (1965). Aluminum. In: Black CA (9th edn). Methods of Soil Analysis. Part 2, Agronomy, Madison, Wisconsin, pp. 986-994. |
|
|
Msanya BM, Kimaro DN, Kileo EP, Kimbi GG, Munisi AIM (2001). Land Resources Inventory and Suitability Assessment for the Production of the Major Crops in the Eastern Part of Morogoro Rural District, Tanzania. Soils and Land Resources of Morogoro Rural and Urban Districts, Department of Soil Science, Faculty of Agriculture, Sokoine University of Agriculture, Morogoro, Tanzania 3:69. |
|
|
Msanya BM, Munishi JA, Amuri N, Semu E, Mhoro L, Malley Z (2016). Morphology, genesis, physico-chemical properties, classification and potential of soils derived from volcanic parent materials in selected Districts of Mbeya Region, Tanzania. International Journal of Plant Soil Science 10(4):1-19. |
|
|
Nelson DW, Sommers LE (1990). Total Carbon, Organic Carbon and Organic Matter. In: Miller RH, Keeney DR (Eds.). Methods of Soil Analysis. Chemical Method, ASA and SSA. Madison 39:1085-1121. |
|
|
Nnaji GU, Asadu CLA, Mbagwu JSC (2002). Evaluation of Physico-Chemical Properties of Soils under selected Agricultural Land Utilization Types. Agro-Science 3(1):27-33. |
|
|
Nottidge DO, Ojeniyi SO, Asawalam DO (2006). Effect of different levels of Woodash on Soil Chemical properties in an acid Ultisol of Southeast Nigeria. Nigerian Journal of Soil Science 16:109-114. |
|
|
Nye PH, Greenland DJ (1964). Changes in the soil after clearing tropical forest. Plant and Soil 21:101-112. |
|
|
Ogunkunle A (2015). Soil quality maintenance by sustainable landuse/management: an imperative for food security. Special edition of the Nigerian Journal of Soil Science 25:11-45. |
|
|
Oti NN (2002). Discriminant Functions for Classifying erosion degraded lands at Otamiri, Southeastern Nigeria. Agro-Science 3(1):34-40. |
|
|
Rodrigo-Comino J, Keshavarzi A, Bagherzadeh A, Brevik EC (2019). The use of Multivariate Statistical analysis and soil quality indices as tools to be included in regional management plans. A case study from the Mashdad Plain, Iran. Geographical Research Letters 45. |
|
|
Smalling CMA, Fresco LO, de Jager A (1996). Classifying, Monitoring and Improving Nutrient Stocks and flows in African Agriculture. AMBIO 25(8):492-496. |
|
|
Udo EJ, Ibia TO, Ogunwale JA, Ano AO, Esu IE (2009). Manual of soil plant and water analyses. Lagos, Sibon Books Ltd, P. 183. |
|
|
Ukaegbu EP (2014). Soil Characterization and Land Evaluation of Owerri Agricultural Zone, Imo State, Nigeria. A Ph.D Thesis. Department of Soil Science, University of Nigeria, Nsukka. |
|
|
Uwingabire S, Msanya BM, Mtakwa PW, Uwitonze P, Sirikare S (2016). Pedological Characterization of Soils developed on gneissic-granite in the Congo Nile Watershed Divide and Central Plateau Zones, Rwanda. International Journal of Current Research 89(9):39489-39501. |
|
|
Uwitonze P, Msanya BM, Mtakwa PW, Uwingabire S, Sirikare S (2016). Pedological Characterization of Soils developed from volcanic parent materials of Northern Province of Rwanda. Agriculture, Forestry and Fisheries 5(6):225-236. |
|
|
Uzozie LC (1975). Food-crop combination and Agricultural Regions. In: Ofomata GEK (Ed). Nigeria in Maps: Eastern States. Benin City, Ethiope Publishing House P. 146. |
|
|
Wilding LP, Bouma J, Boss DW (1994). Impact of spatial variability on interpretative modeling. In: Bryant RB, Arnold RW. Quantitative modeling of soil forming process. SSSA Special Publication, No. 39:6175. |
|
|
Wuest SB, Reardon CL (2016). Surface and root inputs produce different carbon/phosphorus ratios in soil. Soil Science Society of America Journal 80:463-471. |
|
|
Young A (1998). Land resources now and for the future. Cambridge: Cambridge University Press P. 319. |
|
|
Zheng H, Wu J, Zhang S (2009). Study on spatial variability of farmland soil nutrient based on the kriging interpolation. AICI, International Conference on Artificial Intelligence and Computational Intelligence, November 7-8, Shanghai, China 4:550-555. |
|
Copyright © 2024 Author(s) retain the copyright of this article.
This article is published under the terms of the Creative Commons Attribution License 4.0


