Full Length Research Paper

ABSTRACT
A motorized legume thresher was redesigned to utilize coefficient of friction to separate grains from impurities, the thresher performance was evaluated and best combination of parameters for highest separation efficiency determined. The study was carried out using a randomized design of three batch weights (BW): 100, 150 and 200 g, four surfaces (S) mild steel, plywood, rubber carpet and rug at an angle of inclination of 25° and a height fall of 90 mm, two impurity levels (I) using cowpea (Vigna unguiculata) IT84S-2242 and soybean (Glycine max L) 1448-2E variety. Sorghum seeds at 10% of each batch weight were mixed in with each test samples as additional impurity. Data obtained was analyzed using SAS and Duncan tests. Results showed, cleaning efficiency varied between 90 and 63.28% for soybean samples, threshing efficiency varied between 87 and 97% with an average minimal damage of 0.78% from using carpet surface. For cowpea threshing and cleaning efficiencies were 97.44 and 97.16%, respectively with average loss 2.60%. Analysis of variance (ANOVA) showed that impurity level and feed rate affected cleaning efficiency at both 1 and 5% significance, type of surface affected threshing percentage and broken seeds at 5% significance. The best combination of batch weight, surface and impurity level to obtain cleaning efficiency, threshing efficiency, low grain damage and grain losses was 100 g batch weight using carpet surface. In conclusion, coefficient of friction could be utilized to increase separation efficiency of thresher, this would aid the development of appropriate technologies for legumes processing.
Key words: Threshing, threshing efficiency (TE), cleaning efficiency (CE), coefficient of friction, percentage impurity.
INTRODUCTION
Agricultural mechanization involves using agricultural machinery to perform farm operations speedily and efficiently. It plays a significant economic role by reducing cost of cultivation, increasing agriculture production and in increasing productivity as well as overall returns to the farmers (Kamboj et al., 2012). Mechanization is critical to meet the increased food demand from global human population explosion (Irtwange, 2009).
Cowpea and soybean are legumes commercially cultivated in more than 35 countries of the world, soybean is the world’s leading vegetable oil source and accounts for about 20 to 24% of plant based oils in the world (Polat et al., 2006). Soybean is also an important food source in human and animal nutrition with total worldwide production of about 180 million tons per year (Manuwa, 2011). The importance of cowpea lies in its food value as a major source of protein of high biological value, energy, vitamins and roughage, Nigeria cultivates about 40 million hectares of cowpea and produces an estimated 850,000 tons annually (Faleye et al., 2013; Olaoye, 2011).
The post-harvest processing of these legumes into animal and human food poses enormous challenges, because poor harvesting and post-harvest handling methods often leads to the introduction of contaminants such as stones, sticks, chaff and dust which necessitates cleaning into the grains (Ajit et al., 2006). Threshing considered as one of the foremost important post-harvest operation in crop processing (Dhananchezhiyan et al., 2013), is the removal of grains from the plant residues and results in the separation of impurities and contaminants from sound grains, thus reducing the problems that occur during storage and handling (Ajit et al., 2006).
Grain cleaning is the separation and removal of chaff and other debris such as foreign materials, broken kernels and splits from grains (Wang et al., 1994), by using the aerodynamic properties of crops such as terminal velocity and drag coefficient so that desirable products are separated from unwanted materials (Vasundhara et al., 2019). Air is introduced into the stream of crops and foreign material at a velocity lesser than the terminal velocity of crops but greater than the terminal velocity of unwanted materials to achieve separation due to distinct differences between the velocities of individual components in the mixture (Panasiewicz et al., 2012). This separation is conventionally carried out using screen or pneumatic separators, this results in the separation of those contaminants from sound grains and reduces the problems that occur during storage and handling and is (Wang et al., 1994). Some of the factors that influence the precision of segregation of the components in a mixture are evenness of feeding the input material, initial velocity of the input material, velocity and turbulence of the stream of air, and the time the input mixture stays in the stream of air (Panasiewicz et al., 2012). Mechanization of cleaning operation saves effort, reduces crop losses and reduces operation time. A good cleaning machine should therefore remove all chaff straws and plant debris with very little grain loss (Muhammad et al., 2013).
Processing factors affect separation, for instance El-Khateeb et al. (2008) showed that the combination of airstream velocity and specific feed rate significantly affected cleaning efficiency of sunflower heads, while increasing feed rate from 2.5 to 10 kg/min caused 1.95% decrease in cleaning efficiency (Hemmat et al., 2007). Also, machine factors affects separation efficiency, an increase in threshing drum speed in sunflower processing from 300 to 600 rpm, increased the cleaning efficiency by 4.82 and 6.51% at 2.5 and 10 kg/min feed rates (Chimchana et al., 2008). This is because high drum speed increased the velocity of cleaning air which resulted in higher capability of air to carry the foreign material and residual of sunflower heads from seeds consequently increased cleaning efficiency (Chimchana et al., 2008). Awady and Sayed (1994) reported mean values of peanut grains terminal velocity were 4.3, 6.5, 6.8, and 7.2 m/s for shells, unshelled, split and intact seeds, respectively, so that 7.5 m/s air speed separated 96% of shells with losses of 3% of unshelled seeds. Aderinlewo et al. (2011) reported that at 8.2 to 18.2% moisture content, the terminal velocity for four cowpea varieties was 13.72-14.04 m/s (Ife brown), 14.14-14.47 m/s (Drum), 13.80-14.30 m/s (Ife 98-12) and 13.35-14.30 m/s (IT90K-277-2) and reported higher terminal velocity as cowpea seed mass increases. Owolarafe et al. (2007) applied static COF to separate cocoa husks and beans mixture, by sliding test samples on an inclined plane covered with rubber or carpet material. The separation efficiency at angle of inclination 35° was 50 to 86%, while separation efficiency at 25° was 80 to 99%, at separation efficiency at angle of inclination 20° was 74 to 97%. This shows that increasing the angle of inclination reduces the separation efficiency, because increased angles encourages quick bulk flow of materials, while small angle of inclinations causes materials to slide down the incline slowly. Thus differences in the static COF of cocoa seeds and its husks could be used to separate them (Owolarafe et al., 2007). Ibrahim (2007) reported COF of cowpea grains on four surfaces as rubber (0.37 - 0.40), aluminium (0.32 - 0.35), stainless steel (0.20 - 0.24) and galvanized iron (0.17 - 0.21), while Polat et al. (2006) stated the static COF of soybean on three surfaces as plywood (0.22 - 0.35), glass (0.19 - 0.33), and galvanized steel (0.21 - 0.34).
This study redesigned a motorized thresher to incorporate different separation surfaces, evaluation tests were carried out to determine the performance of the modified legume thresher considering feed rate and level of impurity, so that the best combination of parameters for achieving optimal separation efficiency could be determined.
Machine description
The original threshing machine was designed to process cowpea only and is described in Ige (1978); it used a square cross-section threshing drum that gave it extra air separation effect. The thresher centrifugal fan is straight bladed and is capable of operating satisfactorily in an environment containing dust particles such as that which occurs during threshing (Ige, 1978). The reported threshing efficiency of the machine varied between 81 and 99% for the different cowpea varieties considered. Grain damage of 1 to 8% was recorded and chaff content between 11.5 and 18.3% were obtained (Ige, 1978). The thresher was redesigned to modify the cowpea thresher into a multi-crop thresher for legumes, this became necessary because soybean contains a higher amount of foreign materials and impurities as it is harvested with most of its stem and stalks intact. The modification were done to increase the cleaning efficiency of the machine at higher feed rates, ensure the machine efficiency is maintained for poorly harvested samples containing stones and to minimize cleaning loss when threshing soybean samples. This present study exploited the difference in COF of legume grains and chaff by introducing a slanted collection trough and introduced another centrifugal fan at the base of the collection trough.
MATERIALS AND METHODS
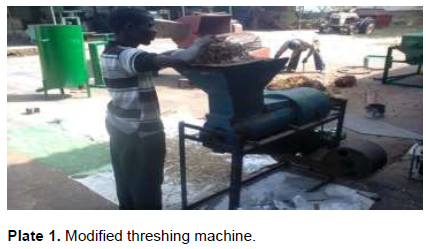
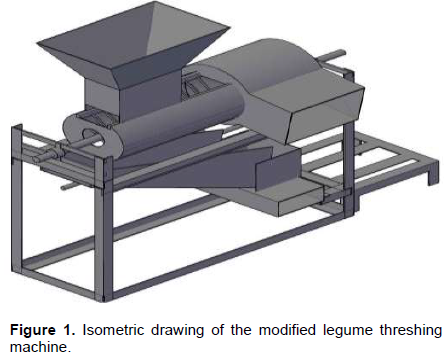
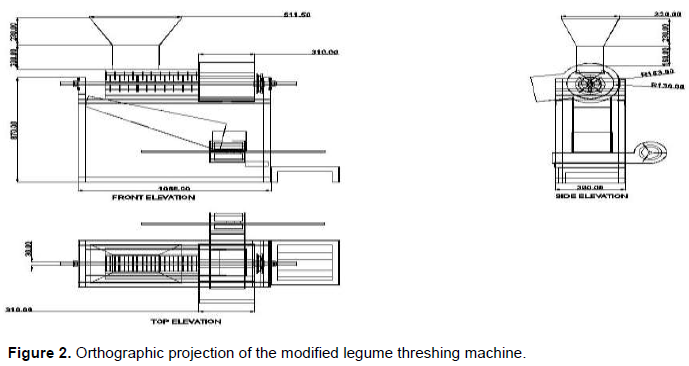
Plate 1 shows the modified threshing machine in operation. The AUTOCAD 3D isometric and orthographic drawings of the modified thresher are as shown in Figures 1 and 2, respectively. This inclined trough was attached beneath the threshing chamber and collected threshed materials which it discharged into a suitably attached blower. The trough was shaped as chute; its base rectangular dimension was 25 × 75 cm and was made of a 1.5 mm thick mild steel inclined at an angle 25° from the vertical. Four different materials mild steel (MSTEEL), plywood (PLYWD), rug (RUG) and carpet (CARPT) were utilized in the study. It was assumed that friction between chaff and the rug or carpet surface will reduce the velocity of chaff compared to grains, also plywood or mild steel should impart a higher rebound energy to grains as they land on the hard surface propelling them more quickly into the centrifugal fan. The trough base was then covered with the strips of each material. Combining an additional centrifugal fan and COF of crops should result in higher separate efficiencies; this assumption was verified by mixing in 10, 15 and 20% weight of sorghum seeds for each feed-rate into each sample experimental run. Threshed materials from each experimental run were collected in a well-labeled transparent polyethylene bag for analysis. The non-grain materials such as stones, stalks, sticks and chaff are referred to as materials-other than grain (MOG). Three replications were carried out for each treatment level combination for soybean and two replications for cowpea samples.
Performance evaluation of modified threshing machine
The moisture content (wet basis) of the soybean grain from oven drying method was 7.63 and the cowpea moisture content was 11.43%. Using the digital anemometer, air velocity of the blower was determined between 7.5 and 10.0 m/s at blower exit and 1.0 and 2.0 m/s at blower inlet. The COF of the cowpea variety on the four surfaces are: plywood (0.22-0.35), (0.37-0.40) on the rubber carpet made from mixture of polystreylene and polypropylene (CARPT) COF, rug (RUG) COF 0.33-0.35, and the unlined trough of mild steel material (MSTEEL) COF 0.17-0.28) were considered. Sorghum seeds were mixed with each test samples for threshing, at 10% weight of each batch (Aderinlewo et al., 2011). A digital air manometer (AM-4812) was used to record the air velocity produced by the blower. Also, a digital Tachometer (DT-2236B) was used to determine shaft speed. Preliminary tests resulted in carrying out performance evaluation with a reduced speed of between 1350 and 1550 rpm for the blower shaft and 800 to 900 rpm for the threshing shaft to avoid excessive grain damage. The evaluation was carried out in two phases using a completely randomized design. In the first phase, three batch weights 100, 150 and 200 g (corresponding to 10, 15 and 20 g/s feed rate, respectively) of two legumes cowpea (Vigna unguiculata) and soybean (Glycine max L) were used, to avoid chocking of the threshing drum. The batches were fed over a 10 s period giving 10, 15 and 20 g/s feed rate, respectively of the crop samples. The seeds were collected from Oyo State Agricultural Development Programme (OYSADEP) Iwo, Osun State and a private farm in Saki, Oyo State all in South West Nigeria. The following are the evaluated machine performance parameters.
Threshing efficiency (TE)
This is the ratio of the mass of threshed grains to the mass of the whole panicle, and is expressed in percentage as:
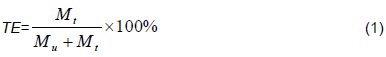
where TE is the threshing efficiency (%), Mt is the mass of threshed grains (g) and Mu is the mass of unthreshed grains (g) (Gbabo et al., 2013).
Cleaning efficiency (CE)
This is the ratio of the mass of separated impurities to the total mass of impurities in a crop sample, cleaning efficiency is the effectiveness of threshing machine in separating chaff from grain kernels. According to Oduma et al. (2014) as:
where Wt is the total weight of mixture of grain and chaff received at grain outlet, and Wc is the weight of chaff at chaff outlet of the thresher (g).
Percentage loss (PL)
It is the ratio of quantity of seed loss to the total quantity of the millet panicle expressed as a percentage and is given by Gbabo et al. (2013) as:
where PL is the percentage loss (%), Mr is the mass of recovered seed (g) and Ml is the mass of seed losses (unthreshed loss + separation loss scattering + blower loss) (g).
Grain throughput capacity (T)
This is the capacity of the thresher in terms of the total quantity of threshed materials in sample per unit time. Grain throughput capacity was calculated as done by Amadu (2012) as:
where Q is the quantity of threshed grain collected after a threshing operation (kg) and t is the time taken for a complete threshing operation (h).
RESULTS AND DISCUSSION
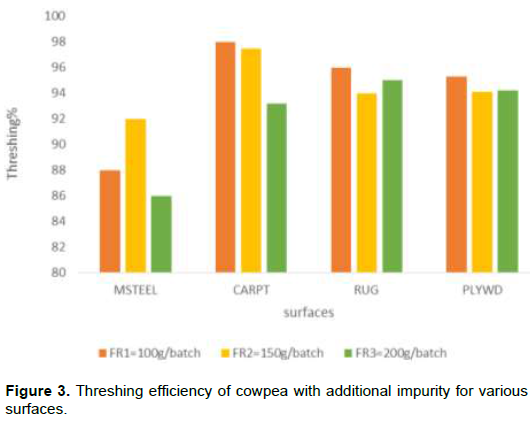
Threshing efficiency of the machine for cowpea samples
Threshing efficiency obtained for cowpea samples on various surfaces is as shown in Figure 3. Maximum TE values for MSTEEL, CARPT, RUG and PLYWD surfaces are: 92.62% at FR2 (150 g/batch), 97.44% at FR1 (100 g/batch), 95.33% at FR1 (100 g/batch) and 95.43% at FR1 (100 g/batch), respectively, this shows that the highest TE values are obtained at FR1 (100 g/batch) for all surfaces except MSTEEL. Furthermore, TE reduces with increase in feed rate. Also, irrespective of the feed-rates, all surfaces except MSTEEL had TE values of at least 95%. In comparison, Oriaku et al. (2014) reported 77.0 to 80.0% TE for maize as sample weight decreased from 8 to 2 kg (Olaoye, 2011) reported TE between 80.0 and 98.0% as threshing speed increased from 50 to 125 rpm (Olaoye, 2011). Oduma et al. (2014) reported that TE reduced from 100.0 to 98.0% as feed-rate increased from 1 to 4 kg/min. Thus the TE values reported for the modified thresher is comparable to those reported in literature. Osueke (2011) explains the increase in threshing loss with increase in feed rate by observing that:
Threshing efficiency = 1 – losses (5a)
Losses = 1 – Threshing efficiency (5b)
This equation implies that here is a biphasic nature between threshing efficiency and threshing loss; as feed-rate is increased, threshing efficiency reduces and losses increase. This is because when grains are fed into threshing machine at high feed rate, threshing energy applied to each grain is reduced; these cushions grains from the threshing impact, the unthreshed grains are added to impurity which reduces TE in Equation 1.
Cleaning efficiency of the machine for soybean samples
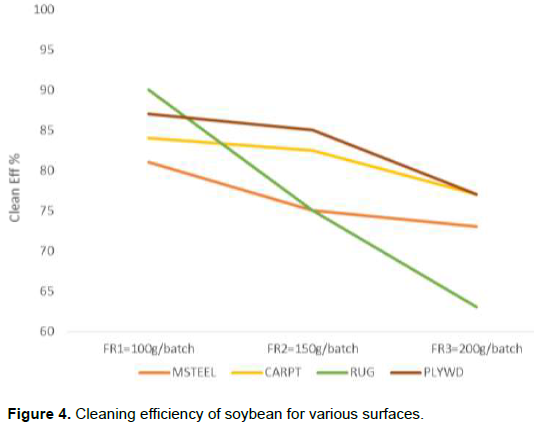
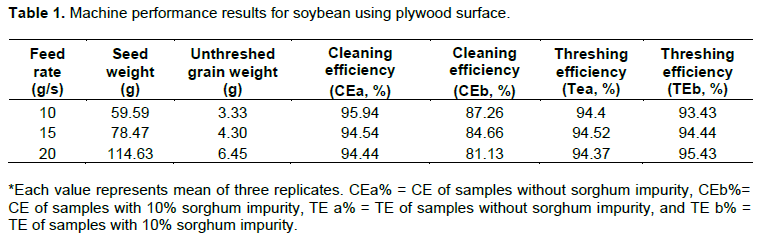
The cleaning efficiency of the threshing machine for soybean with various weight percentage of Sorghum crop added for the four surfaces is as shown in Figure 4. It shows that CE reduced for all the surfaces as feed-rate was increased from FR1 (100 g soybean + 10 g sorghum) to FR3 (200 g soybean + 20 g sorghum). Some values of CE obtained are 90% (RUG), 87% (PLYWD), 84% (CARPT) and 82% (MSTEEL) and were all obtained at FR1 (100 g soybean + 10 g sorghum). It can be inferred from Table 1 that mixing sorghum seeds with samples to increase sample impurity caused CE to reduce by 9 to 13% for PLYWD surface, while CE values were between 95.94% (FR1) and 94.44 (FR3) without sorghum addition. Furthermore, CE decreased for all surfaces as feed-rate was increased which is in line with the results of an earlier study by Gbabo et al. (2013), where increased material flow, feed rate and seed moisture content caused reduction in CE. The obtained values are lower than those reported by Rouzegar et al. (2013) 98.99 to 99.44%, but comparable to 82, 85 and 72% for sorghum, soybean and millet reported by Muhammad et al. (2013). Oriaku et al. (2014) reported CE values for maize as being higher than 68.1%, while Gbabo et al. (2013) reported between 56.3 and 62.7% CE for millet. CE decreased with increase in feed rate at the rate of 2.712, 1.116, 1.11 and 0.78 kg/s for rug, plywood, mild steel and carpet surfaces, respectively. Gbabo et al. (2013), explained that the reduction in CE with increasing feed rate is because at increased feed rates, constant high stripping and impacting forces applied to seed materials increase threshed material output and impurity which often times leads to clogging and reduced cleaning efficiency. Also, according to Simonyan and Yiljep (2008), the reduction of CE with feed rate may be due to increasing load intensity on the blower, the authors stated that multiple particles act as obstructions to airflow, increase number of particles and cause turbulence all of which reduces CE.
Cleaning efficiency of the machine for cowpea samples
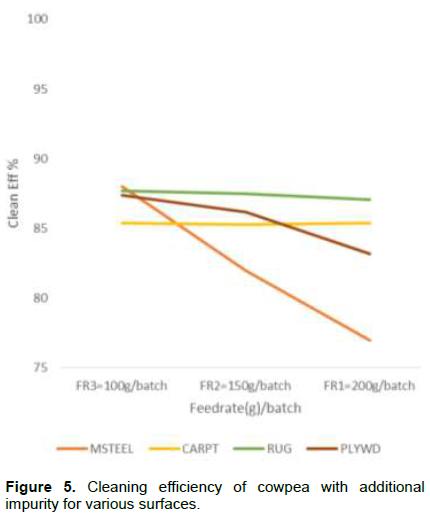
The cleaning efficiency of cowpea mixed with sorghum grains for various is presented in Figure 5. It shows that as feed-rate was increased from FR1 (100 g soybean + 10 g sorghum) to FR3 (200 g soybean + 20 g sorghum), the CE reduced for PLYWD and MSTEEL surfaces. Some of the values obtained for cleaning efficiencies are 88.2 (MSTEEL), 85.6 (CARPT), 87.1 (RUG) and 87.3% (PLYWD), respectively. At FR3 (200 g cowpea + 20 g sorghum), the corresponding CE reduced to 76.8 (MSTEEL), 85.1 (CARPT), 86.9 (RUG) and 81.1% (PLYWD), respectively. The graph lines for (CARPT) and (RUG) showed little variation as feed-rate was increased, this suggests that CE from the surfaces were independent of feed rate. Furthermore, the observed clustering at FR1 suggests that the utilization of COF using the inclined trough as an intermediate stage had more effect than the differences in separation ability of the various surfaces. Cleaning efficiency is in line with CE value of 83.55 to 100%, reported by Ilori et al. (2013) and CE 92.96 to 97.65% reported for pigeon pea (Oduma et al., 2014). Also, the results are lesser than with the CE of 97.44 and 98.18% reported by Ahmad et al. (2013). The CE decreased with increase in feed rate at the rate of 1.141, 0.613, 0.052 and 0.018 kg/s for MSTEEL, PLYWD, CARPT and RUG surfaces, respectively. This showed that MSTEEL has the highest response to change in feed rate, followed by PLYWD and CARPT and that RUG has the least decrease in rates. Regression modelling for cowpea grains showing the correlation between the different surfaces and feed-rate is:
CE (MS) = 0.585FR + 92.0
R2 = 0.92 (6a)
CE (RUG) =0.594FR + 87.1
R2 = 0.93 (6b)
C.E. (CARPT) =0.594FR + 87.1
R2= 0.93 (6c)
C.E. (PLYWD) = 0.589FR + 89.9
R2= 0.93 (6d)
This could be compared with 2.86% damage reported by Oforka (2004), at moisture content of 10%. Simonyan and Yiljep (2008) obtained cleaning loss values of 9.73 to 54% for sorghum at 6 to 12 sieve oscillations per second, while Osueke (2013) obtained grain loss values of 5 to 35% at 0.1 to 0.25 kg/s for a cereal thresher (Figure 6).
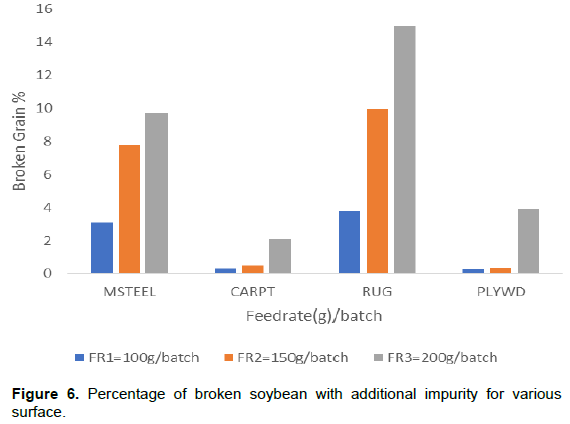
Considering a ceiling value of 3% separation losses as per ASABE Standards (1997), it is evident that at FR1, all surfaces had acceptable losses except RUG. At FR2 only CARPT and PLYWD surfaces had minimal losses. Also CARPT surface only had excessive losses except at FR3 where the losses were minimal. At FR2, MSTEEL loss was 7.7% and RUG 9.99%, also at FR3, mild steel loss was 9.57 and carpet surface loss was 14.9% (Chimchana et al., 2008). The percentage reduction in broken grains is due to the fact that increased crop material from samples with added impurity gave a cushion to the crops, thus minimizing the amount of energy impacted on the threshed material.
Machine grain output
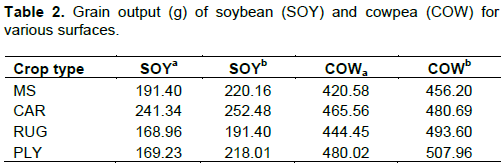
Table 2 shows grain output from which it is found that yields for cowpea were higher than the yield for soybean, this is because the percentage of grains in the cowpea panicle samples was approximately 54% which was higher than 24% for soybean. The total amount of cowpea ranged between 420.58 g for mild steel at FR1 and 480.02 g for plywood, at FR2 the lowest output was 456.20 g occurred for mild steel and the output was 507.96 g for plywood. Samples with impurity had higher amount of yield compared to samples without added impurity.
Statistical analysis and ANOVA results of the experiment
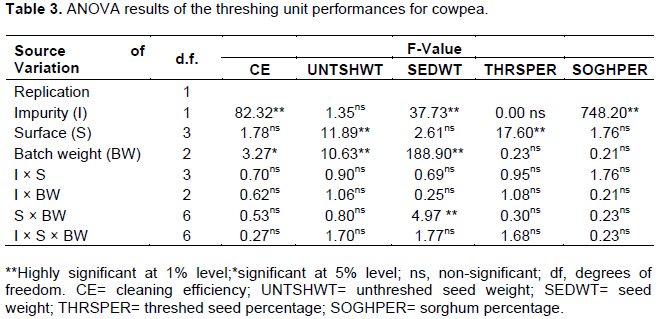
The analysis of variance (ANOVA) of the main effects for soybean is as shown in Table 3. Test results showed that the effect of impurity (I) and batch weight (BW) were the most significant at 1 and 5% for CE and collected seed weight. Among the first order interactions, surface and batch weight, impurity and batch weight showed high significance at 1 and 5% on broken weight and seed weight, respectively. Test results showed that only the main effects were significant. CE and seed weight impurity (I) was highly significant; surface was highly significant for TE and unthreshed weight while it is observable that batch weight (BW) was highly significant for collected seed weight and unthreshed weight.
CONCLUSIONS
Based on the performance evaluation of the modified thresher, the following conclusions were drawn from the results obtained earlier; the separation surfaces showed ability to maintain high cleaning efficiencies if the impurity consists of light weight chaff materials, but some moderate weight materials such as sticks, added sorghum and small stones remained in the collected crop samples. The sorghum samples in the collected crops increased as added sorghum increased from 10 to 20 g. Threshing efficiency of cowpea increases with increase in feed rate, attains a maximum of about 97% at FR2 before reducing at further increase of feed rate. Also, cleaning efficiency reduced significantly at 1 and 5% with increase in feed rate for all surfaces, from about 97 to 63.28% by the introduction of MOG; the effect of additional impurity clearly outweighed the increase in feed rate. Based on the foregoing, the following recommendations can be considered in future works.
(i) To separate impurities with similar weights as the grains, alternative methods of separation such as the use of screens can be considered.
(ii) Other factors such as blower speed, moisture content and different crop varieties can be considered in further performance evaluations.
CONFLICT OF INTERESTS
The authors have not declared any conflict of interests.
REFERENCES
|
Aderinlewo AA, Raji AO, Olayanju TMA (2011). Effect of variety and moisture content on aerodynamic properties of four Nigerian Cowpea (Vigna unguiculata) varieties. Journal of Nature, Science, Engineering and Technology 10(1):106-115. |
|
|
Ahmad SA, Iqbal M, Ahmad M, Tanvir A, Sial JK (2013). Redesigning and development of indigenous beater wheat thresher. Journal of Quality and Technology Management 9(1):69-98. |
|
|
Ajit SK, Goering CE, Rohrbach RP, Buckmaster DR (2006). In. Grain Harvesting. Engineering Principles of Agricultural Machines. St. Joseph Michigan pp. 403-436. |
|
|
Amadu N (2012). Development and Performance Evaluation of an Improved Soybean Thresher. Unpublished M.Sc Thesis Ahmadu Bello University, Zaria, Nigeria. |
|
|
ASABE (1997). ASAE Standards - 44th Edition (Standards Engineering Practices Data). The Society for Engineering in Agricultural, Food, and Biological Systems, USA. |
|
|
Awady MN, Sayed AS (1994). Separation of peanut seeds by airstream, Misr Journal of Agricultural Engineering 11(1):137-147. |
|
|
Chimchana D, Salokhe VM, Soni P (2008). Development of an Unequal Speed Coaxial Rotor Thresher for Rice. Agricultural Engineering International: The CIGR E-Journal 10(1):8-17. |
|
|
Dhananchezhiyan P, Parveen S, Ravindra N (2013). Study of mechanical properties of popular paddy varieties of Tamil Nadu relevant to development of mini paddy thresher. Current Agriculture Research Journal 1(1):59-64. |
|
|
El-Khateeb H, Sorour H, Saad MI (2008). Operating factors affecting using two different threshing machines for threshing sunflower heads. Proceedings of the 15th Annual Conference of the Misr Society of Agricultural Engineering 1:251-270. |
|
|
Faleye T, Atere OA, Oladipo ON, Agaja MO (2013). Determination of some physical and mechanical properties of some cowpea varieties. African Journal of Agricultural Research 8(49):6485-6487. |
|
|
Gbabo A, Gana IM. Amoto MS (2013). Design, fabrication and testing of a millet thresher. Net Journal of Agricultural Science 1(4):100-106. |
|
|
Hemmat A, Emamy M, Razavi SJ Masoumi AA (2007). Terminal velocity of chopped corn silage and its separate fractions as affected by moisture content. Journal of Agriculture, Science and Technology 9(1):15-23. |
|
|
Ige MT (1978). Threshing and separation performance of a locally built Cowpea thresher. Journal of Agricultural Engineering Research 23:45-51. |
|
|
Irtwange SV (2009). Design, fabrication and performance of a motorized cowpea thresher for Nigerian small-scale farmers. African Journal of Agricultural Research 4(12):1383-1391. |
|
|
Kamboj P, Singh A, Kumar M, Din S (2012). Design and development of small scale Pea depoding machine by using CAD software. Agricultural Engineering International: The CIGR E-Journal 14(2):40-48. |
|
|
Manuwa SI (2011). Properties of Soybean for best postharvest options. Soybean Physiology and Biochemistry. |
|
|
Muhammad US, Abubakar LG, Isiaka M, Davies RM (2013). Design and evaluation of a cleaning machine. Applied Science Reports 1(3):62-66. |
|
|
Oduma O, Nwakuba NR, Igboke ME (2014). Performance evaluation of a locally developed pigeon pea thresher. International Journal of Applied Science, Technology and Engineering Research 3(2):20-31. |
|
|
Oforka OM (2004). Improvement of IAR Soybean Thresher: Unpublished B. Engr. Thesis of Agricultural Engineering Department, A.B.U. Zaria. |
|
|
Olaoye JO (2011). Development of a treadle operated abrasive-cylinder for threshing cowpea. International Journal of Applied Science, Technology and Engineering Research 3(12):8548-8557. |
|
|
Oriaku EC, Agulanna CN, Nwannewuihe HU, Onwukwe MC, Adiele ID (2014). Design and performance evaluation of a corn de-cobbing and separating machine. American Journal of Engineering Research 3(6):127-136. |
|
|
Osueke CO (2011). Simulation and optimization modeling of performance of a cereal thresher. International Journal of Engineering and Technology 11(3):143-152. |
|
|
Osueke CO (2013). Study of the influence of crop, machine and operating parameters on performance of cereal threshers. International Journal of Engineering Research and Development 7(9):1-9. |
|
|
Owolarafe OK, Ogunsina BS, Gbadamosi AS, Fabunmi OO (2007). Application of coefficient of friction to the separation of cocoa husk-beans mixture. Journal of Food Process Engineering 30:584-592. |
|
|
Panasiewicz M, Sobczak P, Mazur J, Zawis'lak K, Andrejko D (2012). The technique and analysis of the process of separation and cleaning grain materials. Journal of Food Engineering 109(3):603-608. |
|
|
Polat R, Umran A, Saglam C (2006). Some physical and aerodynamic properties of soybean. Journal of Agronomy, 5(1):74-78. |
|
|
Rouzegar MR, Asli-Ardeh EA, Abbaspour-Gilandeh Y, Khalifeh AA (2013). Study effects of moisture content, feed rate and fan revolution on separation efficiency in a paddy laboratory winnower. International Journal of Agricultural Crop Science 5(21):2576-2578. |
|
|
Simonyan KJ Yiljep YD (2008). Investigating grain separation and cleaning efficiency distribution of a conventional stationary rasp-bar sorghum thresher. Agricultural Engineering International: The CIGR E-Journal 10(1):7-28. |
|
|
Vasundhara CH, Rajender G, Teja R, Mamatha P, Sunil K (2019). Development and evaluation of terminal velocity apparatus for sorghum grains. Journal of Pharmacognosy and Phytochemistry 8(3):1962-1968 |
|
|
Wang YJ, Chung DS, Spillman CK, Eckhoff SR, Rhee C, Converse HH (1994). Evaluation of laboratory grain cleaning and separating machine. Part I. Transactions of the American Society of Agricultural Engineering 37(2):507-513. |
|
Copyright © 2024 Author(s) retain the copyright of this article.
This article is published under the terms of the Creative Commons Attribution License 4.0


