ABSTRACT
It is essential that the net effect of biodiversity on crop yields is determined; particularly in developing nations, where both increasing food security and reducing biodiversity losses are of high importance. This study modelled the abundance of pests, pollinators and pest-control animals and determined their impact on crop yield within agroecosystems in four rural villages in Malawi. Data on the habitat area, survivorship, fecundity, birthing month and effect on crop yield for 14 animal functional groups were collated through a focused meta-analysis. Using this data, models were created to determine the abundance of each functional group using land cover as the sole input variable; with Participatory Rural Appraisals (PRA) utilised to validate the model prediction. Bees, birds and insects always improved crop yield, whereas monkeys, rodents and large herbivores always result in losses. Three out of four villages experienced a net benefit to crop yield from the animal biodiversity present. We conclude that models derived from meta-analyses appear useful for broadly predicting the local-scale abundance of functional groups and their qualitative impact on crop yield. However, long-term field observations should be conducted to ensure that the PRA values in this study correlate with direct observation.
Key words: Africa, Malawi, Zomba, agriculture, pest, pest control, pollination, pollinator.
Since the publication of the Millennium Ecosystem Assessment in 2005, ecosystem services (ES) have become an important topic in both policy and science (de Groot et al., 2009). Whilst policy is mainly concerned with provisioning services which contribute directly to livelihoods, such as food, water and timber, research has also focused on regulating and cultural services (Zhang et al., 2007). It is widely recognised that biodiversity underpins many ecosystem services (Mace et al., 2012) and thus is essential for human well-being. For example, biodiversity is vital in providing regulating services such as pollination and pest-control (Altieri, 1999; Cardinale et al., 2012) which are essential for food security (Ghazoul, 2005), particularly in developing countries which are typically biodiversity rich but technology poor. Pollinators, defined here as animals that transfer pollen between plants, are known to benefit agricultural through increasing crop yields, improving fruit and seed health and reducing crop deformities (Garibaldi et al., 2013; Ricketts et al., 2004). Awareness of the importance of pollination for food security has risen and features in the policies of numerous governments (Byrne and Fitzpatrick, 2009). However, ecosystems can also provide disservices (Dunn, 2010). In agroecosystems, a major ecosystem disservice is pests causing agricultural yield losses (Cardinale et al., 2012). The term ‘pest’ is limited in this investigation to cover animals that consume crops from the field to market or consumption, and does not extend to bacteria or parasites (Oerke, 2006). Both vertebrate and invertebrate pests result in 14% of agricultural losses annually (Cerkal et al., 2009), having high economic losses and impacting food security (Oerke, 2006). Pest-control, defined here as the natural enemies of pests (so does not include use of agrochemicals), has received less attention within the ES literature (Chaplin-Kramer et al., 2011). Pest-control is becoming increasingly studied in agricultural systems to reduce pesticide use (Chaplin-Kramer et al., 2011; Mahr et al., 2001). However, pets-control studies typically focus on the use of exotic species, often to control invasive species rather than on the value of indigenous biodiversity tosupport crop production.
Whilst the interaction between pests and pest-control and has been studied (Chaplin-Kramer et al., 2011), the interaction between pests, pollinators and pest-control needs to be evaluated to establish the overall impact of ecosystem services provided by wildlife on agricultural systems, (Lundin et al., 2013). Currently, there is only one paper within the literature that focuses on this three way interaction and its impact on yield – the interaction of three species; bumblebees, Apion weevils and parasitic wasps, conducted in laboratory conditions (Lundin et al., 2013). However, we have been unable to find a study that has investigated the interaction between pests, pollinators and pest-control in the field, nor linked such interactions to crop yields.
Where there is limited time and/or funds for field observations, existing literature values can be analysed through a meta-analysis (Bengtsson et al., 2005; Jonsen et al., 2003). These values, along with land-cover maps, can be used to predict animals present within a landscape and estimate their abundance. However, it is vital to validate these relatively simple, lookup table-based models to ensure they are accurate. Model validation can prove difficult in data-deficient regions, such as sub-Saharan Africa (Rodger et al., 2004), but it is such regions that are generally the most food insecure and thus show the greatest need for models that may help to increase crop yields (Rodger et al., 2004). Direct observation can only provide evidence of animal abundances for the period of fieldwork, which may be limited in many developing nations due to time and costs limitations and thus would give a very unreliable estimate of annual abundance and little indication of seasonal or annual fluctuations. Participatory Rural Appraisal (PRA) can be used to rapidly ascertain biodiversity within rural landscapes by using local knowledge (Hellier et al., 1999) and can contribute to wider understanding of ecosystems services in developing countries. Thus, enabling rural communities to provide abundance estimates via PRAs, a method frequently used in agroecosystem analysis, can fill the data void and be utilised to validate a model produced via a meta-analysis (Chambers, 1994).
Here, we produce a model though a meta-analysis that predicts the abundance of animal species within four villages in Malawi, sub-Saharan Africa. We then use this model to predict the net crop yield benefits or losses that the villages incur from the amounts of the pests, pollinators and pest-control present. We then validate the models using PRAs conducted in the same four villages. To the best of our knowledge, ours is the first study combining models of the effect of pests, pollinators and pest-control on crop yield within sub-Saharan Africa, one of the worlds poorest and more food insecure regions.
Model creation
Meta-analysis
Articles in peer-reviewed journals, books, organisational reports and governmental reports (identified using Google scholar, Jstor and Web of Knowledge and specific search terms (Appendix 1, Table 1)) were utilised to compile data on the area required for each animal functional groups (FG) to live in (habitat area), the chance of an individual surviving a month (survivorship), the number of offspring an individual produces annually (fecundity), the time of year the individual gives birth (birthing month) and the effect on crop yield, recorded as a percentage increase/decrease. FGs were chosen because the literature did not contain adequate species-specific data. After consultation with local experts in Malawi, ten FGs were selected: amphibians, bees, birds, other flying insects, ground insects, rodents, large herbivores, bats, monkeys, and reptiles. These models were further divided into their respective ecosystem service and disservice functional role: pollinator, pest, and pest-control. For example, the ‘other flying insects’ FG contained families such as grasshoppers that only act as pests; however, ants act as a pests, pest-control agents and pollinators. Consequently, the characteristics of the ‘other flying insects’ pest FG differed from that of pollinator and pest-control. This further subdivision resulted in 14 FGs (Figure legend of Figure 1 and Appendix 1). The values collated from the literature were used to calculate the mean and 95% confidence intervals for the area required for each land-cover the FG lives requires (habitat area), fecundity, survivorship and effect on crop yield for each FG. In some instances, habitat area of a FG for a specific land-cover could not be obtained. When this arose, the mean habitat area required was applied to all land-covers that the FG was documented within the literature as occupying.
Application of meta-analysis to predicting animal abundances at the village scale in Malawi
We used the values from the literature to predict abundance at the scale of the village for four Malawian villages, three in the Zomba District and one in Machinga District. The villages utilised were selected by ESPA-ASSETS (http://espa-assets.org) and fall on a transect between Zomba Plateau and Lake Chilwa.
Land-cover for each village was derived from two land-cover maps, a standardised African land-cover map (Roger et al., 2013) and Globcover2009 (European Space Agency, 2011). As the model abundance predictions were not sensitive to the land-cover map used (Appendix 2), results in this paper will be presented for the Globcover2000 map only as this map was deemed the most accurate following on-the-ground validation.
Predicting animal abundances
R v.3.0.1 was then used to build the models (R Development Core Team, 2010). Abundances were predicted using land-cover as the solitary input. The starting numbers and the carrying capacity were determined by dividing the available habitat by the area required for each FG. The model ran using monthly time-steps. Each month the FG populations would decline due to death, with the probability of survival matching the value determined by the meta-analysis. Due to a lack of data concerning when species are most likely to die in the year, death was assumed to act linearly throughout the year. Populations also increased in monthly increments due to fecundity. However, this did not occur linearly as there was sufficient literature on birthing months. Thus, the annual fecundity was split into monthly values, weighted by the proportion each month was identified within the literature as being a birthing month. Furthermore, births only arose if the FGs population did not exceed the carrying capacity, also determined from the meta-analysis. Consequently, seasonal variation is modelled through variation in fecundity and not survivorship.
In total, three models were built for each FG: one parameterised by using the means from the meta-analysis and two parameterised using the upper and lower confidence intervals respectively. Each model was run for all four villages. The models were run between 1977 and 2013, but a pre-run period from 1800 was allowed to ensure that the models had stabilised by the time period of interest.
Model validation
Participatory rural appraisals (PRA)
The PRA for this study were conducted with a spread of ages, socioeconomic status and geographic spread throughout the village (for a complete version of the PRA questionnaire see Appendix 1). PRA groups were separated by gender to ensure that socioeconomic biases and traditions did not affect participation and so all members felt they could participate freely. At each village, two male and two female PRA were conducted. The PRA were conducted in the local language spoken by the participants (a mixture of Chichewa and Yao) using images of example species for each FG type (Appendix 1). Primarily, data were collected on how many individuals they saw within each FG in the village. Present day numbers were reported as well as recall of 10 years ago, 20 years ago and 30 years ago. Where village-wide estimates were not practicable, individuals were asked how many they would see in a unit of known area or time that they felt able to comprehend, e.g. a field/house or observations per day. For the purpose of the PRA, FGs were further subdivided (Appendix 1) to make numbers easier to report as more specific groups were discussed at a time. For example, large herbivores were split into small antelope, large antelope, elephant and hippopotamus. In total, 28 groups were used in the PRA (Appendix 1). Additional information such as the land-cover in which the FG resides, its benefits and disadvantages and how the FG is controlled were also recorded (Appendix 1).
Data preparation and analysis
The PRA participants typically reported animal abundances in four ways: 1) the number of individuals throughout the whole village; 2) the number of individuals in a house; 3) the number of individuals in a field; and 4) the number of individuals seen in a day. Thus, before comparing the PRA values to the models, all PRA estimates needed to be post-processed, scaling all estimates up to the village area. For numbers reported per house, the count given was multiplied by the number of households for the respective village as it was assumed that the FG was present in all houses. The household values were taken from the Malawi Spatial Data Portal (MASDAP, 2013). Specific data was not available for the number of fields in each of the four villages. Consequently, the average field size for the respective districts of the villages were taken from the Malawian National Census of Agriculture and Livestock 2006/2007 Main Report, 0.264 ha and 0.309 for the Zomba and Machinga districts respectively (National Statistical Office, 2010). The area of cropland within each village was determined using the Globcover2000 land-cover map and divided by the mean field size of the appropriate district to give the number of fields within the village. This number was then multiplied by the count of individuals observed to give the village total. Finally, for some estimates, participants could only report the number of individuals they see in a day. This temporal estimate was converted to a unit area using the following method. The average sub-Saharan African villager walks 5 km a day (Schafer, 2000), combining this value with the assumption that an individual can see 10m either side of themselves means a villager observes an area of 0.1 km2 a day. It was considered unlikely that villagers would be able to travel freely over large water bodies and thus water bodies were deducted from total village area before the abundance estimate provided for 0.1 km2 could then be scaled up to the village area.
The more specific functional groups for the PRA exercises were then regrouped according to the meta-analysis FG (Appendix 1). These PRA estimates were analysed to give the mean and 95% confidence intervals of FG populations in each village.
Calculating the net effect of FGs on crop yield
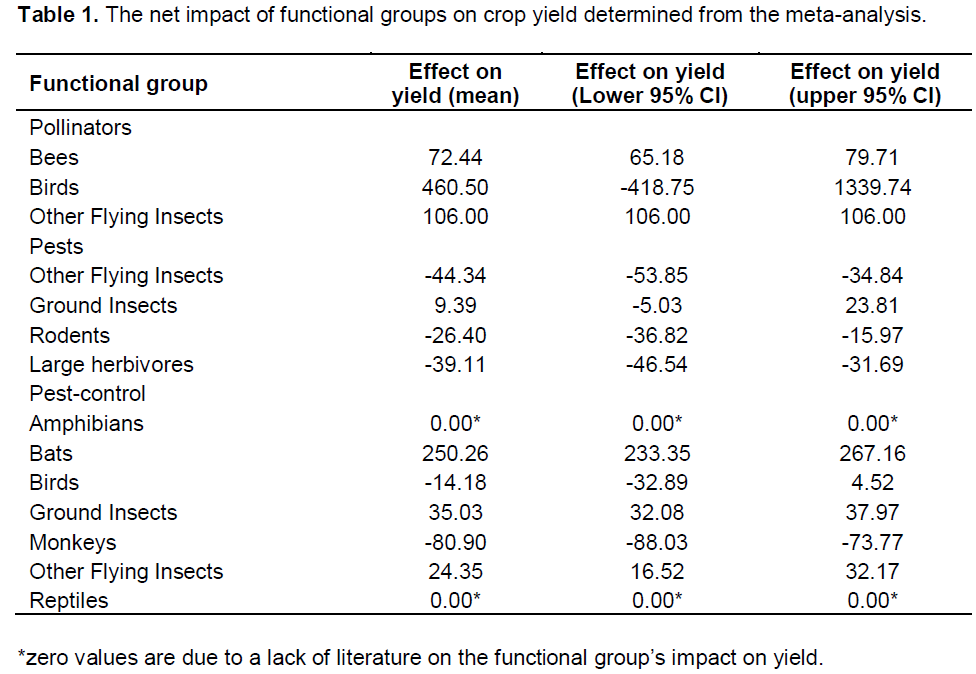
The impact of FGs on crop yield was also estimated through the meta-analysis. In most instances, the direct effect on yield was available for the pest and pollinator FGs. However, data on the effect of pest-control FG on crop yield were sparse. Consequently, to determine the impact of many pest-control FGs, the impact of pest-control presence on pest abundance was estimated from the literature and the reduction of crop damage that arose from this was attributed to the pest-control FG. Thus, a lookup table of impact on crop yield was produced, using R v.3.0.1, with the mean and 95% confidence intervals impact on crop yield for each FG (R Development Core Team, 2010).
The net impact of the FGs on crop yield in each village was determined by combining a presence/absence rule with the newly created look-up table. Therefore, if a FG was indicated as present, then its associated impact on crop yield would be summed to that of all other FGs present to obtain the net impact of biodiversity on the crop yield at a village scale. Presence or absence was used rather than multiplying by the number of individuals present due to data deficiency on the impact of individual animals on crop yields. This procedure was repeated for the upper and lower confidence intervals to determine the likely yield impact a village may experience from the FGs present.
Animal abundance
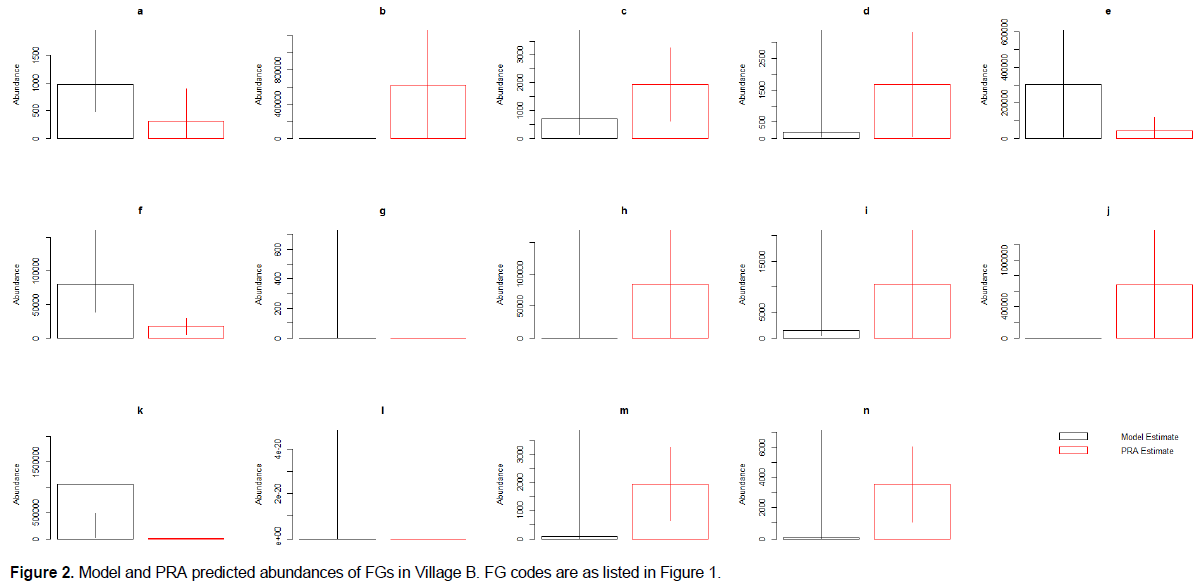
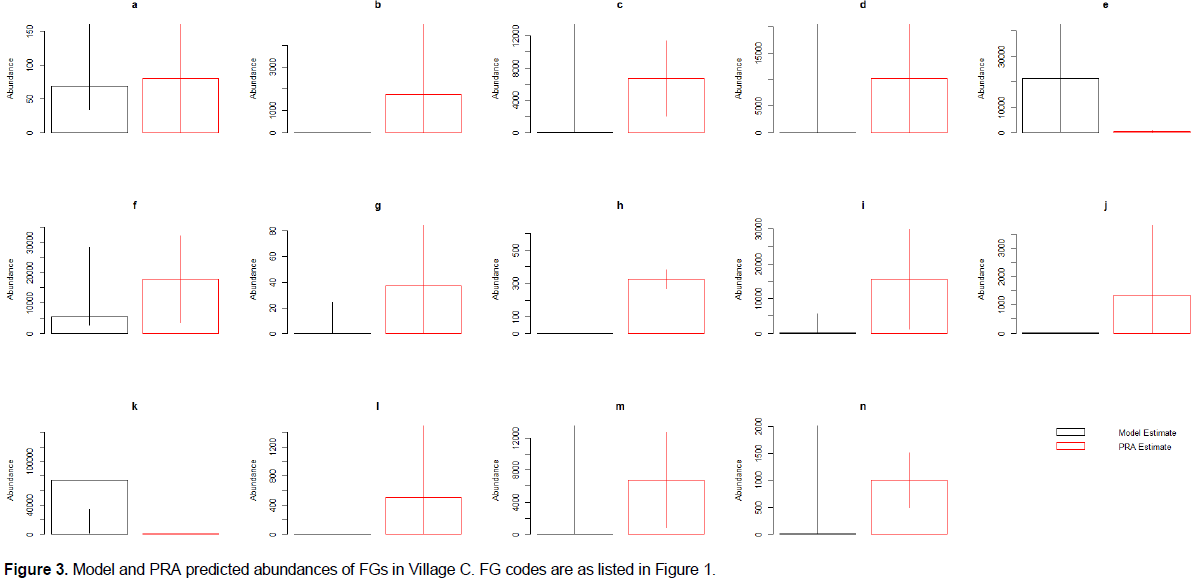
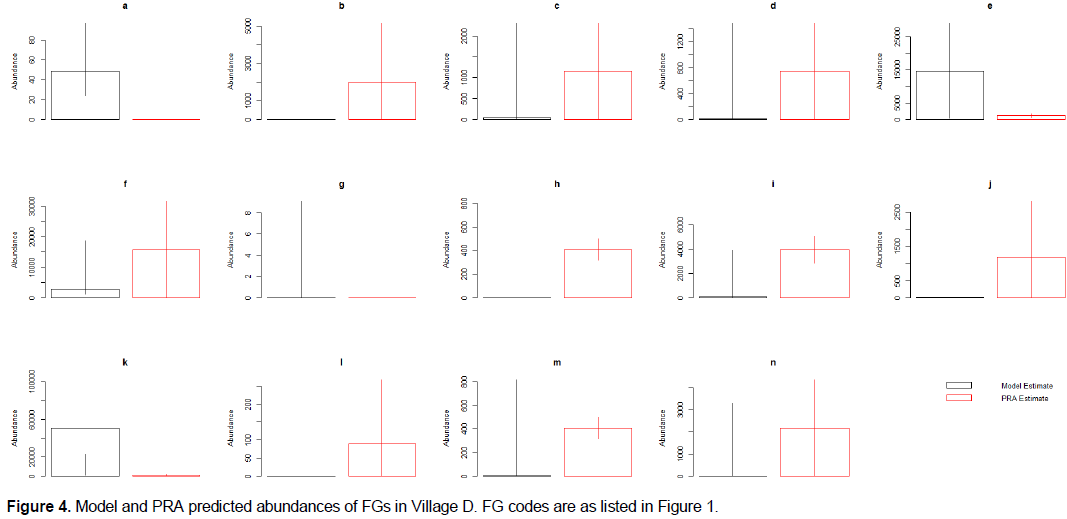
PRA values fell within the confidence intervals for 71.4 to 85.7% of the FG abundances predicted by the models (85.7, 78.6, 71.4 and 78.6% for village A, B, C and D respectively). Thus, the models predict perceived animal abundance across the region surveyed relatively well.
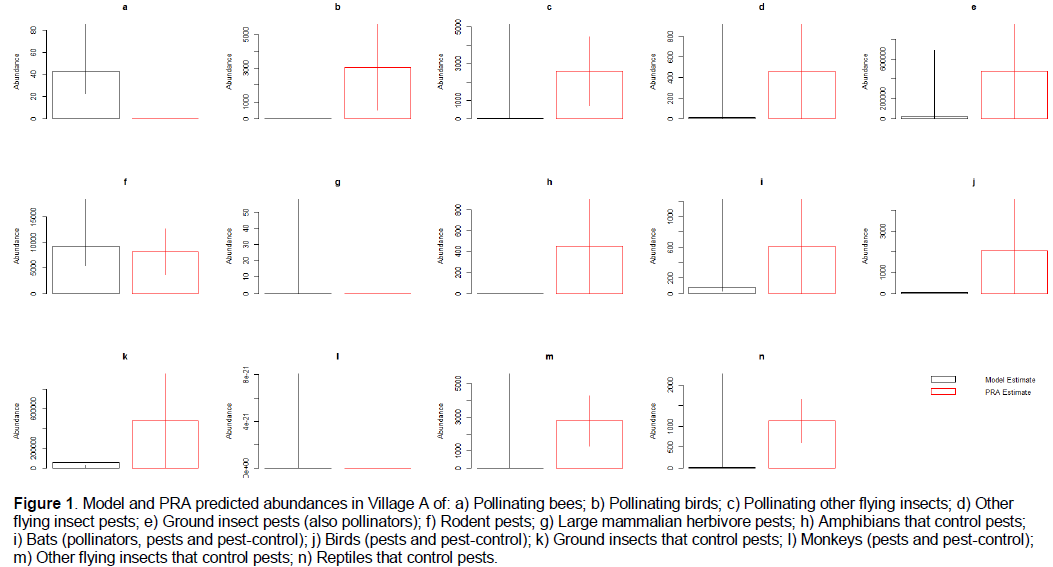
Specifically, abundance values from the PRA exercise consistently fell within the confidence intervals of the models produced by the meta-analysis when predicting the abundance of insects (pollinating other flying insects, other flying insects that act as pests, pollinating and pest ground insects and, pest-control other flying insects; a, d,e and m respectively of Figures 1 to 4), as well as for birds that act as pests and pest-control, monkeys and reptiles (j, l, and n of Figures 1 to 4) across all four villages. The mean PRA abundance values for all other flying insects categories, as well as pest and pest-control birds and reptiles were higher than the model mean for all four villages (c, d, e, j, and n of Figures 1 to 4). For monkeys, the PRA and model mean are the same for villages A and B (mean = 0). However, for villages C and D the PRAs had higher abundance means than the model (0 vs. 508 and 0 vs. 90 respectively). Conversely, ground insects that act as both pollinators and pests had lower abundances reported in the PRAs than the models predicted in villages B, C and D. Village A PRAs reported higher mean abundances of ground insects that act as both pollinators and pests (m of Figures 1 to 4).
Other model results showed less consistency across villages. Models for four other FGs predicted values that the PRA confidence intervals fell within for three out of four villages (pollinating birds, rodents, large herbivores and, bats (b, f, g, and i of Figures 1 to 4 respectively)). The PRA abundances for Village A were higher than those predicted by the model for pollinating birds (3045 ± 2,558 and 0 individuals respectively (b of Figures 1 to 4)). The PRA abundances were also higher than the model predictions for bats (15,540 ± 14,282 and 36-5,689 individuals respectively) and large herbivores (0-84 and 0 individuals) in village C. In village B, reported PRA abundances for rodents were lower than the values predicted by the model (17,581 ± 11,767 and 38,289-405,588 individuals respectively). Furthermore, the models predicted a greater abundance of bees and pest-control ground insects compared to the values given in the PRA exercises (a and k of Figures 1 to 4) across three out of four villages. For Village A, the PRA value for pest-control ground insects is higher than the value predicted by the model (0-1,406,345 and 1,212-55,112 individuals respectively. The model predicted bee abundance in village C close to the values reported in the PRAs (34-5,362 and 0-217 with mean of 68 and 80 individuals respectively). Finally, in villages C and D the model predicted that there were no amphibians present. However, the mean PRA values for amphibians were 325 and 406 individuals, respectively for these villages and the lower confidence intervals are both above 250 individuals. The mean PRA abundances for villages A and B were higher than the model mean (450 and 84,205 respectively compared to 0). However, the lower confidence interval for the PRA values was 0 for both villages. Consequently, the model prediction fell within the PRA confidence intervals for villages A and B.
Whilst the estimated animal abundance derived from the models was mostly accurate, the variation in this abundance throughout the year (i.e. between seasons) did not match that reported in the PRA exercise (Appendix 2). Furthermore, change through time predicted by the model was not representative of the values given in the PRAs (Appendix 2).
Effect on yield
Functional groups
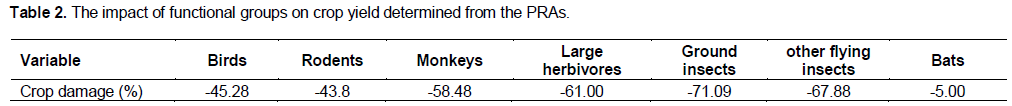
Overall, the net effect of bees, bats, other flying insects and ground insects on crop yield were significantly positive once all ecosystem services (pollination and pest-control) and disservices (pests) were taken into account (Table 1). Conversely, the net effect of rodents, large herbivores and monkeys on crop yield were significantly negative (Table 1). Finally, the confidence intervals for pollinating, pest and pest-control birds overlapped zero and so it cannot be determined from this study whether birds increase or reduce yield (Table 1). Participants did not perceive and/or could not report any yield increases caused by FGs. However, the perceived damage was often greater than the values reported from the meta-analysis, with the exception of monkeys, which was lower (Table 2).
The cumulative effect of FG on crop yield
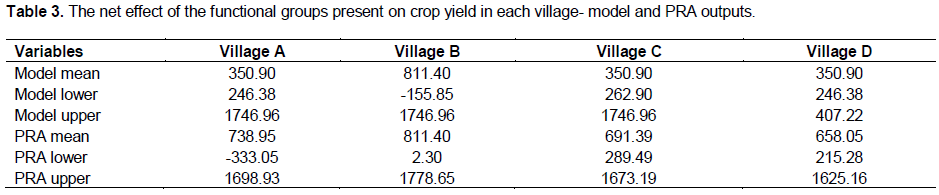
Overall, both the models and the PRAs suggest that the net effect of animal biodiversity in villages C and D resulted in a net benefit to crop yield overall for both the model and PRA values (Table 3). The confidence intervals for village B cross zero for the values obtained by the model. Consequently, the model is unable to predict whether the village experiences an increase or reduction in crop yield due to the interaction of the FGs present. This is contrast to the PRA, which indicates that the FGs present in village B have a positive impact on crop yield. Similarly, the model and PRA estimates are not in agreement for village A. The model predicts that village A experiences a net increase in crop yield, however, the PRA confidence intervals overlap zero and therefore suggest that it cannot be determined whether or not there is a gain or reduction in yield due to the interaction of the FGs present.
The net impact of biodiversity on crop yield
Our results: The first to quantify the cumulative effects of pests, pollinators and pest control agents in a natural system indicate that the net effect of animal biodiversity present within in rural southern Malawi is beneficial to crop yield. This is because although pests can result in large losses in yields, such losses are more than offset by the positive effects of pest-control and pollinator FGs. Our result support the laboratory-based findings, which show that interactions between pollination and pest-control is beneficial to crop health (Lundin et al., 2013), whilst those between pest and pest-control can increase yields (Chaplin-Kramer et al., 2011).
While not based on primary field data, subsets of our meta-analysis and PRA-based analysis also correspond to field-based studies, increasing our confidence in our results. For example, our study, like numerous others, shows that bees were always beneficial to crop yield (Hoehn et al., 2008; Ricketts et al., 2004). Additionally, in agreement with previous studies, our results show that rodents (Oerke, 2006; Sánchez-Cordero and Martínez-Meyer, 2000; Stenseth et al., 2003) and monkeys (Wallace and Hill, 2012) result in crop yield losses. Our study also found that ground insects and other flying insects had a net benefit for crop yield. Whilst it is well-recognised that many species within this FG such as wasps, flies, ants and beetles act as pest-control (Lundin et al., 2013; Mahr et al., 2001; Way and Khoo, 1992), the literature has traditionally focused on the crop yield loses that result from the damage these FGs cause (Adams et al., 1983; Motzke et al., 2013; Oerke, 2006; Wood et al., 1980). However, conflicting studies have found that other types of ants, beetles, flies and wasps, are beneficial to crop yield (Garibaldi et al., 2011; Garibaldi et al., 2013; Lundin et al., 2013).
Our meta-analysis revealed important limitations and biases within the literature on pests, pollinators and pest-control agents. Firstly, much of the literature surrounding the yield impacts of biodiversity focuses on qualitative changes as opposed to quantitative measures and so could not be included in the meta-analysis. Whilst numerous studies state whether a FG caused a reduction or an increase in yield, few put a definitive value on the impact (Garibaldi et al., 2013; Reitz, 2009). Secondly, there is a bias within the scientific literature towards crop losses caused by FGs (21 references giving 122 values) but those that benefit crop yield are more rarely quantified (8 references for both pollination and pest-control, giving 14 values and 32 values respectively). Furthermore, the studies that quantified beneficial impacts on agriculture often did not directly investigate this. For example, only two of the 32 pest-control values, one for birds and one for bats, were directly reported as the impact of pest-control on yield (Kalka et al., 2008). The remaining values had to be indirectly inferred, for example by calculating the crop damage reduction resulting from the consumption of pests. Within the pollination literature there is a distinct bias towards the impact of bees, with many other functional groups only discussed by a single reference, despite the fact that other species are as beneficial to pollination as bees (Garibaldi et al., 2013).
Interestingly, the biases of the local communities in their perception of the impact of animal biodiversity reflect the skewed research focus on crop loses. Overall, perceptions of impact were largely negative with only a small number of positive impacts perceived. When PRA participants were prompted about benefits such as pollination they frequently possessed no knowledge of the process. Within each village, there would typically be one or two young male participants that knew of the term pollination but, when asked of its impacts, they did not think it changed yields but that it created hybrid varieties. In addition, participants infrequently recognised that some FGs acted as pest-control. Participants rarely knew what animals preyed upon and, if they did, it would be because the prey had a direct effect on their wellbeing (such as lizards and bats eating mosquitoes, which directly cause malaria) rather than an indirect effect (e.g. agricultural pest-control reducing pest numbers which in turn increases yield and increases wellbeing). The lack of pollination and pest-control observations by participants may be due to these services being too subtle for participants to observe and, even when observed, too difficult to quantify and thus appreciate. The inability to perceive these subtle relationships led to some substantial differences between the perceived impacts and those known to science (Hellier et al., 1999). For example, some participants thought that ladybirds gave birth to aphids thus, they assisted in causing crop damage rather than recognising that ladybirds were found with aphids as they consume them (Snyder et al., 2004).
In addition to services not being observed, disservices were overestimated by participants. This finding is in agreement with previous studies which also found that participants perceived greater yield losses than actually occurred (de Mey et al., 2012). However, in some instances, participants overlooked negative effects. For example, some participants did not view fruit being eaten by bats as an issue as the bats primarily fed on the over-ripe bananas that they did not intend to sell. Participants also perceived monkeys as less damaging than the model predicted. However, this is due to the meta-analysis value being for baboons when the majority of monkeys present within the villages were smaller monkey species. Thus, participants did not necessarily perceive less damage than the model. The values were simply less comparable than other FGs.
An important limitation of this study is that it only encompasses the net impact of animal biodiversity on crop yield and not the overall net effect of all ecosystem services and disservices provided by animal biodiversity. This is because we assumed that the most important ES impact of biodiversity in these agriculture-dominated villages with major food security issues would be on crop yield. Intriguingly, qualitative observations we made while conducting the PRA suggest that this may not be the case, and that the most important ES impact of some FGs is on cultural and not provisioning services. For example, participants often did not perceive groups such as snakes, which provide pest-control services, as beneficial. Despite knowing that snakes consume rodents (which cause large crop losses), participants frequently stated that they would rather kill a snake than allow it to survive, as some snakes have the potential to kill people. A similar situation arose with bees. Participants would frequently report killing bees, despite the fact they provide honey and pollination services, because they can be a danger to people. However, as previously discussed, participants may be more inclined to arrive at this decision as they often did not perceive the pollination benefits of bees. Conversely, FGs that resulted in large losses such as monkeys and birds frequently had positive cultural services, such as providing entertainment, keeping people happy and being aesthetically pleasing. Previous studies have found that participants usually value provisioning services more highly than cultural services (Pereira et al., 2005), but it is evident from this study that cultural services can have a large impact of the tolerance communities may show to some pest species, even within subsistence agriculture dominated rural communities.
Using land-cover to predicting animal abundance
Previous studies have shown that meta-analyses can be used to predict animal abundances within conventional and organic agriculture (Jonsen et al., 2003). However, thus far, studies have focused on invertebrate abundances (Bengtsson et al., 2005; Jonsen et al., 2003; Langellotto and Denno, 2004). To the best of our knowledge, this is the first study to show suggest that a meta-analysis could be utilised to predict the presence and abundance of both vertebrate and invertebrate FGs in agroecosystems in Malawi. The models were most capable of predicting the abundance of pollinating, pest and pest-control other flying insects, pollinating and pest ground insects, pest and pest-control birds, monkeys, and reptiles. This can be partially attributed to wide confidence intervals of both the model and PRA.
This study showed that the models were generally not sensitive to the land-cover map utilised (Appendix 2). This is because the FGs within this study can be considered as predominantly generalists, occupying multiple land-covers. Thus, if one map labelled a particular area as woodland and another map identified it as forest, the FG abundance estimate could be unaffected if the group was equally likely to reside within both of these land-covers. This is important for future models as the models could be run in many locations, using many land-cover maps and still have comparable results. However, it is important to note that whilst the results from differing land-cover maps were similar for generalists, the resolution of the land-cover map had a substantial impact on the abundance predicted for specialised FGs. For example, the inability of the model to predict amphibians in villages C and D is due to the land-cover maps not containing water within these villages. However, the participants would frequently report frogs in the villages, as they would come from nearby rivers, which were too small to be observed on the land-cover maps.
Whilst the models predict annual animal abundance well, they were unable to capture the seasonal fluctuations that the participants perceived. For example, the meta-analysis suggests that the abundance of bees should fluctuate across the seasons, whereas the villages suggested that these populations were consistent all year round. This is perhaps because, due to data limitations, many studies included in the meta-analysis that addressed seasonal variation were from regions distant to the study site and thus derived from different seasonal regimes (Appendix 2). FGs that had African specific data matched perceived fluctuations the closest (e.g. birds; Appendix 2). This suggests that the models could be improved by obtaining Malawi specific birthing months, perhaps using local expert opinion as published data is lacking.
Previous work has argued that PRAs can be utilised to determine biodiversity within agricultural (Pereira et al., 2005) and tropical (Hellier et al., 1999) ecosystems. However, in accordance with this study, wide variations within the values obtained via PRAs have previously been reported (Pereira et al., 2005). Furthermore, PRAs are only able to provide estimates of perceived abundances and impacts. These perceived effects might not correlate highly with actual abundances or impacts. In fact, PRAs have been noted as providing over-estimates (de Mey et al., 2012). Providing over estimation is recognised and accounted for, PRAs may be utilised to collect historical data where records are not available and seasonal data where time is limited.
Study limitations
The main limitation of this study was data deficiency. Model validation through field observations was not possible as observations would have to be conducted over a several years in order to obtain seasonal values as well as capturing yield variations. Consequently, PRAs were utilised as a rapid method to validate the models. Furthermore, there were data limitations within the scientific literature, which was depauperate of some values and thus unable to support more complex models. The meta-analysis and subsequent estimates could be further improved if this data were available. Additionally, it is recognised that there are relatively few studies from the direct study area, or even from Malawi as a whole. Future studies could use weighted means, giving more influence to values geographically nearer to the study area (Willcock et al., 2014; Willcock et al., 2012).
Validating the models using PRAs has limitations. As aforementioned, PRA participants often overestimate numbers (de Mey et al., 2012). Furthermore, perceived abundance estimates varied considerably for some FGs within a village (e.g. bats could range from 0 to 25,496) resulting in wide confidence intervals (Pereira et al., 2005). However, this uncertainty may have been due to the methods utilised to extrapolate some values to village level. For example, bats were reported as the number of individuals seen in a house thus this was multiplied by the number of houses within the respective village. It is highly likely that this resulted in an over estimate as bats were reported as preferentially occupying houses with tinned roofs. As the proportion of thatched roofed homes within a village was unknown, reported values were multiplied by all the houses in the village. Village A, which had the closest PRA and model means for bats, reported values as the amount seen in fields and so did not suffer from this bias. However, for this observation (and others like it), the number of fields in the village was calculated by dividing the area of cropland identified on the land-cover map by the average field size for the region, as reported by the National Statistics Office (2010). In truth, the average field size may have varied significantly between villages (National Statistics Office, 2010). Furthermore, when numbers within a unit area could not be provided, participants would state the number of individuals within a FG that they saw per unit time. Whilst this was converted to an area using the average distance travelled per day (see methods for full details), it was assumed that participants did not observe the same animal individual in multiple places. Furthermore, it was assumed that, within 10 m of the villager, all FGs are equally detectable. This is not the case, e.g. an antelope is obviously much more detectable than a beetle. The PRA values for ground pest and pest-control insects evidences this as they were often under predicted compared to the model mean as they are hard to observe. For example, thrips were frequently reported as not being present, despite casual observation by the authors. On one occasion, a thrip was pointed out to the participants who had recently denied the presence of thrips, causing them to remark that thrips which was too small for the participants to take note of.
The broadness of FGs whilst conducting the PRAs also led to limitations. Participants were asked about small birds but pollinating birds were not separated from this group, as speaking about separate species compromised discussing broader FGs. Thus, model values for pollinating birds have been validated against perceived abundance of small birds and so should be expected to be lower than the PRA estimates. In some instances, numbers were not obtained at all for FGs, especially birds, rodents and insects as participants felt that they were “uncountable”. To overcome this, fieldwork should be conducted to obtain abundances of species that participants perceive as “uncountable”.
The models also have wide confidence intervals. This is due to the variation of species and families within each of the FGs. This variation resulted in a wide range of values recorded for habitat area within the model. For example, ants [Formicidae] in pollinating and pest-control insects ranged from requiring 3.33e-6 km2 (Traniello, 1989) and 0.12 km2 (Hölldobler, 1976). Previous models predicting insect abundance have narrower confidence intervals (Bengtsson et al., 2005; Jonsen et al., 2003). However, these models require more data inputs and so are perhaps less feasible in data-deficient regions such as Malawi. This study solely utilises land-cover to estimate animal abundance and other studies using a similar approach also report wide confidence intervals (Bender et al., 1998).
Overall, our results suggest that animal biodiversity with rural villages in Malawi results in an overall benefit to crop yields as the ecosystem services of pollination and pest-control outweigh the disservice of pests. Our work also highlights several biases within the literature, resulting in data-deficiencies when describing the quantitative impact of pollinators and pest-control on crop yield. This bias is shared by participants, as PRA participants often did not perceive pollination or pest-control services, focusing instead on the ecosystem disservice provided by pests. Finally, preliminary evidence indicating that participants prioritise some cultural values and other wellbeing increases over increases in crop yield is provided, indicating that commonly held assumptions about provisioning services being more important than cultural services may need re-examination.
The authors have not declared any conflict of interest.
This work took place under the ‘Attaining Sustainable Services from Ecosystems using Trade-off Scenarios’ project (ASSETS; http://espa-assets.org/; NE- J002267-1), funded with support from the United Kingdom’s Ecosystem Services for Poverty Alleviation program (ESPA; www.espa.ac.uk). ESPA receives its funding from the Department for International Development (DFID), the Economic and Social Research Council (ESRC) and the Natural Environment Research Council (NERC). We would also like to acknowledge the University of Southampton’s Faculty of Engineering and the Environment, who co-funded this study.
REFERENCES
Adams CT, Banks WA, Lofgren CS, Smittle BJ, Harlan DP (1983). Impact of the Red Imported Fire Ant, (Hymenoptera:Formicidae), on the Growth and Yield of Soybeans. J. Econ. Entomol. 76(5):1129-1132.
Crossref |
|
|
Altieri MA (1999). The ecological role of biodiversity in agroecosystems. Agric. Ecosyst. Environ. 74(1-3):19 - 31.
Crossref |
|
|
Bender DJ, Contreras TA, Fahrig L (1998). Habitat Loss and Population Decline: A meta-analysis of the patch size effect. Ecol. 79(2):517-533.
Crossref |
|
|
Bengtsson J, Ahnstrom J, Weibull AC (2005). The effects of organic agriculture on biodiversity and abundance: a meta-analysis. Ecol. 42:261-269.
Crossref |
|
|
Byrne A, Fitzpatrick Ú (2009). Bee conservation policy at the global, regional and national levels. Apidologie 40(3):194-210.
Crossref |
|
|
Cardinale BJ, Duffy JE, Gonzalez A, Hooper DU, Perrings C, Venail P, Naeem S (2012). Biodiversity loss and its impact on humanity. Nature 486(7401):59-67.
Crossref |
|
|
|
Cerkal R, Vejrazka K, Kamler J, Dvorak J (2009). Game browse and its impact on selected grain crops. Plant Soil Environ. 55(5):181-186. |
|
|
Chambers R (1994). The origins and practice of participatory rural appraisal. World Dev. 22(7):953-969.
Crossref |
|
|
Chaplin-Kramer R, O'Rourke ME, Blitzer EJ, Kremen C (2011). A meta-analysis of crop pest and natural enemy response to landscape complexity. Ecol. Lett. 14(9):922-932.
Crossref |
|
|
de Groot RS, Alkemade R, Braat L, Hein L, Willemen L (2010). Challenges in integrating the concept of ecosystem services and values in landscape planning, management and decision making. Ecol. Complexity 7(3):260-272.
Crossref |
|
|
de Mey Y, Demont M, Diagne M (2012). Estimating Bird Damage to Rice in Africa: Evidence from the Senegal River Valley. J. Agric. Econ. 63(1):175-200.
Crossref |
|
|
Dunn RR (2010). Global Mapping of Ecosystem Disservices: The Unspoken Reality that Nature Sometimes Kills us. Biotropica 42(5):555-557.
Crossref |
|
|
|
European Space Agency. (2011). GlobCover. |
|
|
Garibaldi LA, Steffan-Dewenter I, Kremen C, Morales JM, Bommarco R, Cunningham SA, Klein AM (2011). Stability of pollination services decreases with isolation from natural areas despite honey bee visits. Ecol. Lett. 14(10):1062-1072.
Crossref |
|
|
Garibaldi LA, Steffan-Dewenter I, Winfree R, Aizen MA, Bommarco R, Cunningham SA, Klein AM (2013). Wild Pollinators Enhance Fruit Set of Crops Regardless of Honey Bee Abundance. Sci. 339(6127):1608-1611. doi: 10.1126/science.1230200
Crossref |
|
|
Ghazoul J (2005). Buzziness as usual? Questioning the global pollination crisis. Trends Ecol. Evol. 20(7):367-373.
Crossref |
|
|
Hellier A, Newton A, Gaona S (1999). Use of indigenous knowledge for rapidly assessing trends in biodiversity: a case study from Chiapas, Mexico. Biodivers. Conserv. 8(7):869-889.
Crossref |
|
|
|
Hoehn P, Tscharntke T, Tylianakis JM, Steffan-Dewenter I (2008). Functional group diversity of bee pollinators increases crop yield. |
|
|
|
Proceedings of the Royal Society B: Biol. Sci. 275(1648): 2283-2291. |
|
|
Hölldobler B (1976). Recruitment behavior, home range orientation and territoriality in harvester ants, Pogonomyrmex. Behav. Ecol. Sociobiol. 1(1):3-44.
Crossref |
|
|
Jonsen ID, Myers RA, Flemming JM (2003). Meta-Analysis of Animal Movement Using State-Space Models. Ecol. 84(11):3055-3063.
Crossref |
|
|
Kalka MB, Smith AR, Kalko EKV (2008). Bats Limit Arthropods and Herbivory in a Tropical Forest. Science 320(5872):71.
Crossref |
|
|
Langellotto G, Denno R (2004). Responses of invertebrate natural enemies to complex-structured habitats: a meta-analytical synthesis. Oecologia 139(1):1-10.
Crossref |
|
|
|
Lundin O, Smith HG, Rundlöf M, Bommarco R (2013). When ecosystem services interact: crop pollination benefits depend on the level of pest control. Proceedings of the Royal Society B: Biol. Sci. 280:1753. |
|
|
Mace GM, Norris K, Fitter AH (2012). Biodiversity and ecosystem services: a multilayered relationship. Trends Ecol. Evolut. 27(1):19-26.
Crossref |
|
|
|
Mahr SER, Cloyd RA, Mahr DL, Sadof CS (2001). Biological Control of Insects and Other Pests of Greenhouse Crops. |
|
|
|
MASDAP. (2013). Malawi Spatial Data Portal. |
|
|
Motzke I, Tscharntke T, Sodhi NS, Klein AM, Wanger TC (2013). Ant seed predation, pesticide applications and farmers' income from tropical multi-cropping gardens. Agricultural and Forest Entomol. 15(3):245-254.
Crossref |
|
|
|
National Statistical Office (2010). National Census of Agriculture and Livestock 2006/07: Main Report. Zomba, Malawi. |
|
|
Oerke EC (2006). Crop losses to pests. J. Agric. Sci. 144(01):31-43.
Crossref |
|
|
|
Pereira E, Queiroz C, Pereira HM, Vicente L (2005). Ecosystem services and human well-being: a participatory study in a mountain community in Portugal. Ecol. Society 10(2):14. |
|
|
|
R Development Core Team (2010). R: A Language and Environment for Statistical Computing. R Foundation for Statistical Computing. Vienna, Austria: R Foundation for Statistical Computing. |
|
|
Reitz SR (2009). Biology and Ecology of the Western Flower Thrips (Thysanoptera: Thripidae): The Making of a Pest. Florida Entomol. 92(1):7-13.
Crossref |
|
|
Ricketts TH, Daily GC, Ehrlich PR, Michener CD (2004). Economic value of tropical forest to coffee production. Proceedings of the National Academy of Sciences of the United States of America 101(34):12579-12582.
Crossref |
|
|
Rodger JG, Balkwill K, Gemmill B (2004). African pollination studies: where are the gaps? Int. J. Trop. Insect Sci. 24(01):5-28.
Crossref |
|
|
|
Roger S, Patrick C, Jon H, Carmen J, Jacquie B, Mahamane L, Waruingi L (2013). A New Map of Standardized Terrestrial Ecosystems of Africa. In A. o. A. Geographers (Ed.), African Geographic Review . Washington DC, USA. pp. 1-24 |
|
|
Sánchez-Cordero V, Martínez-Meyer E (2000). Museum specimen data predict crop damage by tropical rodents. Proceed. National Acad. Sci. 97(13):7074-7077.
Crossref |
|
|
|
Schafer A (2000). Regularities in travel demand: an international perspective. J. Transport. Stat. 3(3):1-31. |
|
|
Snyder WE, Ballard SN, Yang S, Clevenger GM, Miller TD, Ahn JJ, Berryman AA (2004). Complementary biocontrol of aphids by the ladybird beetle Harmonia axyridis and the parasitoid Aphelinus asychis on greenhouse roses. Biol. Control 30(2):229-235.
Crossref |
|
|
Stenseth NC, Leirs H, Skonhoft A, Davis SA, Pech RP, Andreassen HP, Wan X (2003). Mice, rats, and people: the bio-economics of agricultural rodent pests. Front. Ecol. Environ. 1(7):367-375.
Crossref |
|
|
Traniello JFA (1989). Foraging Strategies of Ants. Ann. Rev. Entomol.34(1):191-210.
Crossref |
|
|
Wallace GE, Hill CM (2012). Crop Damage by Primates: Quantifying the Key Parameters of Crop-Raiding Events. PLoS ONE, 7:10.
Crossref |
|
|
Way MJ, Khoo KC (1992). Role of Ants in Pest Management. Ann. Rev. Entomol. 37(1):479-503.
Crossref |
|
|
Willcock S, Phillips O, Platts P, Balmford A, Burgess N, Lovett J, Lewis S (2014). Quantifying and understanding carbon storage and sequestration within the Eastern Arc Mountains of Tanzania, a tropical biodiversity hotspot. Carbon Balance Manage. 9(1):2.
Crossref |
|
|
|
Willcock S, Phillips OL, Platts PJ, Balmford A, Burgess ND, Lovett JC, Lewis SL (2012). Towards Regional, Error-Bounded Landscape Carbon Storage Estimates for Data-Deficient Areas of the World. PLoS ONE 7:9. e44795. |
|
|
Wood TG, Johnson RA, Ohiagu CE (1980). Termite Damage and Crop Loss Studies in Nigeria a Review of Termite (Isoptera) Damage to Maize and Estimation of Damage, Loss in Yield and Termite (Microtermes) Abundance at Mokwa. Tropical Pest Manage. 26(3):241-253.
Crossref |
|
|
Zhang W, Ricketts TH, Kremen C, Carney K, Swinton SM (2007). Ecosystem services and dis-services to agriculture. Ecol. Econ. 64(2):253-260.
Crossref |