ABSTRACT
The experiment was carried out to access the inter relationship of genotypes in their oil yield with seed yield, oil content and other yield components and to determine cluster of white seeded sesame genotypes and environments based on their oil yield. Seventeen sesame genotypes were tested at six environments in northern Ethiopia during 2015 main season. The experiment was laid out in Randomized Complete Block Designs (RCBD) with three replications across all the environments. Seed yield had a significant and positive correlation (P≤0.01) with number of branches (r = 0.414) and number of capsules (r =0.468). Positive correlation seed yield with number of capsules and number of capsules indicated that better yield can obtain from highly branched plants and high number of capsules because the number of capsules increases with the degree of branching. Seed yield was negative significant correlated with days to maturity (r =-0.500) and flowering time (r = -0.626), significant at (p≤0.05) and (p≤0.01), respectively. The negative association between seed yield and days to flowering and maturity indicated that moisture stress after flowering might have caused relatively a yield reduction in the late maturing genotypes. Whereas, the early flowering and early maturing genotypes can escape the moister stress conditions. Based on the cluster analysis of 17 white seeded sesame genotypes classified in to different four distinct clusters. Cluster II, III and IV had high mean yield, oil content and oil yield than the other clusters. Genotypes grouped in those clusters had also greater genetic divergence important for farther yield, oil yield and oil content improvement program breeding in northern Ethiopia. Sesame growing environments also clustered in to four groups. Environments grouped in Cluster I, II and IV had high seed yield, oil content and oil yield. Hence, environments grouped in those clusters are important for seed yield, oil content and oil yield production improvement program in the study areas.
Key words: Cluster analysis, correlation, dendrogram.
Sesame (Sesamum indicum L.) belongings to Pedaliaceae family, is an important and ancient oil-yielding crop. It has an edible seed and has high quality oil (Pathak et al., 2014). It is a diploid species with 2× = 2n = 26 chromosomes. It is a self-pollinated crop, containing 60 species organized into 16 genera (Zhang et al., 2013). Ethiopian sesame is among the highest quality in the world, as seeds are naturally produced at near-organic levels. It is 2nd in terms of area coverage of 420,494.87 ha and total production of 288770 ton/ha next to noug (Guizotia abyssinica Cass.) (CSA, 2015). Western (Humera) and northwestern (Sheraro) parts of Tigray are the main sesame producers with large commercial farms and small scale farmers and good source of income using as a cash crop and local oil extraction (Fiseha et al., 2015). Cluster analysis is the most widely used technique for classifying environments or genotypes into homogeneous groups. It operates on a matrix of dissimilarity (similarity) indexes for all possible pairs of genotypes or pairs of environments, depending on which is being clustered (Ghaderri et al., 1980). Cluster analysis aims to classify a sample of subjects (Objects) on the basis of a set of measured variables into a number of different groups such that similar subjects are placed in the same group (Cornish, 2007). Ward's method is distinct from all other methods because it uses an analysis of variance approach to evaluate the distances between clusters and it attempts to minimize the Sum of Squares (SS) of any two clusters that can be formed at each step. Observations in a specific cluster share many characteristics in common, but are very dissimilar to observations not belonging to that cluster (Ward, 1963).
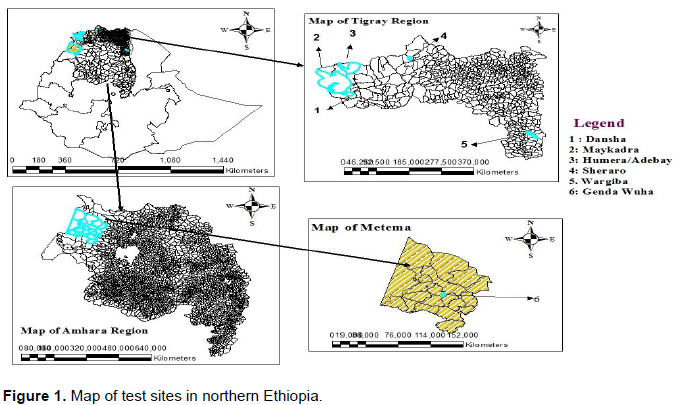
Among the different types of clustering hierarchical clustering is by far the most widely used clustering method. In cluster analysis performing Mahalanobis's (D2) statistic analysis. Mahalanobis (1936) is important which is use for assessing the genetic divergence among the test entries in different clusters. If there is a large jump in the distance between clusters from one stage to another then this suggests that at one stage clusters that are relatively close together were joined whereas, at the following stage, the clusters that were joined were relatively far apart. In any plant breeding program the final objective is to increase quality and quantity of a required crop. Knowing the association between the required traits and other related traits is a prerequisite for breeding programs. Hence, correlation coefficient can measure such simple linear relationship between different yield components. Correlation coefficients range between -1 and +1 and measure the degree and direction of relationships between various traits. Yield is a dependable complex inherited character as a result of interaction of several contributing factors that may be related or unrelated (Subramanian and Subramanian, 1994). Even though the current sesame production in Ethiopia has many opportunities, large area with suitable environments for production (North western and South Western Ethiopia) (Figure 1), growing in low moisture areas, presence of genetic diversity and export demand and very competitive world wide (Wijnands et al., 2007).
Sesame yield, oil content and oil yield are highly variable depending upon the growing environment, cultural practices and cultivars. Even early released varieties showed variable oil content across environments and years.
Therefore, sesame production for its oil content requires due attention and exhaustive researches to identify the right genotype for different production areas. Sesame production is becoming difficult and frustrating for the sesame producers from time to time due to climate variability and it is sensitive crop due to weather changes. It is location specific oil crop and it is difficult to test at individual sesame growing areas in terms of cost and other resources. Therefore, classifying genotypes and environments into similar groups is important to test at one of the clusters. GEI studies to evaluate sesame genotypes were not practicing for many years ago in Ethiopia. Therefore, inaccessibility of improved, stable and high yielder genotypes. But some of the few studies are (Yebio et al., 1993) reported that year and site had significant influence on oil content. There were also significant differences among lines for oil content. The line-site interaction was highly significant difference suggesting that the ranking of the eight lines for oil content across three locations were inconsistent. Hagos and Fetien (2011) showed that there was significantly among genotypes, environments and GEI and the mean yield of genotypes differed from environment to environment in thirteen sesame genotypes tested across three years and locations from 2006 to 2008 in Western and North Western lowlands of Tigray. Zenebe and Hussien (2010) revealed that significant different of GEI among 20 sesame genotypes tested across six environments of Southern Ethiopia. They showed the GEI had significant values for all characters, indicating unstable in their expression with change in environment. The oil content of these genotypes also had highly significant difference across locations and seasons. This difference is due to the difference of soil type, rain fall and temperature in the test locations.
Mekonnen et al. (2015) Reported that there was significant variations among environments and genotypes across all environments in two cropping seasons of twelve sesame genotypes at eight environments in five locations of eastern Amhara Region (Figure 1). The environments had different impacts on the seed yield and oil yield potential of the genotypes. Mohammed et al. (2015) and Fiseha et al. (2015) reported that significance variation among genotypes, environments and GEI components showed highly significant variation for all traits. Thirteen sesame genotypes were evaluated in three locations in North western and Western Tigray from 2011 to 2013 cropping seasons. Environments were the main sources of variation for most of the traits. While, genotypes the main sources of variation for seed yield. Sufficient GEI studies have been undertaken elsewhere in the world to meet either or all of the objectives, among which Yebio et al. (1993), Kumaresani and Nadarajan (2010), Adebisi (2009), Zenebe and Hussien (2010), Hagos and Fetien (2011), Mirza et al. (2013), Fiseha et al. (2015), Mekonnen et al. (2015) and Mohammed et al. (2015). Even all the above studies had undertaken GEI studies on sesame in Ethiopia and the rest of the world, there was no specifically work did on globally preferred white seeded sesame genotypes in Ethiopia and on clustering and correlation of white seeded sesame oil yield. Therefore, this experiment was done to access (i) the inter relationship of genotypes in their oil yield with seed yield, oil content and other yield components (ii) to determine cluster of white seeded sesame genotypes and environments based on their oil yield.
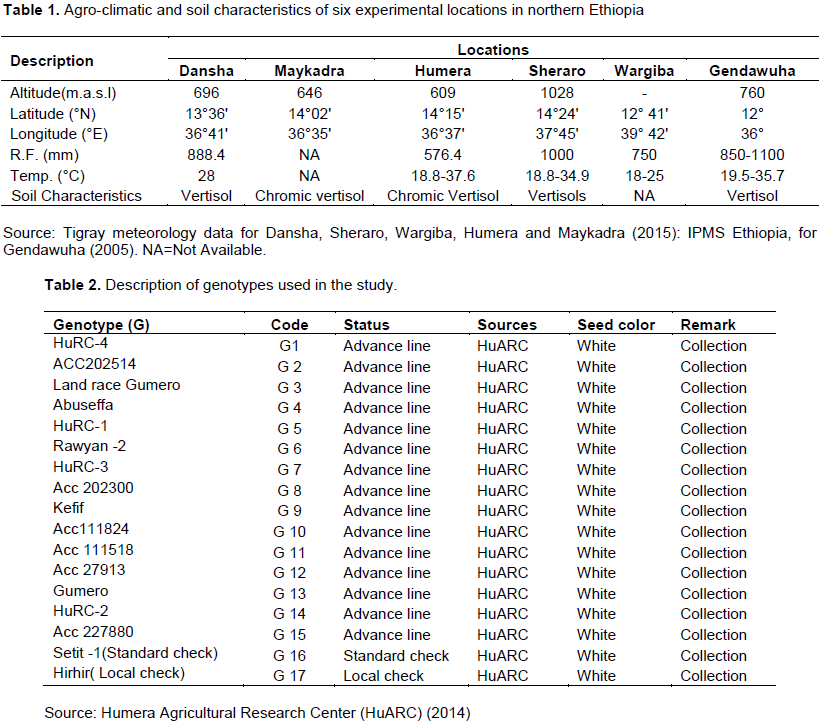
Description of the study areas
Experimental plant materials used in the study
Experimental design and management: The experiment was laid out in randomized complete block design (RCBD) with three replications in all testing sites and 10 m2 total plot area and 6 m2 net plot area with 1m between plots and 1.5 m between blocks keeping inter and intra row spacing of 40 and 10 cm, respectively. Each experimental plot received the same rate of DAP (100 kg/ha) and Urea (50 kg/ha).
Data collection
From the harvestable three rows ten plants were selected randomly and tagged to collect data of plant height, length of capsule bearing zone, number of branches, number of capsules and seeds per capsule. The three experimental rows were harvested, tied in sheaves and were made to stand separately until the capsules opened. After the sheaves have dried out fully and all of the capsules opened, seeds were tipped out onto sturdy cloths or canvases and threshing was accomplished by knocking the sheaves.
Days to 50% flowering (DF)
The number of days from emergence to which 50% of the population in each plot had flowered.
Days to 75% maturity (DM)
The number of days from emergence to when 75% of the plants in each plot had fully matured.
Plant height (PH) (cm)
This growth parameter was measured from ten randomly selected and tagged plants from the harvestable rows of each plot with the help of meter tape from ground surface to the top of the plant.
Length of capsule bearing zone (LCBZ) (cm)
A height from the first capsule to tip of the plant, measured using meter tape.
Number of primary branches per plant (NBPP):
Branches producing productive capsules were done recorded for randomly selected plants.
Number of capsules (NCPP)
The total number of capsules was counted from ten randomly selected plants at maturity.
Seed yield (kg/ha)
The total seed yield harvested from the net plot area was weighed using a sensitive balance.
Thousand seed weight (TSW)
Weighed in grams of 1000 seed.
Number of seeds per capsule (NSPC)
Number of seeds per capsule.
Oil contents (OC) (%)
Oil content was determined by wide line nuclear magnetic resonance (NMR). Seeds were taken from each plot and oven dried at 130°C for 2 h and cooled for 1 h. A sample of 22 g of oven dried clean seed was used for analysis of oil content by NMR (Newport analyzer) (Newport Pagnell, Bucks, and UK) (Robbelen et al., 1989).
Oil yield
The product of oil content (%) and seed yield (kg/ha).
Data analysis
Statistical estimations and computations were performed using different statistical softwares. Homogeneity of residual variances was tested prior to a combined analysis over locations in each year as well as over locations using Bartlett’s test (Steel and Torrie, 1998). Analysis of variance for each environment, combined analysis of variance over environments, correlation between different stability parameters were computed using GenStat 16th edition (2009).
Combined analysis of variance
Variances of homogeneity from results of the Bartlett test revealed that the mean squares of individual environ-ments were homogenous for seed yield, oil contents and oil yield. So, combined analysis of variance could be done. The main effects of environments and genotype and GEI were highly significant at (p≤0.001) for seed yield, oil content, oil yield and yield components. The mean performance of genotypes for oil yield across the tested environments displayed highly Significant variation at (p<0.001). This significance variation gives opportunity for selecting better performing genotypes for oil yield. The grand mean oil yield over six environments was 296.6 kg/ha and the mean oil yield of genotypes across six environments ranged between 125.48 kg/ha in Humera to 531.21 kg/ha in Sheraro respectively (Table 1). High oil yield variation was detected among genotypes ranged between 193.6 kg/ha in G8 to 409.4 kg/ha in G1 respectively (Table 2).
Therefore, G1 had highest oil yield followed by G7, G16, G14, G5 and G12 while G8 was poorly oil yielding. Environments, Sheraro, Dansha and Gendawuha had received optimum rainfall and gave high oil yield. Conversely, the low yielding environments, Humera, Wargiba and Maykadra affected by moisture stress in 2015 cropping season. Oil yield in (kg/ ha) was the product of seed yield (kg/ ha) and oil content (%). The oil yield of genotypes varied to different environments and years with rank changed, this variation among genotypes indicating that selection should be based on mean performances of the genotypes to their respective environments. High seed yield and high oil content genotypes gave highest oil yield whereas low seed yield and oil content genotypes gave low oil yield. The mean performance of genotypes changed across environments. Hence, the breeding strategy should be based on high yielder genotypes. This result is in line with El-Bramawy and Shaban (2007), Mekonnen et al., (2015), Mahasi et al., (2005) on sesame.
Correlation of seed yield, oil content, oil yield and yield components
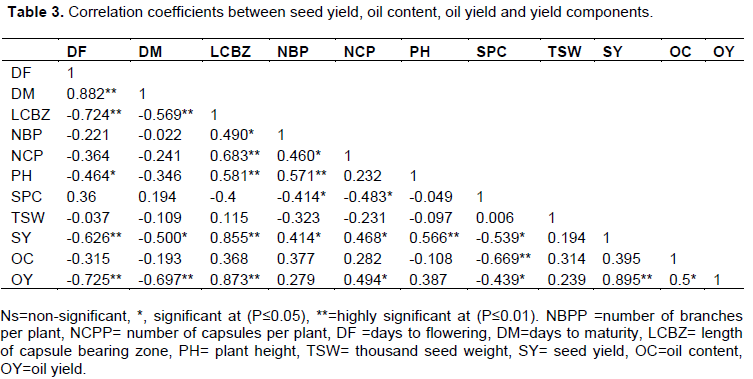
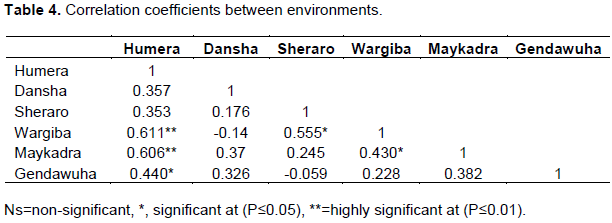
Correlation coefficient analysis was done for yield and other traits for each environments. Seed yield had a significant and positive correlation (P≤0.01) with number of branches (r = 0.414) and number of capsules (r =0.468). Positive correlation seed yield with number of capsules and number of capsules indicated that the best yield was obtained with highly branched plants and high number of capsules because the number of capsules increases with the degree of branching. Similar report by Pham (2011), Fiseha et al. (2015) and Abdou et al. (2015). Seed yield was negative significant correlated with days to maturity (r =-0.500) and flowering time (r = -0.626), significant at (p≤0.05) and (p≤0.01), respectively. The negative association between seed yield and days to flowering and maturity indicated that moisture stress after flowering might have caused relatively a yield reduction in the late maturing genotypes. Whereas, the early flowering and early maturing genotypes helps them to escape the moister stress conditions. This result is similar with Yol (2010) and Fiseha et al. (2015). Days to maturity was negatively correlated with all traits except with SPC (r = 0.194). Number of capsules was positively correlated with number of branches which is in line with several studies (Yirgalem et al., 2013; Fiseha et al., 2015) in sesame. OY was positive and highly significantly correlated with SY (r=0.895) and OC(r=0.512). OY also negatively and significantly correlated with DF(r=-0.725), DM(r=-0.697) and SPC (r=-0.439) (Table 3).

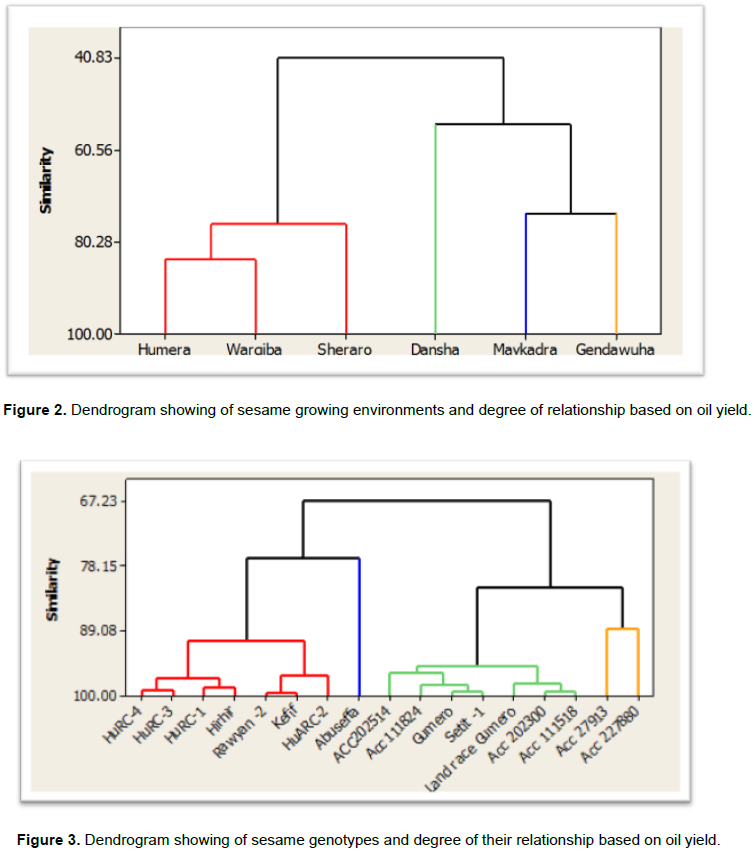
Clustering of genotypes based on mean oil yield
Cluster analysis based on Ward's method (Ward, 1963) using squared Euclidean distance of the
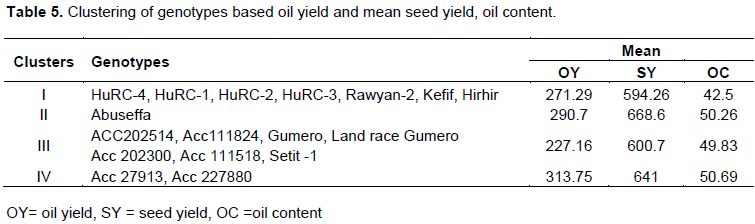
distance metric and standardized variables was performed using Minitab release 16 (Minitab, 1998) to cluster the genotypes and sesame growing environments based on their oil yield in different environments (Figure 2). Moreover, Genetic divergence among the seventeen genotypes was estimated using the Mahalanobis (D2) statistics (Mahalanobis, 1936). Seventeen sesame genotypes were clustered in to four distinct groups based on their oil yield across six environments (Table 1). Cluster I containing seven genotypes: HuRC-4, HuRC-1, HuRC-2, HuRC-3, Rawyan-2, Kefif and Hirhir (local check) with mean seed yield of (594.26 kg/ha), oil content (42.5%) and oil yield (271.29 kg/ha) (Figure 3). This cluster recorded the lowest seed yield and oil content than all clusters. Cluster II containing only one genotype, Abuseffa (668.6 kg/ha), oil content (50.26%) and oil yield (290.7 kg/ha) contained high seed yield, oil content and oil yield. Cluster III containing seven genotypes viz. ACC202514, Acc111824, Gumero, Land race Gumero, Acc 202300, Acc 111518 and Setit -1 with average seed yield of (600.7kg/ha), oil content (49.83%) and oil yield (227.16 kg/ha). this cluster had average yield and included the released variety standard check(Setit-1).

Cluster IV included two genotypes, Acc 27913 and Acc 227880 with mean seed yield of (641kg/ha), oil content (50.69%) and oil yield (313.75 kg/ha). This cluster had the highest oil yield and oil content and high seed yield. Parsaeian et al. (2011) used cluster analysis and grouped different genotypes of sesame in to five similar clusters based on their Agro-morphological traits. Likewise, Tripathi et al. (2013) also clustered different sesame genotypes based on morphological and quality traits, Gadisa et al. (2014) clustered different genotypes based on phenotypic traits and Fiseha et al. (2015) based on agronomic traits. The mean value of the 17 quantitative characters in each cluster is presented in Table 2. Cluster I consisted of seven genotypes having the characteristic of early flowering, early maturing, high number of seeds /capsule, longest plant stature, longest length of capsule bearing zone, but low seed yield, oil content (Table 4). Whereas Cluster IV consists of two genotypes.This cluster characterized by shortest plant stature, earlier flowering, earlier maturity, high number of branches, high number of capsules, high seed yield, highest oil yield and oil content. Similar work was reported by Gadisa et al. (2014) and Fiseha et al. (2015).

Clustering of sesame growing environments based on oil yield
Six sesame genotypes environments were clustered in to four distinct groups based on their oil yield (Table 2). Cluster I containing three environments: Humera, Wargiba, Sheraro with mean seed yield of (603.35kg/ha), oil content (49.24%) and oil yield (291.1 kg/ha). This cluster of environments recorded average seed yield. Cluster II containing only one environment, Dansha with mean seed yield of (668.6 kg/ha), oil content (50.26%) and oil yield (261.2 kg/ha). Cluster III containing one environment viz. Maykadra and recorded seed yield (386.76 kg/ha), oil content (48.61%) and oil yield (197.01 kg/ha). This cluster recorded the lowest seed yield, oil content and oil yield. Whereas Cluster IV contained one environment, Gendawuha which recorded the highest seed yield (853.04 kg/ha), oil content (52.54%) and oil yield (447.95 kg/ha) than all clusters. Variation exist among genotypes indicated that oil content was highly affected by environments (rain fall, altitude, soil type, temperature etc.). Gendawuha (52.5%) gave the highest mean oil content followed by Sheraro (50.99%) and Dansha (50.6%) which received high rainfall in the 2015 cropping season (Table 5).
Lower altitude locations were faced to moisture stress and gave low oil content: Humera (48.2%) followed by Wargiba (48.5%) and Maykadra (48.61%).This result is in agreement with Zenebe and Hussein (2010) and Mekonnen et al. (2015). To improve the oil yield and oil content of sesame genotypes, selection should be based on high seed yield with relatively high oil content or cross breeding of high seed yielder with high oil content genotype.
White seeded sesame genotypes showed varied response to environmental changes. Thus, the influence of environment was highly prominent in the manifestation of oil yield variation along northern Ethiopia sesame growing environments (Figure 1). The positive correlation yield with number of capsules and number of branches indicated that best yield was obtained with highly branched plants and high number capsules. The negative association between yield and flowering and maturity indicated that moisture stress after flowering might have caused relatively a yield reduction in the late maturing genotypes. Whereas, the early flowering and maturing genotypes can escape the moister stress conditions. Therefore, early maturing genotypes will be recommended for moisture stress areas and late maturing for high rain fall areas. Genotype clusters had high mean yield, oil content and oil yield with greater genetic divergence will be used for oil yield improvement program. Environmental clusters had high yield, oil content and oil yield will be used for oil yield production in the study areas.
The author has not declared any conflict of interests.
REFERENCES
|
Abdou RIY, Moutari A, Ali B, Basso Y, Djibo M (2015).Variability Study in Sesame (Sesamum indicum (L)) Cultivars based on Agro-Morphological Characters. Int. J. Agric. For. Fish. 3(6):237-242
|
|
|
|
Adebisi MA (2009). Stability Analysis of Seed Germination and Field Emergence Performance of Tropical Rain-fed Sesame Genotypes (Sesamum indicum L.). Report and opinion, 1(5) University of Agriculture, Abeokuta., Nigeria.
|
|
|
|
|
Cornish R (2007). Cluster Analysis: Statistics, Mathematics learning support center.
|
|
|
|
|
CSA (Central Statistical Agency) (2015). Agricultural Sample survey 2014/2015 (2007 E.C). Report on Area and Production of crops (private peasant holdings, Meher season). Addis Ababa 1(578):12-17.
|
|
|
|
|
El-Bramawy MA, Shaban WI (2007). Nature of Gene Action for Yield, Yield Components and Major Diseases Resistance in Sesame (Sesamum indicum L.) 1Agronomy Department, Faculty of Agriculture, Suez Canal University, 41522 Ismailia, Egypt. 2Agricultural Botany Department Faculty of Agriculture, Suez Canal University, 41522 Ismailia, Egypt.
|
|
|
|
|
Fiseha B, Yemane T, Fetien A (2015). Grain yield based cluster analysis and correlation of agronomic traits of sesame (sesamum indicum l.) genotypes in Ethiopia. J. Nat. Sci. Res. 5(9):11-17
|
|
|
|
|
Gadisa H, Negash G, Zerihun J (2014). Correlation and Divergence Analysis for Phenotypic Traits in Sesame (Sesamum indicum L.) Genotypes. Sci. Technol. Arts Res. J. pp. 1-9.
|
|
|
|
|
GenStat (2009). Gen Stat for Windows (16th Edition) Introduction. VSN International, Hemel Hempstead.
|
|
|
|
|
Ghaderri A, Everson EH, Cress CE (1980). Classification of environments and genotypes in wheat. Crop Sci. 20(6):707-710
Crossref
|
|
|
|
|
Hagos T, Fetien A (2011). Additive Main Effects and Multiplicative Interactions Analysis of Yield Performance of Sesame Genotypes across Environments in Northern Ethiopia. J. Drylands 4(1):259-266.
|
|
|
|
|
Mahalanobis PC (1936). On the generalized distances in statistics, Proc. Nation: Inst. Sci. India 2:49-55.
|
|
|
|
|
Mekonnen M, Firew M, Adugna W (2015). GEI interaction of sesame (Sesamum indicum L.) in Eastern Amhara region, Ethiopia. Afr. J. Agric. Res. 10(21):2226-2239.
|
|
|
|
|
Mirza YM, Khan M, Amjad M, Nawaz M (2013). Stability Analysis for Economic traits in Sesame (Sesamum indicum L.), Pak. J. Agric. Res. 26(3):256-267.
|
|
|
|
|
Mohammed Abate. 2015. Genotype x Environment analysis for seed yield and its components in sesame (Sesamum indicum L.) evaluated across diverse agro-ecologies of the awash valleys in Ethiopia. J. Adv. Stud. Agric. Biol. Environ. Sci. 2(4):1-14.
|
|
|
|
|
Parsaeian M, Mirlohi A, Saeidi G (2011). Study of genetic variation in Sesame (Sesamum indicum L.) using agro-morphological traits 47:314-321.
|
|
|
|
|
Pathak N, Rai AK, Kumari R, Thapa A, Bhat KV (2014). Sesame Crop: An Underexploited Oilseed Holds Tremendous Potential for Enhanced Food Value. Agric. Sci. 5:519-529.
Crossref
|
|
|
|
|
Pham DT, Nguyen TTD, Carlsson AS, Bui MT (2011). Morphological evaluation of Sesame (Sesamum indicum L.) varieties from different origins, Australian J. Crop Sci. 4(7):498-504.
|
|
|
|
|
Robbelen G, Downey RK, Ashri A (1989). Oil Crops of the World. McGraw-Hill New York P. 553.
|
|
|
|
|
Subramanian S, Subramanian M (1994). Correlation studies and path coefficient analysis in Sesame (Sesamum indicum L.). J. Agron. Crop Sci. 173:241-248.
Crossref
|
|
|
|
|
Tripathi A, Bisen R, Ahirwal P, Paroha S, Sahu R, Ranganatha A R(2013). Study on genetic divergence in Sesame (Sesamum indicum L.) germplasm based on morphological and quality traits. Suppl. Genet. Plant Breed. 8(4):1387-1391.
|
|
|
|
|
Ward JH (1963). Hierarchical grouping to optimize an objective junction. J. Am. Stat. Assoc. 58:236-244.
Crossref
|
|
|
|
|
Wijnands J, Biersteker J, Hiel R (2007). Oilseeds Business Opportunities in Ethiopia. Survey report, Ministry of Agriculture, Nature and Food Quality, The Netherlands, The Hague pp. 8-20.
|
|
|
|
|
Yebio, W., Fanous, M., Coulman, B. and Omran, A. 1993. Genotype x environment study on sesame in Ethiopia. In: Oil Crops Newsletter: The IDRC Oilcrops Network Project and the Institute of Agricultural Research. In (Omran A. (ed.). No. 8, A.A., Ethiopia pp. 23-27.
|
|
|
|
|
Yirgalem T, Sentayehu A, Geremew T (2013). Assessment of genetic variability, Genetic Advance, Correlation and Path analysis for Morphological Traits in Sesame Genotypes. Int. J. Plant Breed. Genet. 7(2):21-34.
|
|
|
|
|
Yol E, Karaman E, Furat S, Uzun B (2010). Assessment of selection criteria in Sesame by using correlation coefficients, path and factor analyses. Austr. J. Crop Sci. 4(8):598-602.
|
|
|
|
|
Zenebe Mekonnen, Hussien Mohammed. 2010. Study on genotype x environment interaction of oil content in sesame (Sesamum indicum L.). World J. Fungal Plant Biol. 1(1):15-20.
|
|
|
|
|
Zhang Y, Wang L, Xin H, Li D, Ma C, Ding X, Hong W, Zhang X (2013). Construction of a High-Density Genetic Map for Sesame Based on Large Scale Marker Development by Specific Length Amplified Fragment (SLAF) Sequencing. BMC Plant Biol. 13:141.
|
|