Full Length Research Paper

ABSTRACT
Farmers’ implementation of suitable adaptation measures in the face of climate variability and change (CVC) depends first and foremost on their ability to perceive CVC. This paper analyzes the adaptation measures implemented by smallholder farmers (SHFs) in Mbengwi Central Sub-Division, North-West Region of Cameroon in the face of CVC as well as the determinants of smallholder farmers’ choice of adaptation measures. Climate data collected from meteorological stations in the study area and farmers’ perceptions obtained through household surveys were analyzed using descriptive statistics (frequency tables, bar charts, histograms and percentage indices) and inferential statistics (Coefficient of Variation and the Multinomial Logistic (MNL) regression model). Farmers’ perceptions of CVC were then compared with actual short and long term meteorological data for the study area. Analysis was done on SPSS 17.0, Microsoft Excel 2007, and STATA 7.0. The results revealed that a majority of the respondents perceived an increase in temperature (79.2%) and a drop in the quantity of rainfall (59.2%) which corroborated almost perfectly with the analyzed meteorological data for the study area. From the twelve adaptation measures identified by SHFs, home gardens emerged as the most prevalent adaptation measure in the study area. Following the categorization of the multifarious adaptation measures implemented by SHFs, agroforestry practices emerged as the most prevalent adaptation measure. Results of the MNL regression model revealed that the main determinants of farmers’ choice of adaptation measures in the study area were age of household head, number of farms possessed, farm size, and access to weather information (p<0.05).
Key words: Climate variability and change, smallholder farmers, adaptation measures, agroforestry practices, Mbengwi Central Sub-division, Cameroon.
INTRODUCTION
Climate variability and change will be the most devastating for developing countries due to their dependence on agriculture especially rain-fed agriculture coupled with their geographical location on one hand and their limited adaptation capacity on the other hand (UNFCCC’s COP 21, 2015; WMO, 2016). This is particularly true for Africa which is the most tropical of all the continents in the world (IPCC, 2007; Kreft et al., 2014). Africa is already facing many hazards caused by climate variability and change, and this is expected to aggravate in the coming decades (FAO, 2016). The IPCC (2001) insinuates temperature changes for Africa between 0.2 and 0.5°C per decade. Total agricultural productivity loss in Africa due to climate variability and change is estimated to be between 17 and 28% as compared to 3 and 16% for the world as a whole (Cline, 2007). Documenting and encouraging the implementation of climate-smart and sustainable adaptation options therefore becomes incumbent (United Nations Sustainable Development Summit, 2015).
Sub-Saharan Africa which is a predominantly tropical region will bear the greatest brunt of climate variability and change according to predicted climate scenarios. This is due principally to its tropical nature on the one hand and high rates of poverty, high dependence on rain-fed agriculture, coupled with governmental and institutional failures on the other hand (World Bank, 2013). Following predicted climate scenarios, smallholder farmers in sub-Saharan Africa are expected to experience decreased precipitation and increased temperatures, initiating troubles in production stability for many of these economically bartered farmers (Cooper et al. 2008). According to Cooper (2004), about 89% of cereals cultivated in sub-Saharan Africa are rain-fed which makes them highly vulnerable to the whims of climate variability and change. Climate is a key determinant of food security which explains why its variation poses a serious problem to agriculture dependent economies like those of sub-Saharan Africa (World Bank, 2013; Kreft et al., 2014). Therefore, environmentally benign adaptation measures need to be actively documented and promoted.
Cameroon which constitutes an integral part of sub-Saharan Africa is therefore expected to face the same fate as the other countries found in this region. A large amount of scholarship already shows that in the absence of adaptation, climate variability and change will be a nuisance in Cameroon, especially in catalytic sectors like agriculture and livestock rearing (Molua, 2006, 2008; Molua and Lambi, 2007; Tingem et al., 2008a, b; Cameroun Vision, 2015; Document de Travail, 2009; GESP, 2009; Norrington-Davies, 2011; Somah, 2013; PNACC, 2015). The average temperature in Cameroon is predicted to increase as a result of global warming according to transient General Circulation Models (GCMs) (Tingem et al., 2009; Norrington-Davies, 2011). Based on the HadCM3 model, annual temperatures in Cameroon are expected to rise by 0.7 to 0.8°C by 2020 (Tingem et al., 2007). Agricultural production in Cameroon is already blighted by low levels of input (for example low quality seeds, limited irrigation, limited and inappropriate fertilizer, pesticide and herbicide use) due to farmers’ low purchasing power, low levels of government subsidies, and high dependence on rain-fed agriculture which leads to low crop productivity (Tingem et al., 2009; Witt and Waibel, 2009). According to the World Bank (2011), since the year 2000, Cameroon’s annual growth rate has been on a downward trajectory with only 2% growth in 2009. Almost 40% of the population continues to live below the national poverty line and Cameroon currently ranks 131st out of 169 nations in the Human Development Index (World Bank, 2011). A greater part of Cameroon’s poor live in rural areas and practice agriculture which is the largest sector of the economy contributing about 45% to the annual Gross Domestic Product of the country (World Bank, 2011). All these factors go a long way to increase the vulnerability of smallholder farmers in Cameroon faced with climate variability and change, hence the necessity to document low-cost, climate-smart and sustainable adaptation measures.
The North-West Region of Cameroon like other parts of the country is already facing and will in the coming decades face even greater climate variability and change especially in precipitation and temperature patterns with devastating impacts on smallholder farmers (de Witt, 2011; Sunjo et al., 2012; Kimengsi et al., 2015). Smallholder farmers in the North-West Region of Cameroon in general and Mbengwi Central sub-Division (MCSD) in particular are already experiencing and will in the coming decades face even greater dire effects of climate variability and change owing mainly to their limited adaptive capacity (excruciating poverty and inadequate or no institutional support) as well as other factors like high dependence on rain-fed agriculture (less than 1% of farmers practice irrigation), limited off-farm activities (absolute dependence on agriculture) and few or no best farming practices (Awazi and Tchamba, 2018).
Based on the aforementioned problems facing smallholder farmers across Africa in general and the study area in particular in their struggle to adapt to climate variability and change, this research paper seeks to provide answers to the following research questions: what is the degree of climate variability and change? What are the different adaptation measures implemented by smallholder farmers in the face of climate variability and change? What are the determinants of smallholder farmers’ choice of adaptation measures? What is the effectiveness of the most prevalent adaptation measure in reducing vulnerability to climate variability and change?
Providing answers to the aforementioned questions helped in the attainment of the objectives of the study which were:
(1) To assess the degree of climate variability and change
(2) To identify the different adaptation measures implemented by smallholder farmers
(3) To assess the determinants of smallholder farmers’ choice of adaptation measures
(4) To identify the effectiveness of the most prevalent adaptation measure in reducing vulnerability.
MATERIALS AND METHODS
Description of the study site
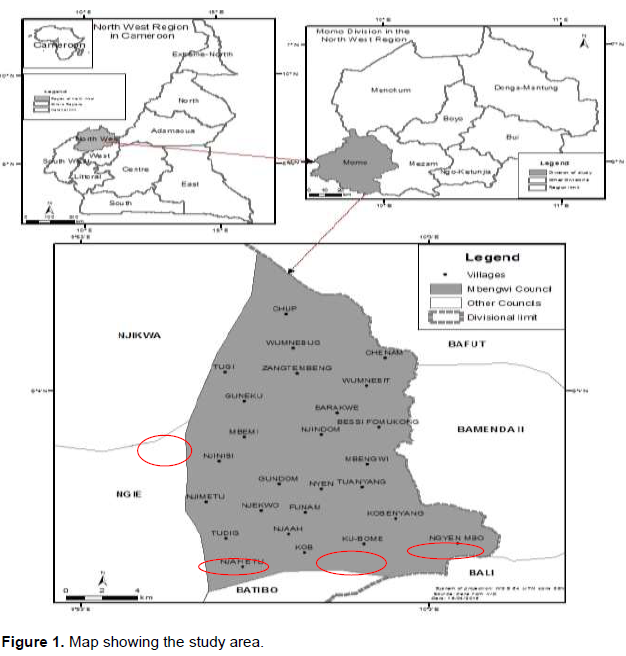
This study was conducted in Mbengwi Central Sub-Division, North-West Region of Cameroon (Figure 1). It lies between latitude 6°00’ and 6°05’ North and longitude 10°00’ and 10°02’ East. It has an essentially tropical climate characterized by two distinct seasons: the dry season and the rainy season. Rainfall mainly occurs during the rainy season which stretches from March to mid-March to mid-October (but this trend has been fluctuating very much in recent decades). The long term annual average temperature is 26°C. The long term annual average rainfall in Mbengwi Central sub-Division is 1450 mm. The sub-division falls within the relief region known as the Western Highlands of Cameroon and is dominated mainly by savannah grasslands. The principal economic activity undertaken by the inhabitants of the study area is agriculture practiced mainly by smallholder farmers who inhabit the rural areas (DDARD and SDARD, 2015).
Sampling procedure
A multiple phase or multi-stage sampling procedure was followed in laying out the survey as used by other scientific studies (Temesgen et al., 2014; Feleke, 2015; Hadgu et al., 2015; Atinkut and Mebrat, 2016).
At the first phase, the study area was purposively selected owing to the high proportion of the population engaged in smallholder agriculture and the high rate of vulnerability of its smallholder farmer population to extreme weather events (due principally to their limited adaptive capacity).
At the second phase, the 29 villages found in the sub-division were grouped into three strata based on their micro agro-ecological-relief characteristics (type of crop grown and livestock raised, vegetation type, and altitude). According to the micro agro-ecological-relief characteristics of MCSD, the three strata are:
Bome zone (60% of the total land surface), Tondig Zone (15% of the total land surface) and Taah zone (25% of the total land surface) (Mbengwi Council Development Plan Report, 2012). Hence, in order to get a representative picture of the entire sub-division, one village was selected from each of these strata with the help of agricultural extension officers. However, owing to the largeness of the Bome zone, an additional village was selected from there, still with the aid of agricultural extension officers. Thus four villages were selected for this survey.
At the third phase, stratified random sampling was conducted. Farmers were stratified based on age into two strata: those with ages below 30 years and those with ages above 30 years. And then 30 smallholder farmer household heads (with ages above 30 years) were randomly sampled in each of the 4 villages (Mainly farmers with ages above 30 were sampled in order to have a better picture of the situation of climate variability and change in the study area). Hence, a total of 120 smallholder farmer household heads were interviewed in the four (04) selected villages giving a sampling rate of 30.38%.
The fourth phase involved Key Informant Interviews (KIIs) with village leaders, chiefs of agricultural posts, delegates and sub-divisional delegates in the Ministries of Agriculture and Rural Development; Environment, Protection of Nature and Sustainable Development; Livestock, Fisheries and Animal Husbandry. KIIs were conducted in order to verify the veracity of the responses given by smallholder farmers during household surveys.
Data collection and analysis
The study made use of both qualitative and quantitative methods to collect primary data for the study area. The methods used were: household surveys, KIIs, and direct observations. Most of these primary data were collected through household survey using structured and semi-structured questionnaires where smallholder farmer household heads (above 30 years) constituted the sampling unit. KIIs with purposely selected resource persons in the study area provided general information to complement the data obtained through household surveys. A semi-structured interview guide approach was employed during KIIs. Direct field observations through transect walks were also frequently undertaken in the study area in order to ascertain the veracity of the responses obtained from household surveys and KIIs. Primary data was collected from four villages selected with the help of agricultural extension agents taking into cognizance the agro-ecological and relief characteristics of the study area. A survey of 120 smallholder farmer households using stratified random sampling of 30 households per village was conducted at a sampling rate of 30.38%.
Secondary data mainly on past temperature and rainfall was collected from the meteorological stations in the study area. Rainfall and temperature data for 11 years (2004 to 2014) was collected from Divisional Delegation of Agriculture and Rural Development (DDARD) based on Mbengwi (the study area), while rainfall and temperature data for 54 years was collected from the Regional Service of Meteorology for the North-West Region (Bamenda-Station) located at some 20 km from the study area.
Statistical analysis of the data obtained from household survey was done on the Statistical Package for Social Sciences (SPSS) 17.0, Microsoft Excel 2007 and STATA version 7.0. Descriptive statistics like percentage indices, frequency tables, bar charts and
graphs as well as inferential statistics like Coefficient of Variation (CV) (Equations 1 and 2) and the Multinomial Logistic (MNL) regression model (Equation 3).
CV was used to analyze the short term variability in rainfall and temperature for 11 years. To calculate the CV, the standard deviation is obtained. This is defined as:
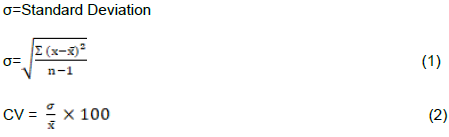
And as a rule of thumb, when the CV is greater than 10, it is unreliable meaning variability is high but when the CV is less than 10, it is reliable meaning variability is low.
Long term variability and change was analyzed by calculating the rainfall and temperature anomalies for 54 years. This was done by calculating the residual for temperature (annual average - 54 years average) and the residual for rainfall (annual- 54 years mean). As a rule of thumb, variability in climate elements over a period greater than three decades definitely signifies climate change (IPCC, 2007).
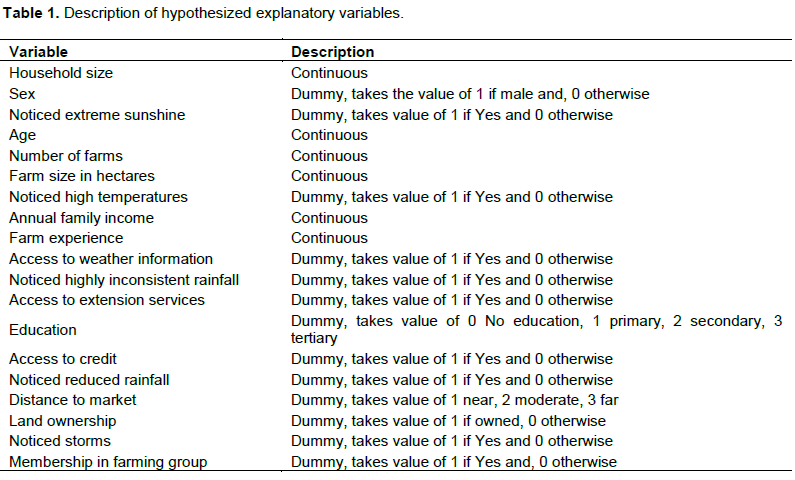
The MNL regression model (Equation 3) was used to determine the causal relationship between smallholder farmers’ choice of adaptation measures (multinomial dependent variable) with respect to various hypothesized continuous and discontinuous explanatory variables (Table 1). This model has equally been used by other research works on adaptation to climate variability and change (Temesgen et al., 2014).
Following Greene (2003), the MNL model permits the analysis of multiple choice problems. According to Deressa et al. (2009), the MNL model permits the analysis of decisions across more than two categories, enabling the determination of choice probabilities and is equally simple to compute. This model has response probabilities.
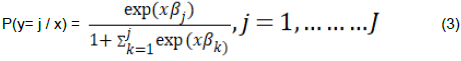
where y is a random variable (adaptation options) with the values (1,2,..............J), j is a positive integer, x is a set of conditioning variables (socio-economic, institutional and environmental factors), and  is K×1.
The running of the MNL model proper was done on SPSS 17.0. Before running the actual model estimate, Hausman Specification test was run on STATA version 7.0 in order to check the validity of the Independence of Irrelevant Alternatives (IIA) assumption. This test failed to reject the null hypothesis of the independence of the adaptation options under consideration. This implies that the application of the MNL specification was appropriate to model the determinants of adaptation measures.
RESULTS AND DISCUSSION
Degree of climate variability and change
Variations and changes in rainfall and temperature patterns
Analysis of rainfall and temperature data for 11 years showed high levels of variability in these two climate elements (Table 2). In order for greater reliability to exist, there should be less variability. As a rule of thumb, when a CV is greater than 10 as show earlier, it is unreliable meaning variability is high but when the CV is less than 10, it is reliable which means variability is low.
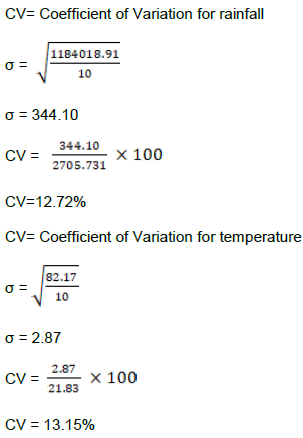
From the results, both rainfall and temperature showed high levels of variation, having exceeded the 10% threshold of reliability. The CV for rainfall (12.72%) and that of temperature (13.15%) all exceeded the 10% threshold indicating that there exists significant variability in these climatic elements.
A similar data analysis procedure was followed by Kimengsi and Tosam (2013), in a study conducted to assess the impact of climate variability on cocoa production in Meme Division, South-West Region of Cameroon.
Analysis of long term rainfall data (1961-2014) equally showed high levels of variability and recurrent weather events (especially erratic and inadequate rainfall and relatively high temperatures) (Figures 2, 3 and 4).

Five year average rainfall residuals (quantity of actual average rainfall for five years- 54 years average) and actual average rainfall between 1961 and 2014 showed significant variability (Figure 2). Huge rainfall deficits were observed between 1961 and 2014 with 6 out of the 11 five years intervals experiencing rainfall deficits. Serious rainfall deficits most especially occurred between the periods of 1971-1975, 1986-1990,1991-1995, 1996-2000, 2001-2005, and 2006-2010. The solid line on the residual rainfall graph represents 10 years moving average. Variations in the quantity of rainfall within the five year intervals ranged between 1.16 and 18.80%, with very high variability in the 1960, 1970, 1990 and early 2000s.
Temperature on its part has seen relatively high levels of variability and some relative increase in the past 54 years (Figure 3). Five years temperature residuals (five year average temperature – 54 years average) show some relative degree of variability in temperature especially from the 1980s up to 2014.
The number of rainy days equally fluctuated highly between 1961 and 2014. The number of rainy days equally noticed a drastic fall with 6 out of the 11 five year intervals experiencing fewer rainy days (Figure 4). Fewer rainy days most especially occurred between the years 1961-1965, 1971-1975, 1986-1990, 1991-1995, 2001-2005, and 2006-2010.
Smallholder farmers’ perception of variations and changes in climate elements
Analysis of household survey showed that all the respondents perceived climate variability and change. But their perceptions varied with respect to the different climate elements of rainfall, temperature, sunshine, wind and storms (Table 3). Pertaining to the total amount of rainfall, the perceptions of most of the respondents was that the total amount of rainfall has been decreasing from decade to decade (1985-2014). 59.2% of the respondents perceived that the total amount of rainfall decreased a lot between 2005 and 2014 as opposed to the 12.5 and 1.7% of respondents who perceived that the rainfall decreased a lot between 1995 and 2004 and 1985 and 1994, respectively.
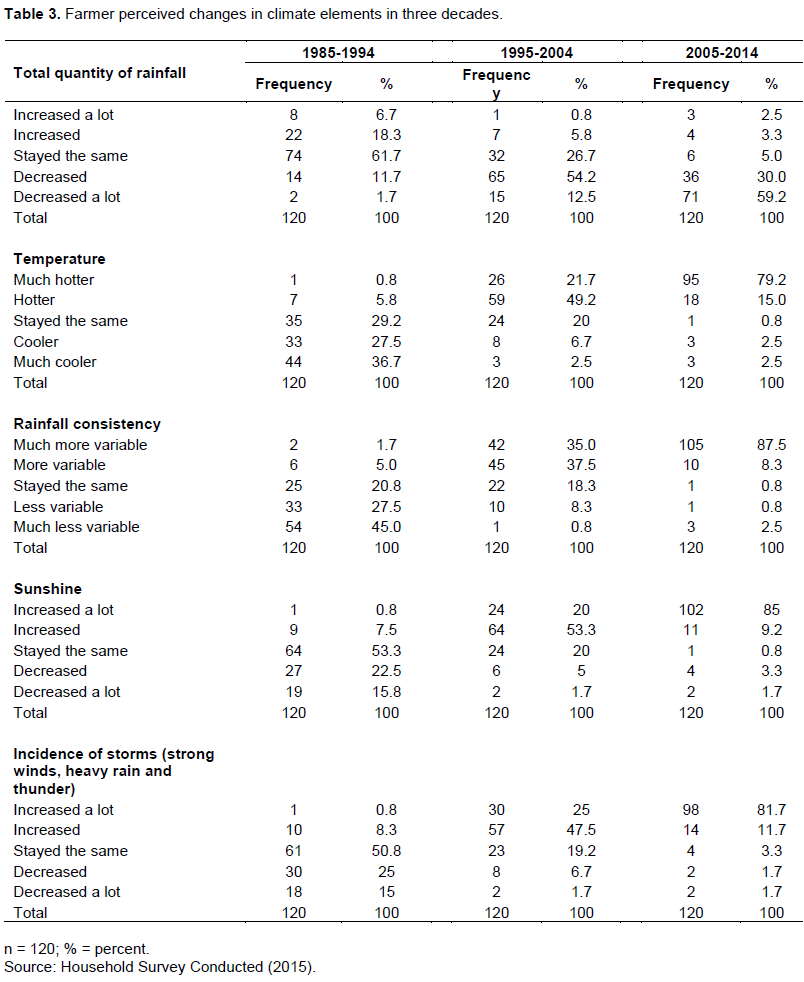
Pertaining to temperature, 79.2% of the respondents perceived that temperature was much hotter between 2005 and 2014 as opposed to the 21.7 and 0.8% of respondents who perceived much hotter temperature between 1995 and 2004 and 1985 and 1994, respectively.
With regards to rainfall consistency, most of the respondents perceive that rainfall has become increasingly variable as the decades go by. 87.5% of the respondents perceive that rainfall was much more variable between 2005 and 2014 as opposed to the 35 and 1.7% of respondents who perceived that rainfall was much more variable between 1995 and 2004 and 1985 and 1994, respectively.
It must therefore be said that farmers’ perceptions of reduction in total quantity of rainfall, rainfall inconsistency and high temperature (Table 3) largely falls in line with meteorological data for the study area. Similar results have been found by other studies across Africa and the tropics (Aggarwal et al., 2015; Sarr et al., 2015) demonstrating that there is increasing unanimity amongst smallholder farmers that climate variability and change is real and characterized by changing weather patterns and extreme climate events.
Smallholder farmers’ adaptation measures and determinants of choice of adaptation measures
Smallholder farmers’ adaptation measures
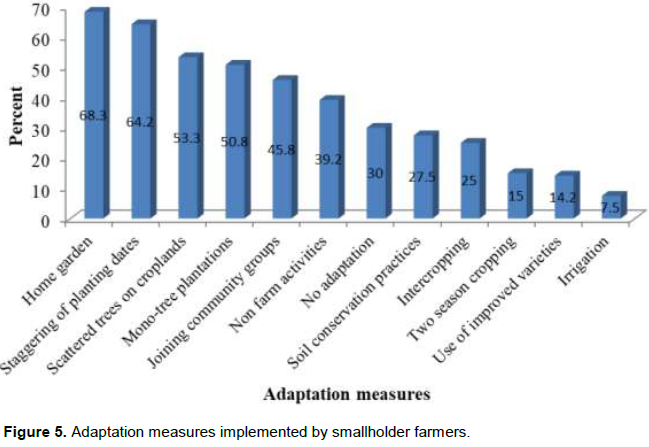
In order to counteract the negative impacts of climate variability and change, smallholder farmers implemented a combination of adaptation measures simultaneously (Figure 5). The most recurrent adaptation measures identified by smallholder farmers included staggering of planting dates (64.2%), scattered trees on croplands (53.3%), mono-tree plantations (50.8), home garden (68.3%) and joining community groups (45.8%). Meanwhile the least recurrent adaptation options identified by farmers were irrigation (7.5%), two seasons cropping (15%), use of improved crop and animal species (14.2%). No adaptation equally featured prominently amongst the adaptation options (30%). Several studies conducted on adaptation to climate variability and change have equally found similar results across different parts of Cameroon, Africa and the tropics revealing that a combination of adaptation measures is used simultaneously by smallholder farmers (Molua and lambi, 2007; Atinkut and Mebrat, 2016; FAO, 2016).
Determinants of smallholder farmers’ choice of adaptation measures
In order to determine the causal relationship between farmers’ choice of adaptation measures with respect to several hypothesized explanatory variables, the MNL model was run (Table 5). In order to run this model, the different adaptation options were categorized (Table 4).
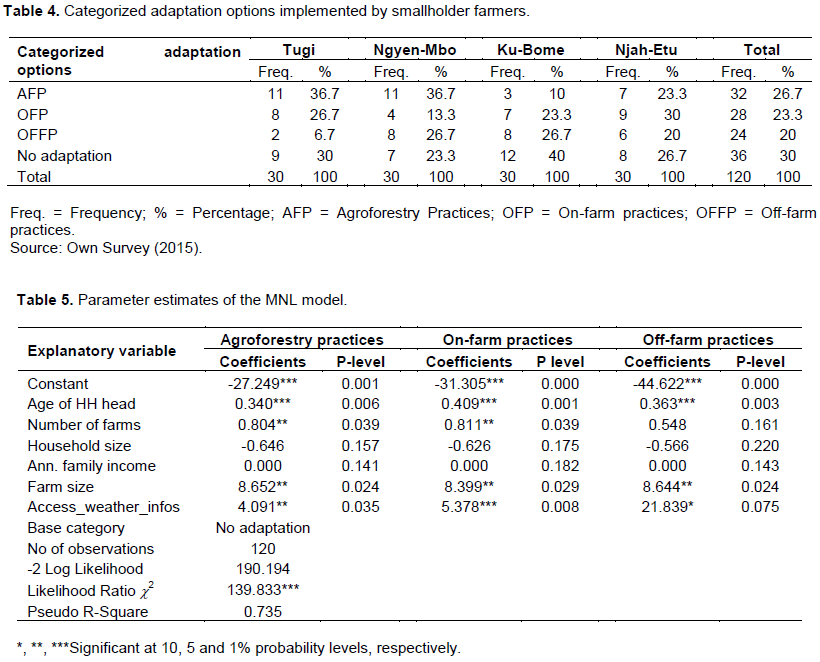
Following the categorization of the different adaptation measures, four major categories emerged: Agroforestry practices, On-farm practices, Off-farm practices and “No adaptation” (Table 4). Agroforestry practices (Combination of home gardens and scattered trees on croplands) were the most recurrent option implemented by smallholder farmers in the study sites (26.7%). This can be attributed to the pro-poor and sustainable nature of agroforestry practices when compared with the other adaptation options. The use of agroforestry practices as an adaptation option in the face of climate variability and change has equally been found useful by other studies (Lin, 2007; Nguyen et al., 2012; Bishaw et al., 2013; Mbow et al., 2013a, b; Kabir et al., 2015; Lasco et al., 2015). These studies all show that agroforestry practices are low cost, climate-smart land-use systems which provide the four ecosystem services described by the Millennium Ecosystem Assessment Report of 2005, provisioning, regulating, cultural, and supporting services. Provisioning services in particular (food, fibre, medicines, wood, and construction materials) provided by agroforestry practices help smallholder farmers to diversify their income sources thereby making them more resilient in the face of climate variability and change (Nguyen et al., 2012; Bishaw et al., 2013; Mbow et al., 2013a; Kabir et al., 2015).
On-farm and off-farm practices were equally adopted by smallholder farmers in their struggle to adapt to climate variability and change. The use of these two practices has equally been identified by other studies conducted in different parts of Africa (Molua, 2006; Tabi et al., 2012).
The “No adaptation option” equally featured prominently with 30% of smallholder farmers taking to it. These smallholder farmers continued their farming activities “business-as-usual”. Several factors explain this state of affairs. The major barriers to adaptation in the study area were: limited or no weather information, shortage of land, low prices of farm products, poverty, lack of good farm inputs, limited or no advice from government and NGO extension agents, and limited irrigation potentials. These barriers to adaptation have equally been found by several studies across Africa (Tabi et al., 2012; Kabir et al., 2015; Mersha and Laerhoven, 2016).
The MNL regression model revealed that age of the household head, number of farms, farm size and access to weather information contributed significantly to influencing smallholder farmers’ choice of adaptation measures (p<0.01; p<0.05; p<0.10) meanwhile annual family income and household size did not significantly influence smallholder farmers’ choice of adaptation measures (p>0.10) (Table 5).
Age of household head (p<0.01) significantly influenced the implementation of adaptation measures: agroforestry practices (combination of home gardens and scattered trees on croplands), on-farm practices (combination of staggering of planting dates, soil conservation practices, intercropping, two season cropping, irrigation and improved varieties) and off-farm practices (combination of mono-tree plantations, joining community groups and non-farm activities). This means that the older the farmer, the higher the likelihood to implement adaptation measures like agroforestry practices, on-farm practices and off-farm practices. Several studies undertaken in Africa and the tropics have also found age of the household head to be a major determinant of smallholder farmers’ choice of adaptation measures (Deressa et al., 2008; Tabi et al., 2012; Kabir et al., 2015; Atinkut and Mebrat, 2016). This is because age is generally associated with farm experience, and hence the older the farmer, the more experienced they are.
Number of farms (p<0.05) positively influenced smallholder farmers’ implementation of adaptation measures especially agroforestry practices and on-farm practices. This implies that farmers with more farms are better equipped to adapt in the face of climate variability and change than farmers with few farms. This is probably because farmers with many farms generally cultivate a larger portion of land with a diversity of crops and have more yields making them more food self-sufficient. Farmers with more farms are equally able to sell surplus food making them more financially stable and increasing their ability to buy better farm inputs and tools which goes a long way to enhance adaptation. Tabi et al. (2012) and Taruvinga et al. (2016) equally found that the number of farms positively influences farmers’ choice of adaptation measures implying that farmers with more farms adapt better than their counterparts with few farms.
Farm size (p<0.05) also positively affected smallholder farmers’ choice of adaptation measures. Smallholder farmers with a larger farm size therefore had a higher likelihood to implement adaption measures: agroforestry practices, on-farm practices and off-farm practices than smallholder farmers with smaller farm sizes. This is because farmers with a large farm size are more likely to cultivate more crops and have more yields than their counterparts with a small farm size. With high yields, farmers are more food self-sufficient permitting them to sell surplus food which enables them to buy better farm inputs and tools, thus enhancing adaptation. Farm size has equally been found by other studies to influence farmers’ choice of adaptation options (Deressa et al., 2008; Tabi et al., 2012; Kabir et al., 2015; Atinkut and Mebrat, 2016).
Access to weather information (p<0.05, p<0.01, p<0.10) equally influenced smallholder farmers’ choice of adaptation measures. Smallholder farmers with better access to weather information were more likely to implement agroforestry practices and on-farm practices in particular. This is because farmers having access to weather information are more exposed to the latest innovations in farming techniques and technologies. They are equally informed in advance of extreme weather events about to unfold which helps them to take action before the event actually occurs. Several studies conducted in sub-Saharan Africa have equally demonstrated that access to weather information plays a positive role in determining smallholder farmers’ choice of adaptation measures (Gbetibouo, 2009; Temesgen et al., 2014; Elia et al., 2015; Atinkut and Mebrat, 2016).
Household size though not statistically significant (p>0.10), negatively influenced choice of adaptation measures. Many studies conducted across Africa and the tropics show that household size has a positive influence on adaptation implying that the larger the household, the greater the likelihood to adapt in the face of climate variability and change. The reason for this is that a larger household size is attributable to more family labour which permits the cultivation of a larger portion of land thereby increasing yields and in essence the food self-sufficiency of the household (Deressa et al., 2008). However, in this study, it was found that the larger the household, the lesser the degree to adapt. This is probably due to the existence of an essentially dependent population (very young or very old) in the households. Another reason could be that, most household members in the study area are not taking active part in farming activities.
Annual family income though not equally statistically significant (p>0.10), positively influenced choice of adaptation measures. This is because farmers with more income are able to buy better farm inputs and tools which permit them to adapt in the face of extreme weather events. They are also able to buy food in case of food shortages.
Overall, the model was statistically significant, Likelihood Ratio c2 (6, n = 120) = 139.83, p<0.001. The likelihood ratio statistics from the MNL model therefore indicated that c2 statistics was highly significant (c2 = 139.83, p<0.001) showing that the model has a strong explanatory power. The model explained 73.5% (Nagelkerke R2) of the variance in farmers’ choice of adaptation options. Pseudo R2 (0.735) therefore shows that the weighted combination of predictor variables was jointly significant in explaining smallholder farmers’ choice of adaptation options.
However, it must be said that the parameter estimates of the MNL model (Table 5) do not provide the actual magnitude of change. Rather, they only provide the direction of the effect of the explanatory variables on the dependent variable. Therefore, to determine the magnitude of change, the marginal effects from the MNL model need to be run which has not been done in this study. Several studies have come out with the marginal effects of the MNL in order to determine the actual magnitude of the change in the dependent variable that is caused by a change in the explanatory variables (Deressa et al., 2008; Temesgen et al., 2014).
The Kruskal-Wallis test (H-test) which was run to see if there was a significant variation in smallholder farmers’ adaptation measures across the four villages studied showed that adaptation measures did not vary significantly across the four villages [c2 (3, n=120) = 3.946, p>0.10]. Therefore, smallholder farmer across the four villages implement similar adaptation measures categorized as agroforestry practices, on-farm practices, off-farm practices and “No adaptation”.
Effectiveness of the most prevalent adaptation measure implemented by smallholder farmers in reducing vulnerability
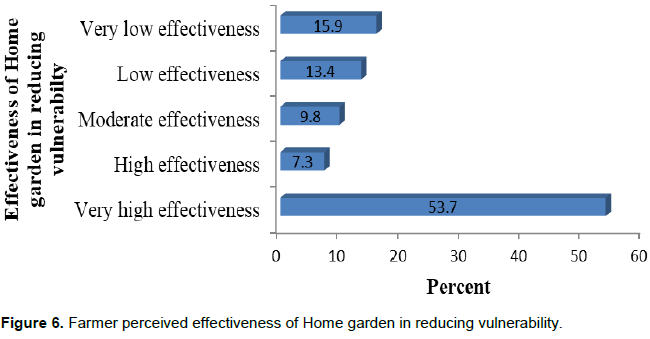
Analysis of data collected through household survey revealed that the most prevalent adaptation option in the study area was the home garden which was adopted by 82 out of the 120 smallholder farmers interviewed giving a percentage score of 68.3. Out of the 82 smallholder farmers who take to home garden as an adaptation measure, 44 of these respondents rate home garden to have a very high level of effectiveness in reducing vulnerability to climate variability and change giving a percentage score of 53.7%. Meanwhile 7.3% (6 smallholder farmers) of those who take to home garden rate it to have a high level of effectiveness. Equally, 9.8% (8 farmers) rate home garden to have a moderate effectiveness in reducing vulnerability to extreme climatic events. However, 13.4% (11 respondents) and 15.9% (13 respondents) rate home garden to have a low and very low level of effectiveness respectively (Figure 6).
Home gardens have equally been proven by various studies to be a prevalent adaptation measure amongst smallholder farmers with a high level of effectiveness in reducing smallholder farmers’ vulnerability to the nefarious effects of climate variability and change (Bishaw et al., 2013; Mbow et al., 2013a, b; Kabir et al., 2015; Lasco et al., 2015). Following these studies, the immediate area around the homestead generally offers numerous ecosystem services (provisioning, regulating, cultural and support services) like increased availability of water, better soil fertility due to organic waste inputs, and easier protection of the crop against animals thereby leading to increased production of food, fibre, medicines and many other products and services.
CONCLUSION AND RECOMMENDATIONS
This study found out that smallholder farmers have a peculiar way of perceiving climate variability and change (CVC) and adapting to its nefarious effects. A thorough review of literature showed a dearth of information pertaining to low cost, pro-poor and environmentally benign adaptation measures for smallholder farmers. Hence, based on the findings from this study, the following recommendations have been made geared towards increasing smallholder farmers’ awareness of CVC and enhancing the implementation of more low- cost, pro-poor and climate-smart adaptation measures.
First and foremost, the Ministry of Agriculture and Rural Development (MINADER), Ministry of Forestry and Wildlife (MINFOF), Ministry of Environment, Protection of Nature and Sustainable Development (MINEPDED) and their decentralized institutions and delegations need to encourage and support the putting in place of agroforestry practices owing to the pro-poor and environmentally benign nature of this practice when compared with other adaptive measures.
Moreover, the government and NGOs need to provide more institutional support in order to beef-up smallholder farmers’ resilience in the face of extreme climate events.
Equally smallholder farmers on their part need to undertake more environmentally friendly agricultural practices (like agroforestry) which are sustainable and at the same time guarantee adequate agricultural productivity.
Last but not the least, local authorities, government agencies, extension officers, Non-Governmental Organizations, policy makers, scientists and research institutions need to accompany smallholder farmers as they strive to adapt to climate variability and change.
CONFLICT OF INTERESTS
The authors have not declared any conflict of interests.
ACKNOWLEDGEMENTS
The authors are highly indebted to the Faculty of Agronomy and Agricultural Sciences of the University of Dschang, Dschang, Cameroon for providing moral and material assistance during this study.
REFERENCES
|
Awazi NP, Tchamba MN (2018). Determinants of small-scale farmers' adaptation decision to climate variability and change in the NorthWest Region of Cameroon. African Journal of Agricultural Research 13(12):534-543. |
|
|
Aggarwal VRK, Mahajan PK, Negi YS, Bhardwaj SK (2015). Trend Analysis of Weather Parameters and People Perception in Kullu District of Western Himalayan Region. Environment and Ecology Research 3(1):24-33. |
|
|
Atinkut B, Mebrat A (2016). Determinants of farmers' choice of adaptation to climate variability in Dera Woreda, South Gondar Zone, Ethiopia, Environmental System Research 5:6. |
|
|
Bishaw B, Neufeldt H, Mowo J, Abdelkadir A, Muriuki J, Dalle G, Assefa T, Guillozet K, Kassa H, Dawson IK, Luedeling E, Mbow C (2013). Farmers' strategies for adapting to and mitigating climate variability and change through agroforestry in Ethiopia and Kenya, edited by Caryn M. Davis, Bryan Bernart, and Aleksandra Dmitriev. Forestry Communications Group, Oregon State University, Corvallis, Oregon. |
|
|
Cameroun Vision 2015, Document de Travail (2009). Ministère de l'Economie, de la Planification et de l'Amenagement Du Territoire, Secretariat General, Division de la Prospective et de la Planification Strategique, P. 56. |
|
|
Cline WR (2007). Global Warming and Agriculture: Impact Estimates by Country. Center for Global Development, Washington, DC. |
|
|
Cooper P (2004). Coping with Climatic Variability and adapting to Climate Change: Rural water management in dry land areas, Discussion Paper, IDRC, London. |
|
|
Cooper PJM, Dimes J, Rao, KPC, Shapiro B, Shiferaw B, Twomlow S (2008). Coping better with Current Climatic Variability in the Rain-fed Farming Systems of Sub-Saharan Africa: An Essential First Step in Adapting to Future Climate Change? Agriculture Ecosystems & Environment 126:24-35. |
|
|
Divisional Delegation of Agriculture and Rural Development (DDARD) and Sub-Divisional Delegations of Agriculture and Rural Development (SDDARD) (2015). Agricultural statistics of the Divisional and Sub-Divisional Delegations of Agriculture and Rural Development for Momo and Mbengwi respectively, monthly and annual field reports. |
|
|
De Wit S (2011). An ethnography of the encounter of global and local climate change discourses in the Bamenda Grassfields, Cameroon; global warning. Research Master Thesis in African Studies, African Studies Centre (ASC), Leiden University. |
|
|
Deressa T, Hassan RM, Alemu T, Yesuf M, Ringler C (2008). Analyzing the Determinants of Farmers' Choice of Adaptation Methods and Perceptions of Climate Change in the Nile Basin of Ethiopia. IFPRI Discussion Paper 00798. International Food Policy Research Institute, Washington D.C, 26 p. |
|
|
Deresa TT, Hassan RM, Ringler C, Alemu T, Yesuf M (2009). Determinants of Farmers' Choice of Adaptation Methods to Climate Change in the Nile Basin of Ethiopia. Global Environmental Change 19:248-255. |
|
|
Elia E, Mutula S, Stilwell C (2015). Dissemination and Use of Information on Climate Change and Variability: A Case Study of Farmers in Maluga and Chibela Villages in Semi-Arid Central Tanzania. Open Journal Systems 33:3 |
|
|
Feleke HG (2015). Assessing weather forecasting needs of smallholder farmers for climate change adaptation in the Central Rift Valley of Ethiopia. Earth Science and Climatic Change 6:10. |
|
|
Food and Agricultural Organization (FAO) (2016). Climate change and food security: risks and responses. |
|
|
Gbetibouo AG (2009). Understanding Farmers' Perceptions and Adaptations to Climate Change and Variability: The Case of the Limpopo Basin, South Africa. IFPRI Discussion Paper No. 00849. International Food Policy Research Institute, Washington, D.C 36pp. |
|
|
Growth and Employment Strategy Paper (GESP) (2009). Cameroon's Growth and Employment Strategy Paper: Reference Framework for Government Action over the Period 2010-2020. |
|
|
Greene HW (2003). Econometric Analysis. 5th Edition, Pearson Education, Inc., Upper Saddle River, New Jersey, USA; 2003. |
|
|
Hadgu G, Tesfaye K, Mamo G, Kassa B. (2015). Farmers' climate change adaptation options and their determinants in the Tigray Region, Northern Ethiopia. African Journal of Agricultural Research 10(9):956-964 |
|
|
Intergovernmental Panel on Climate Change (IPCC) (2001). Climate Change 2001: Impacts, Adaptation and Vulnerability: A Report of the Working Group II of the Intergovernmental Panel on Climate Change. Cambridge,United Kingdom. |
|
|
Intergovernmental Panel on Climate Change (IPCC) (2007). Climate change 2007: Impacts, Adaptation and Vulnerability. Contribution of Working Group II to the Fourth Assessment Report of the Intergovernmental Panel on Climate Change (IPCC), Parry ML, Canziani OF, Palutikof JP, van der Linden PJ, Hanson CE (eds), Cambridge University Press, Cambridge, United Kingdom pp. 7-22. |
|
|
Kabir KH, Billah MM, Sarker MA, Miah MAM (2015). Adaptation of farming practices by smallholder farmers in response to climate change. Journal of Agricultural Extension and Rural Development 7(2):33-40. |
|
|
Kimengsi JN, Tosam JN (2013). Climate Variability and Cocoa Production in Meme Division of Cameroon: Agricultural Development Policy options. Greener Journal of Agricultural Sciences 3(8):606-617. |
|
|
Kimengsi JN, Gur AS, Sunjo TE, Awambeng AE (2015). The Implications of Climate Variability on Market Gardening in Santa Sub-Division, North West Region of Cameroon. Environment and Natural Resources Research 5:2. |
|
|
Kreft S, Eckstein D, Dorsch L, Fischer L (2014). Global climate risk index 2015: who suffers most from extreme weather events? weather-related loss events in 2013 and 1994 to 2013. |
|
|
Lasco RD, Espaldon MLO, Habito CMD (2015). Smallholder farmers' perceptions of climate change and the roles of trees and agroforestry in climate risk adaptation: evidence from Bohol, Philippines, Agroforestry Systems. |
|
|
Lin BB (2007). Agroforestry management as an adaptive strategy against potential microclimate extremes in coffee agriculture. Agricultural and Forest Meteorology 144:85-94. |
|
|
Mbengwi Council Development Plan Report (2012). Drawn up with the Technical and Financial Support from the National Community Driven Development Program (PNDP), |
|
|
Mbow C, Smith P, Skole D, Duguma L, Bustamante M (2013a). Achieving mitigation and adaptation to climate change through sustainable agroforestry practices in Africa, Current Opinion in Environmental Sustainability 6:8-14. |
|
|
Mbow C, Noordwijk MV, Luedeling E, Neufeldt H, Minang PA, Kowero G (2013b). Agroforestry solutions to address food security and climate change challenges in Africa. Current Opinion in Environmental Sustainability 6:61-67. |
|
|
Mersha AA, Laerhoven FV (2016). A gender approach to understanding the differentiated impact of barriers to adaptation: responses to climate change in rural Ethiopia. Regional Environmental Change |
|
|
Molua EL (2006). Climate trends in Cameroon: Implications for agricultural management. Climate Research 30:255-262. |
|
|
Molua EL, Lambi CM (2007). The Economic Impact of Climate Change on Agriculture in Cameroon. Policy Research Working Paper 4364. The World Bank Development Research Group Sustainable Rural and Urban Development Team 33 p. |
|
|
Molua EL (2008).Turning up the heat on African agriculture: The impact of climate change on Cameroon's agriculture. African Journal of Agricultural and Resource Economics 2(1):20. |
|
|
Nguyen Q, Hoang MH, Öborn I, van Noordwijk M (2012). Multipurpose agroforestry as a climate change resiliency option for farmers: an example of local adaptation in Vietnam. Climatic Change 117:241-257. |
|
|
Norrington-Davies G (2011). Climate Change Financing and Aid Effectiveness, Cameroon Case Study. |
|
|
Plan National d'Adaptation au Changement Climatique (PNACC) (2015). Rapport de l'Atelier de revue et de finalisation du Plan National d'Adaptation au Changement Climatique (PNACC) du Cameroun, Région du Sud, 20 au 22 mai 2015. |
|
|
Sarr B, Atta S, Ly M, Salack S, Ourback T, Subsol S, George DA (2015). Adaptating to climate variability and change in smallholder farming communities: A case study from Burkina Faso, Chad and Niger (CVCADAPT). Journal of Agricultural Extension and Rural Development 7(1):16-27. |
|
|
Somah TP (2013). Climatic Change Impacts on Subsistence Agriculture in the Sudano-Sahel Zone of Cameroon- Constraints and Opportunities for Adaptation: Brandenburg University of Technology Cottbus; Ph.D. Thesis, published |
|
|
Sunjo ET, Kometa SS, Amawa S G (2012). The Implications of Rainfall Variability on Cattle and Milk Production in Jakiri Sub-Division, North West Region, Cameroon. Journal of Agricultural Science 4(10). |
|
|
Tabi FO, Adiku SGK, Kwadwo O, Nhamo N, Omoko M, Atika E, Mayebi A (2012). Perceptions of rain-fed lowland rice farmers on climate change, their vulnerability, and adaptation strategies in the Volta Region of Ghana, Technologies and Innovations for Development, |
|
|
Temesgen D,Yehualashet H, Rajan DS (2014). Climate change adaptation of smallholder farmers in South Eastern Ethiopia. Journal of Agricultural Extension and Rural Development 6(11):354-366. |
|
|
Tingem M, Rivington M, Azam ASN, Colls JJ (2007). Assessment of the ClimGen stochastic weather generator at Cameroon sites. Journal of Environmental Science and Technology 1:86-92. |
|
|
Tingem M, Rivington M, Bellocchi G, Colls J (2009). Crop yield model validation for Cameroon. Theoret. Appl. Climatol. 96(3-4):275-280. |
|
|
Tingem M, Rivington M, Azam-Ali SN, Colls JJ (2008a). Climate variability and maize production in Cameroon: simulating the effects of extreme dry and wet years. Singapore Journal of Tropical Geography in press. |
|
|
Tingem M, Rivington M, Bellocchi G, Azam-Ali SN, Colls J (2008b). Effects of climate change on crop production in Cameroon. Climate Research 36:65-77. |
|
|
Tingem M, Rivington M, Bellocchi G (2009). Adaptation assessments for crop production in response to climate change in Cameroon. Agronomy for Sustainable Development, Springer Verlag (Germany) 29(2):247-256. |
|
|
UNFCCCs Conference of the Parties Twenty-first session (COP21) Paris, 30 November to 11 December 2015. Adoption of the Paris Agreement, Draft decision -/CP.21, 12 December 2015. |
|
|
United Nations Sustainable Development Summit (2015). Resolution adopted by the General Assembly on 25 September 2015: Transforming our world: the 2030 Agenda for Sustainable Development A/RES/70/1. |
|
|
Witt R, Waibel H (2009). Climate Risk and Farming Systems in Rural Cameroon, Leibniz Universität Hannover, Königsworther Platz 1, 30167 Hannover, Germany, Discussion Paper No. 423. |
|
|
World Bank (2011). World Development Indicators Database. |
|
|
World Bank (2013). Turn Down the Heat: Climate Extremes, Regional Impacts, and the Case for Resilience. A report for the World Bank by the Potsdam Institute for Climate Impact Research and Climate Analytics. Washington, DC:World Bank. License: Creative Commons Attribution—NonCommercial–NoDerivatives3.0 Unported license (CC BY-NC-ND 3.0). |
|
|
World Meteorological Organization (WMO) (2016). 2015 is hottest year on record, Press Release Number: 2, Geneva, 25 January 2016. |
|
Copyright © 2024 Author(s) retain the copyright of this article.
This article is published under the terms of the Creative Commons Attribution License 4.0


