ABSTRACT
This study aimed to develop and evaluate the Artificial Neural Networks (ANNs) settings to differentiate and estimate areas of soybean by employing the vegetation index with and without time series. Study area comprises the state of Paraná, South Brazil. The images used to process the ANN were Normalized Difference Vegetation Index (NDVI), Perpendicular Vegetation Index (PVI) and Enhanced Vegetation Index (EVI) indices, including Julian day 017 and Crop Enhanced Index (CEI), which were derived from time series MOD13Q1 product from MODIS sensor Terra satellite. The samples were demarcated into polygon soybean, non-soybean and others (mainly streams). ANN architecture was performed by the module classification employing Multi-layer Perceptron (MLP) artificial neural networks trained by using back propagation algorithm. CEI as a vegetation index with timed series discrimination of soybean areas, pixels with higher than 0.28 rates, proved to be equivalent to ANN to separate soybean areas. Kappa parameter of 0.40 and 0.34 for CEI index and ANN, respectively, it was found in mapped areas. The major and unique contribution of the current study for remote sensing in agriculture was to show that vegetation indices coupled with artificial neural network techniques may improve the results of crop mapping, especially in soybean areas.
Key words: Back propagation neural network, remote sensing, perpendicular vegetation index (PVI), enhanced vegetation index (EVI), crop enhancement index (CEI), time-series.
It is important and necessary to monitor crops and other agricultural activities in the country, mainly because some cultivated areas are carried out by government agencies in subjective forms. In recent decades the emergence of remote sensing, particularly the orbital level, made it possible to monitor and track the spatial and temporal evolution changes in the Earth's surface and began objective studied (especially with the use of vegetation indices). This was done with expectations on the remote sensing, and to meet the new methodological challenges for interpretation of low spatial resolution images. Also, in Brazil, there is no mapping for the soybean crop, only presentation of subjective numbers of agricultural areas.
Monitoring the Earth's surface and vegetation dynamics by remote sensing techniques is highly important for agriculture. In fact, crop scientists have employed these techniques mainly to assess plant biophysical parameters (Bsaibes et al., 2009; Duveiller et al., 2011) and acreage estimates (Pan et al., 2012).
The systematic mapping of agricultural crops in Brazil is a challenge, mainly due to the large size of the country and wide variety of crops. The systematization of soybean crop is highly relevant to the country due to its economic importance.
Artificial neural networks (ANNs) are computational techniques that use mathematical models to assess several issues by simulating the neuron organization of the human brain. They are commonly referred to as artificial intelligence (AI) and their principle factor is basedon taking decisions through learning techniques and acquiring knowledge experience indicated by a user, that is, learning, making mistakes and going on to new discoveries. As the nervous system is composed of several neurons, ANNs is also formed by units of small modules which simulate the neuron mechanism (Haykin, 2008).
Weights in ANNs depend on real inputs and on the internal state of the network so that they may produce models for learning patterns. This allows the use of algorithms in economic and statistical analysis. Since multilayer network is one of the most used, it will be applied in the current study for forecasting exertion.
Artificial neural networks classifiers have been successfully employed to solve several issues in agriculture, such as soybean flowering and physiological maturity (Elizondo et al., 1994), soybean prediction yield (Kaul et al., 2005), maize grain quality (Liao et al., 1993), classification of grains as seeds (Luo et al., 1999), and maize yield (Liu et al., 2001).
This study was carried out aiming to develop and evaluate ANNs settings to differentiate and estimate areas of soybean through a vegetation index, with and without time series.
Study area
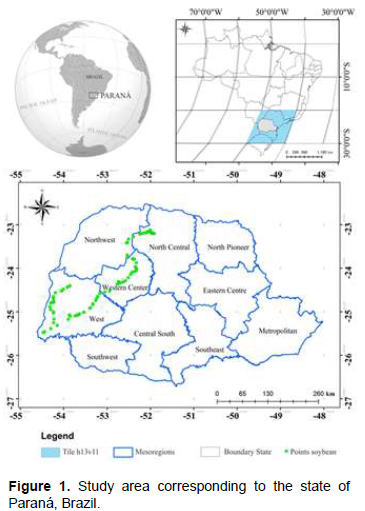
The study area comprises the state of Paraná, southern Brazil, between 22º29' and 26°43' S and between 48º20' and 54°38' W (Figure 1). The average altitude ranges between the highest, above 600 m (52% of the state´s landmass) and the lowest, below 300 m (3% of the state´s landmass). According to Köppen classification, the climate is characterized by three predominant types: Cfa (subtropical with well distributed rainfall during the year and hot summers); Cfb (subtropical with well distributed rainfall during the year and mild summers); Cwa (subtropical with hot summers and dry winters).
An early aspect that should be taken into account in the remote-mapping of soybean is its phenology as a progressive process. Therefore, the analysis of soybean cultivation involves the use of a time series of satellite images. To cope with this situation, the acquisition of images has been selected to cover the study area in different periods of the crop and to highlight the soybean temporal dynamics, while allowing a better distinction from other land cover classes.
Data and equations of vegetation indices
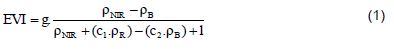
Values of Enhanced Vegetation Index, Equation 1 (EVI), MOD13Q1 product, tile h13v11, collection 5.0, composite by MODIS images of 16 days (Huete et al., 1997) from Terra satellite, with spatial resolution of 250 m, downloaded from USGS LP-DAAC, it were used. One of its most important features is displaying the same temporal resolution almost every day and producing images with 12-bit quantization in 36 spectral bands.
Wherein, , and - are red and blue, respectively, in the spectral reflectance near-infrared,; g - the gain factor (2.5); c1 and c2 - are the coefficients of correction for the atmospheric effects to red (6) blue (7.5), respectively; l - is the correction factor for soil interference.
EVI is an index designed to mitigate the effects of soil (adjusted by SAVI - Soil-adjusted Vegetation Index) and atmosphere (adjusted by ARVI - Atmospherically Resistant Vegetation Index) in vegetation mapping. Besides EVI, the study used subsequent analyses in images contained in MOD13Q1 product: Blue, red, near-infrared and Normalized Difference Vegetation Index - NDVI (Equation 2):
Where and are respectively the spectral reflectance in near-infrared and red.
All images, originally obtained in Hierarchical Data Format (HDF) and sinusoidal projection format; it was processed according to the development of automated batch routines. Consequently, data have been redesigned to coordinate Lat./Long., DATUM WGS-84 (World Geodetic System 1984) and automatically converted to GeoTIFF format. The corresponding time series dates used are shown in Table 1.
To calculate the Crop Enhancement Index (CEI), developed by Rizzi et al. (2009), the maximum and minimum EVI planting culture and vegetative growth were employed, respectively, and the corresponding dates in Table 1 were used.
The preference of these time intervals was based on the agricultural calendar of soybean in the state of Paraná, featuring top soil tillage (liming and fertilization), harvest and desiccation (late March) and the beginning of sowing (between October and November). CEI index was calculated from these values by Equation 3:
Where: MaxEVI = maximum EVI at maximum development of the crop; MinEVI = minimum value of EVI observed in pre-planting and/or emergency; S = coefficient of enhancement (102); g = gain factor (102).
The value of CEI index (Rizzi et al., 2009) varies between [-1] and [+1], which allows scanning large positive differences respectively between maximum and minimum EVI observed along the soybean crop period. High CEI values indicate, as reflectance pixel, a high probability of soybean. The index is treated individually with time series and exclusive use for pattern recognition of soybean. However, it was used in the ANNs preparing to verify their integrity in soybean contribution patterns. ANNs is therefore composed of indexes with and without time series.
Perpendicular Vegetation Index (PVI) was calculated (Equation 4) for MODIS image 017 Julian day to mitigate reflectance of soil. In fact, soil is present in soybean early stages, causing a spectral mixture. For PVI execution, regressions of soil line were performed by spectral bands of red and near-infrared, following Nanni and Demattê (2006).
Where a and b are the slope and intercept of the soil line, respectively, which feature band as the dependent variable.
The images used for ANNs processing were NDVI, PVI and EVI indices, both Julian day 017 and CEI index, derived from time series MOD13Q1 product from MODIS sensor Terra satellite. Julian day 017 was used because on that day the soybean fields of Paraná are at their maximum vegetative vigor, thus we could obtain their maximum reflectance.
Artificial Neural Networks (ANNs)
ANNs training comprised the methodology processes described by Andrade et al. (2013). The definition of samples and their spectral signatures, ANNs architecture and training definition, network application and the achievement of the classified map were thus performed. Samples were then defined: Soybean, non-soybean and other land uses. IDRISI Selva platform merely recognized two classes and presented an error in the final classification map.All ANNs process was performed in IDRISI Selva platform developed by the Graduate School of Geography, Clark University. The platform provides resources for environmental management and natural resources by employing time series or changes, decision analysis by multiple criteria and uncertain analysis. Three classifiers were implemented for the ANN module: Multi-layer perceptron (MLP), Self-organizing map (SOM) and Fuzzy ARTMAP.
The use of artificial neural networks in agriculture human vision for trial training assumes an important role. Visual selection in the form of polygons in creating swatch processes is an example of such judgments. Samples of training polygons are important because it has strong links with the final yield, that is, it works in the perception of identifying plots of agricultural areas, reflectance, and texture, among others.
Between 50 and 65 polygons of various sizes were defined and selected in this segment to provide better details of the areas where soybean was being cultivated. Samples in soybean polygons, non-soybean polygons and other uses (mainly watercourses) were defined for the process. Spectral thresholds of each image were then defined by the Makesig module, which consists of extracting spectral information from each image based on selected samples. With regards to the ANNs architecture, the classification module by artificial neural networks, type Multi-Layer Perceptron (MLP), it was performed. Output layer elements were defined by the number of classes to be demarcated in the image. In this case, they comprised three nodes with identified values in the making of the samples and processed by Makesig module. Certain tests were deployed for layer quantities, number of neurons per layer and activation function so that the best configuration of the architecture for soybean crop mapping could be identified.
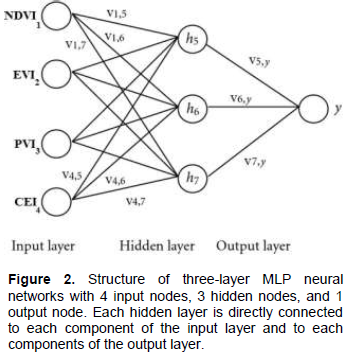
Artificial neural networks were trained by employing backpropagation algorithm (Haykin, 2008). Backpropagation refers to the method of calculating the sum gradient according to the function of the quadratic error related to weights for a feed-forward network. The latter is a simple but effective application to the chain rule of elementary calculus. It is therefore assumed that there are n classes, m neurons in the hidden layer and one neuron in the output layer, as shown in Figure 2.
Backpropagation learning algorithm is essentially a optimization method able to find the weight coefficients and thresholds for the neural networks and the given training set. The network should be constituted by neurons behavior described by Equation 5.
Where y is the non-linear output function, S is defined by Equation 6.
Where γ determines the curve steepness in the origin of coordinates. Input and output values are assumed to be in the range [0, 1]. In the following formulas, the parameter o denotes the output layer, h the hidden layer, and i, j the indexes. Index i catalogs output neurons and the index j their inputs. This means i-th neuron output of the hidden layer and means the weight connecting i-th neuron of the output layer and j-th neuron of the previous hidden layer.
Heuristic method was employed for this step by varying the training configuration of the following parameters: Learning rate, momentum rate, number of training samples (pixels) and repetitions. When the network is trained, the distinction of classes is undertaken and identified as soybean and non-soybean to generate the final classified map.
The performance of artificial neural networks settings were evaluated with Root Mean Square Error (RMSE), prediction accuracy and Standard Error of Prediction (SEP). Furthermore, the coefficient of correlation (r) between the predicted and outputs, coupled with the slope and intercept of the linear regression model, it was also employed. RMSE was calculated by Equation 7.
Where n is the number of observations; p is the number of parameters to be estimated; SSE and MSE are the sum of quadratic errors and mean square error, respectively.
Neurons between adjacent layers that define the neural networks structure (Figure 2) are not completely bonded because a specific entry (or all of them) affects each output.
For example, the first exit, that is h5 (V5, y), for the proposed neural networks is a function of four inputs, as shown in Equation 5. A hyperbolic sigmoid tangent transfer function with Equation 8 is applied to the hidden and output layers.
Experimental protocol, statistical analysis and field samples
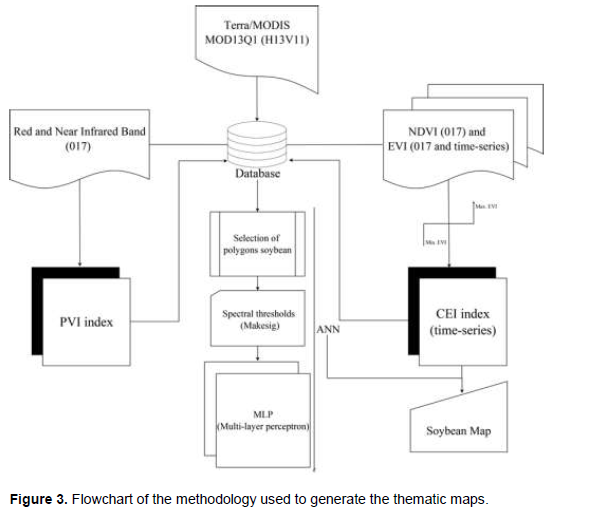
Having the images processed and applying the appropriate classifiers, thematic maps of soybean areas were generated. The complete process of placements and their respective processes are shown in Figure 3.
The evaluation of quality thematic maps, vegetation index (CEI) and artificial neural networks (ANNs) was achieved by using a completely independent set of sample points. This approach was adopted since all rating processes could be evaluated by such method.
A GPS device, Trimble GeoExplorer 2008 Series, it was used for an independent samples set. The state of Paraná was covered and coordinates containing soybean crops, totaling 172 sites, detailed by green points in Figure 1. Non-soybean sites were collected by a qualified expert through a visual interpretation of a time series from MODIS images (Freitas et al., 2011). The 346 points distributed throughout the area were generated randomly and independently. The size of this set of samples may be considered satisfactory according to Congalton and Green (2009).
The quality of the classification was assessed quantitatively by the coefficients of Overall Accuracy (OA) and Kappa index (κ) (Equations 9 and 10, respectively), both derived from the confusion matrix (Congalton and Green, 2009). Further, errors and accuracy from the point of view of producers and users were taken (Antunes et al., 2012; Johann et al., 2012). These measurements provided a better assessment of the final classification of soybean areas.
Where: κ = estimated Kappa; k = number of rows; = number of observations in row i and column i; = the sum of the matrix elements on its main diagonal; = total sum of observations for lines; = total sum of observations for columns ; N = total number of observations.
With the given rates and under the hypothesis of equality between two ratios arising accuracy of different classifications (κ1 = κ2), the statistical test was performed by Equations 11 to 13.
Finally, the estimated soybean area was compared with that provided by the Automatic Recovery System (SIDRA) of the Brazilian Institute of Geography and Statistics (IBGE), a parameter to check the mapping evaluation. This step could only be performed for the 2010/2011 harvest, since the agency has yet not published the soybean-sown areas for each municipality.
When analyzing the data obtained by the methods used in the estimates of soybean areas (CEI and ANN), we found that classifications were equal to Z test reference for the Kappa (κ) and Overall Accuracy (OA) parameters (Table 2). However, the classification by artificial neural networks (ANN) had a lower κ rate, probably caused by a user on neurons training, that is, in the selected polygons. The κ rate shows the conformity of the classification obtained.
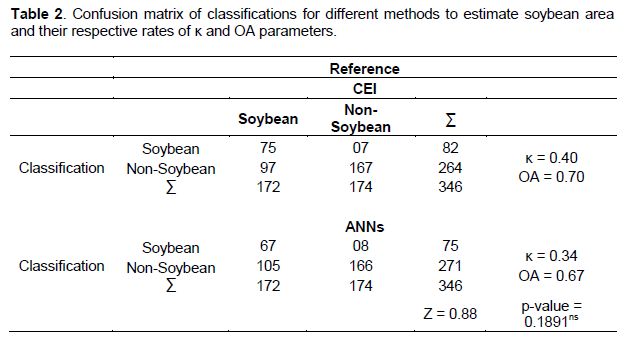
Kappa index has advantages over the Overall Accuracy parameter because it incorporates all the elements of the error matrix, objects classified correctly or not. Moreover, κ assesses thematic accuracy since it is more sensitive to changes caused by accuracy mistakes from users and producers and evaluates the spatial coincidence between two situations. Also, regarding the OA, accuracy score stretched to 70%. According to Foody (2002), an accuracy score index over 85% is desirable. Score rates for OA were lower than those considered desirable for CEI index and ANN.
CEI index was actually expected to be equal by Z test with regard to ANNs result because the index was part of the MLP´s input layer.
The κ, evaluating the agreement or disagreement between classifications, ranged between 0.34 (ANN) and 0.40 (CEI) (Table 2) and is of a reasonable quality (κ> 0.21 and 0.81) according to the classification described by Landis and Koch (1977). Therefore, thematic maps, generated for the soybean crops, mainly when CEI is employed, approached field reality. Rates were even more significant when compared with studies that used the same sensor, albeit with other methodologies. For instance, Lamparelli et al. (2008) obtained Kappa parameter between 0.60 and 0.80 when they estimated soybean crops with MODIS data.
Therefore, classifiers evaluation showed that those based on pixel by pixel structure, for example, ANNs which requires sample acquisition by the user, it have more refined and highly accurate results. Further, combination with CEI improved results since it took into account pixel values in the classification. In other words, assigned class depends on the observed value of the pixel.
The error from producer’s and user’s point of view was used to measure the accuracy of each category (soybean and non-soybean) (Table 3) through the analysis of errors inclusion and omission in ratings (Antunes et al., 2012). When producer’s and user’s data errors (inclusion and omission, respectively) were analyzed, it was underpinned that the lowest value for the inclusion error class for soybeans was obtained by CEI index, with a 0.56 error, whereas the error of omission was 0.08 for the same class. This sums up to the fact that 56% of areas classified as 0.92% soybean crop area actually belonged to that class (Table 3). Rudorff et al. (2007), estimating soybean with MODIS in the state of Rio Grande do Sul (Brazil), obtained 76.17% parameters from Overall Accuracy and 0.503 for Kappa. Pax-Lenney and Woodcock (1997) considered the above a good performance. Thus, producer’s error occurs when an object is included in the class to which it does not belong and user’s error occurs when an object is deleted from the class it belongs to (Johann et al., 2012).

On the other hand, regarding to the non-soybean class (Table 3), the value obtained in the producer’s error by CEI and ANN, 0.04 and 0.05 respectively, should be
enhanced. The same may be said with regard to user’s accuracy since the value reached 0.39, with the consequent underestimation of soybean ratings and an increase in non-soybean estimates.
Similar results for both ratings were probably due to the fact that, different from other classifiers, techniques took into account other attributes rather than the mere spectral response of each pixel. Different attributes are taken into account within the space in which targets are inserted from the sampling process. However, in the non-soybean ratings, a small difference was detected between CEI´s and ANN´s errors since the number of spectral mixing was somewhat generalized for the classifiers.
Determining the number of neurons is the most fundamental problem in neural networks learning, since there is no general rule in the literature that accurately pinpoints the precise ANNs number of neurons to solve a given problem (Hippert and Taylor, 2010). In addition, there are practically no scientific researchers employing ANNs for soybean area studies. Table 4 shows the settings used for testing in an attempt to get a network that would best classify images and highlight the architecture with the best results. ANNs implementation featured a processing time ranging between 10 and 15 hours.
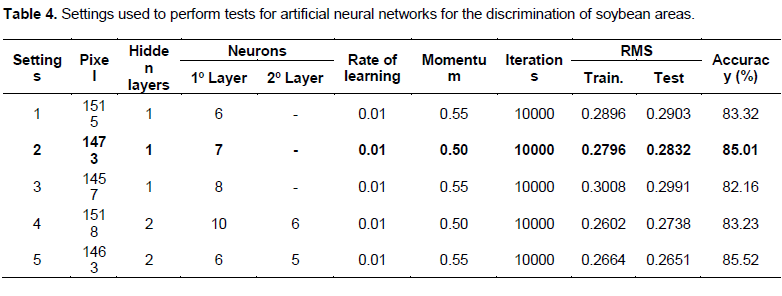
Table 4 shows that the neural networks had a better performance with one hidden layer, with the variation in the number of neurons in layer and in the pixel set. Intermediate layers presuppose error estimates which, if in great amounts, lead to network convergence problems. Results obtained in greater areas of soybean revealed that an increase in the number of pixels of the training and test set, the network produced better results with a number of neurons of the first layer, varying between 6 and 10. In smaller areas, the network with the best results also had a small number of neurons in the intermediate layer. The greater the number of neurons in the layer, the greater the complexity of the network and the greater its range in terms of possible solutions (Hippert and Taylor, 2010).
Kappa and Overall Accuracy rates obtained by ANNs classification may have been impaired by environmental factors that affect the image’s spectral pattern, such as variations in the phenological stage, vegetative vigor, plant spacing and nearby crops. In other words, due to mean spatial resolution of MODIS/Terra images (that is, 250 m).
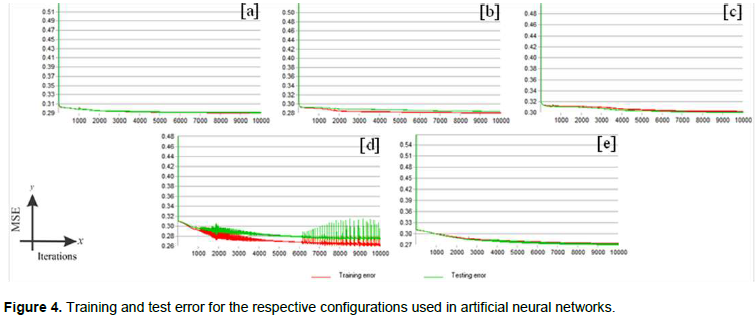
Figure 4 illustrates the training progress of an MLP in training and test error. It shows the number of learned patterns versus formation of iterations. The total number of learned patterns was 10,000. In the case of setting 2 learning (Table 4), the parameters were much more conservative as to the formation of training and error tests (Figure 4b). In the case of less than 10,000 times of training iteration, the RMSE for test data was reduced to less than 0.50 and stabilized at this level (Table 4 and Figure 4).
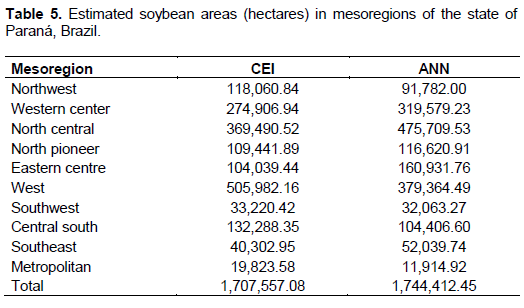
Quantified results in hectares for soybean crop were generated for each municipality under analysis. Table 5 limits itself to the mesoregions in the state of Paraná; the limitations of current paper make it unfeasible to list the great number of municipalities (399 in total). When compared with official Brazilian data (SIDRA/IBGE), the two techniques (ANNs and CEI) had a performance than lower expected (Figure 8). In the Z test analysis, all techniques used showed that values did not present a 95% probability statistical significance and equality when compared to κ parameters generated by the ratings. This result demonstrates that Table 5 data underestimated the true ground conditions.

Soybean areas estimated in Table 5 showed similarity between CEI and ANN classifications but varied on the underestimation of indexes predicted by official data (SIDRA/IBGE). The same occurred with estimates studies on soybean areas in the state of Maranhão, Brazil, where Silva Junior et al. (2014), using the CEI index, obtained underestimates when comparing government data. Convergence of official Brazilian data with those estimated in current study had been expected (Figure 7) since current analysis has been based on objective methods (statistical) with the use of satellite images, with a spatial resolution of 250 m, contrary to those by
SIDRA/IBGE, which have been obtained subjectively by interviews with producers, meetings with technicians to check sampled planting intentions and amount of inputs sold for the harvest.
However, objective methods also bring uncertainties. They are only confirmed by reliable reality-collected data. Overestimation or underestimation with regard to official data has been proven in several scientific studies by remote sensing techniques in the estimation of agricultural areas (Xiao et al., 2002; Peng and Gitelson, 2012; Wu and Li, 2012). Thus, it may be perceived that the reliability of a given mapping obtained by satellite images is greater when it comes to higher spatial resolution, and thus with increasing details. However, reported results have a great potential for estimating agricultural areas cultivated with soybean, especially in very vast areas. This is a highly positive fact since MODIS sensor data images are not only free (http://modis.gsfc.nasa.gov/), but feature an area of 2,330 km as width, circular orbit, near-polar, helio-synchronous, with a temporal resolution of 1 to 2 days, so that the probability of receiving images free of clouds is increased and favors the mapping of summer crops.
The relationship of artificial neural networks in agriculture, mainly soybean crop, and the mapping of agricultural areas are still scarce, although their use by several researchers can be highlighted. Andrade et al. (2013) identified coffee areas in the state of Minas Gerais, Brazil, where TM/Landsat-5 images were used with ANN-type Multi-layer Perceptron (MLP). The same authors found the method satisfactory with automatic mapping of ANNs. The evaluation of the efficiency of artificial neural networks for classifying land use can be confirmed in a study by Chagas et al. (2009) on levels of pasture degradation obtained by remote sensing imagery.
Figure 5 shows the map of soybean plantations classified by ANN and CEI. There is a similarity between the estimated spatial distribution of soybean areas in CEI and ANN classification. Since classifiers provided underestimation (Table 5), they presented more intensely the colored areas as potential soybean plantation areas. The methodological techniques demonstrated and evaluated relevant potential use for soybean mapping. It may thus supplement state and federal agencies in official surveys of the crop, detailing data for each municipality and furnishing agricultural statistics with even greater rapidity.
In addition to quantitative analysis, a map of disagreements was also produced (Figure 6). It is a thematic map containing pixels which ANNs classifiers labeled the soybean class differently from that by CEI index. The map of disagreement submitted a total of 147.42 pixels, representing 36,855.37 ha, with pixels featuring divergent classification.
Although the Perpendicular Vegetation Index (PVI) lies at ANNs entrance, with decreasing soil effect in its calculation, a spectral mixture of pixels may still be perceived. Figure 6 shows intense divergences in the southern region of the state and in the coastal areas due to the inherent spectral mixture of these pixels and to the
reflection of sand that makes the CEI assigned as soybean for the high reflectance pixels.
The mapping behavior of soybean areas of the state of Paraná (Brazil) conducted by CEI index and ANN is shown in Figure 6. Similarity between the areas mapped by two methods and their distribution throughout the state may be perceived. CEI map (yellow) reported up to 69,669.82 ha in a single municipality, whereas ANNs (black) features a maximum area of 61,000.00 ha of soybean plantations. The advantage of using ANNs with input PVI for the elimination of soil (soil line (Nanni and Demattê, 2006)) in its index should be enhanced. In fact, the coast areas (metropolitan mesoregion) are totally devoid of any soybean plantations. Such confusion occurred because of CEI index and its use of EVI in its calculation.
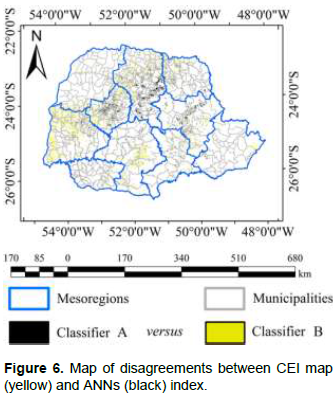
Figure 7 shows municipal areas obtained by CEI and ANNs (Figure 7ª and b, respectively) and their relationship with the data obtained by Brazilian official agencies (Brazilian Institute of Geography and Statistics - IBGE). Although ANNs showed inferiority in Kappa values (Table 2) when compared to CEI index, the rates in hectares per municipality had a higher consistency with the data from official organ (R2 = 0.6266).
This study describes the mapping of soybean areas with artificial neural networks with the implementation of vegetation indices. ANNs provides a new setting method with the aid of an experienced analyst to automate the mapping and the discrimination of soybean plantations in Brazil. The number of input variables of the network is not limited to training, just by changing ANNs configuration. We investigated four widely used vegetation indices, including NDVI, EVI, PVI and CEI, in the soybean area estimation study. The Crop Enhancement Index (CEI) is a technique of vegetation index with time series for discrimination of soybean areas (pixels with values greater than 0.28), it showed equality with ANNs performance in distinguishing the soybean areas. The criterion for ANNs setting featuring superiority in soybean mapping extended the limit of 10,000 iterations or the root mean square (RMS) of 0.0001 to stop the number of iterations of the backpropagation training algorithm with RMS 0.2796 for the training data and 0.2832 for test data. This current study approves MODIS images for the analysis of soybean areas in Brazil since the difficulty is to obtain pictures totally free of clouds. The major and unique contribution of this study for remote sensing in agriculture was to show that vegetation indices combined with the techniques of artificial neural networks could improve the results of crop mapping, especially regarding the soybean plantations. Also, we verified the effectiveness of mapping as a source of information for government agency for real statistical knowledge of the agricultural areas.
The authors have not declared any conflict of interests.
REFERENCES
|
Andrade LN, Vieira TGC, Lacerda WS, Volpato MML, Davis Junior CA(2013). Application of Artificial Neural Network in the Classification of Coffee Areas in Machado, Minas Gerais State. Coffee Sci. 8(1):78-90.
|
|
|
|
Antunes JFG, Mercante E, Esquerdo JCDM, Lamparelli RA, Rocha JV (2012). Soybean crop area estimation through image classification normalized by the error matrix. Pesqui. Agropecu. Bras. 47(9):1288-1294.
Crossref
|
|
|
|
|
Bsaibes A, Courault D, Baret F, Weiss M, Olioso A, Jacob F, Hagolle O, Marloie O, Bertrand N, Desfond V, Kzemipour F (2009). Albedo and LAI estimates from FORMOSAT-2 data for crop monitoring. Remote Sens. Environ. 113(4):716-729.
Crossref
|
|
|
|
|
Chagas CS, Vieira CAO, Fernandes Filho EI, Carvalho Júnior W (2009). Use of artificial neural networks in the classification of degradation levels of pastures. Rev. Bras. Eng. Agríc. Amb. 13(3):319-327.
|
|
|
|
|
Congalton RG, Green K (2009). Assessing the accuracy of remotely sensed data: Principles and practices. 2nd ed. Boca Raton, FL, USA: CRC Press.; 183 p.
|
|
|
|
|
Duveiller G, Baret F, Defourny P (2011). Crop specific green area index retrieval from MODIS data at regional scale by controlling pixel-target adequacy. Remote Sens. Environ. 115(10):2686-2701.
Crossref
|
|
|
|
|
Elizondo DA, McClendon RW, Hoogenboom G (1994). Neural network models for predicting flowering and physiological maturity of soybean. Trans. ASABE 37(3):981-988.
Crossref
|
|
|
|
|
Foody GM (2002). Status of land cover classification accuracy assessment. Remote Sens. Environ. 80(1):185-201.
Crossref
|
|
|
|
|
Freitas RM, Arai E, Adami M, Souza AF, Sato FY, Shimabukuro YE, Rosa RR, Anderson LO, Rudorff BFT (2011). Virtual laboratory of remote sensing time series: visualization of MODIS EVI2 data set over South Am. J. Comput. Interdisc. Sci. 2(1):57-68.
Crossref
|
|
|
|
|
Haykin S (2008). Redes Neurais: princípios e prática. Trad. Paulo Martins Engel. 2nd ed. Porto Alegre: Bookman; p. 893.
|
|
|
|
|
Hippert HS, Taylor JW (2010). An evaluation of Bayesian techniques for controlling model complexity and selecting inputs in a neural network for short-term load forecasting. Neural Net. 23(23):386-395.
Crossref
|
|
|
|
|
Huete AR, Liu HQ, Batchily K, Leeuwen WV (1997). A comparison of vegetation indices over a global set of TM images for EOS‑MODIS. Remote Sens. Environ. 59(3):440-451.
Crossref
|
|
|
|
|
Johann JA, Rocha JV, Lamparelli RAC, Duft DG (2012). Estimation of summer crop areas in the state of Paraná, Brazil, using multitemporal EVI/Modis images. Pesqui. Agropecu. Bras. 47(9):1295-1306.
Crossref
|
|
|
|
|
Kaul M, Hill RL, Walthall C (2005). Artificial neural networks for corn and soybean yield prediction. Agric. Syst. 85(1):1-18.
Crossref
|
|
|
|
|
Lamparelli RAC, Waste MOC, Marcante E (2008). Mapping of soybean (Glycine max (L.) Merr.) culture by MODIS/Terra and TM/Landsat 5: a comparative. Eng. Agríc. 28(2):334-344.
Crossref
|
|
|
|
|
Landis JR, Koch GG (1977). The measurement of observer agreement for categorical data. Biometrics 33(1)159‑174.
Crossref
|
|
|
|
|
Liao K, Paulsen MR, Reid JF, Ni BC, Bonifacio-Maghirang EP (1993). Corn kernel breakage classification by machine vision using a neural network classifier. Trans. ASAE 36(6):1949-1953.
Crossref
|
|
|
|
|
Liu J, Goering CE, Tian L (2001). Neural network for setting target corn yields. Trans. ASAE 44(3):705-713.
|
|
|
|
|
Luo XY, Jayas DS, Symons SJ (1999). Comparison of statistical and neural network methods for classification of cereal grains using machine vision. Trans. ASAE 42(2):413-419.
Crossref
|
|
|
|
|
Nanni MR, Demattê JAM (2006). Soil line behavior obtained by laboratorial spectroradiometry for different soil classes. Rev. Bras. Ciênc. Solo 30(6):1031-1038.
Crossref
|
|
|
|
|
Pan Y, Li L, Zhang J, Liang S, Zhu X, Sulla-Menashe D (2012). Winter wheat area estimation from MODIS-EVI time series data using the Crop Proportion Phenology Index. Remote Sens. Environ. 119(1):232-242.
Crossref
|
|
|
|
|
Pax-Lenney M, Woodcock CE (1997). The effect of spatial resolution on the ability to monitor the status of agricultural lands. Remote Sens. Environ. 61(2):210-220.
Crossref
|
|
|
|
|
Peng Y, Gitelson AA (2012). Remote estimation of gross primary productivity in soybean and maize based on total crop chlorophyll content. Remote Sens. Environ. 117(1):440-448.
Crossref
|
|
|
|
|
Rizzi R, Risso J, Epiphanio RDV, Rudorff BFT, Formaggio AR, Shimabukuro YE, Fernandes SL (2009). Estimativa da área de soja no Mato Grosso por meio de imagens MODIS. In Proceedings of the 14th Brazilian Remote Sensing Symposium, Natal, RN, Brazil, 25–30 April 2009; INPE: São José dos Campos, SP, Brazil, pp. 387-394.
|
|
|
|
|
Rudorff CM, Rizzi R, Rudorff BFT, Sugawara LM, Vieira CAO (2007). Spectral-temporal response surface of MODIS sensor images for soybean area classification in Rio Grande do Sul State. Ciênc. Rural 37(1):118-125.
Crossref
|
|
|
|
|
Silva Junior CA, Frank T, Rodrigues TCS (2014). Discrimination of soybean areas through images EVI/MODIS and analysis based on geo-object. Rev. Bras. Eng. Agríc. Amb. 18(1):44-53.
|
|
|
|
|
Wu B, Li Q (2012). Crop planting and type proportion method for crop acreage estimation of complex agricultural landscapes. Int. J. Appl. Earth Observ. Geoinf. 16(1):101-112.
Crossref
|
|
|
|
|
Xiao X, Boles S, Frolking S, Salas W, Moore B, Li C, He L, Zhao R (2002). Landscape-scale characterization of cropland in China using VEGETATION sensor data and Landsat TM imagery. Int. J. Remote Sens. 23(18):3579-3594.
Crossref
|
|