Full Length Research Paper

ABSTRACT
Drought stress is among the most important abiotic factors that contribute to the significant yield reduction of common bean (Phaseolus vulgaris L.). Due to unreliable and poor distribution of rainfall, drought tolerance has become the important train in common bean in bean growing areas. The objective of this study was to evaluate 16 common bean genotypes for drought tolerance under three moisture regimes and identify genotypes with specific traits that improved tolerance to drought that could be recommended for released and become useful parents in the breeding programs. The experiment was conducted in Maruku, Bukoba under screen- house. Based on the drought stress indices which includes drought tolerance index (DTI), Harvest Index (HI) SMC 162, DAB 602, SSIN 1128, DAB 378, DAB 362 and SMR 101 had performed better than other tested genotypes. Also, the results showed that genotypes DAB 582, SRC 59, DAB 602, SSIN 1240, SMC 24, SMR 101 and DAB 362 were drought tolerant with lower and high value of the DSI and YSI respectively. Therefore, the later genotypes can be used in the future breeding programs as the parent for drought tolerance and also can used as a new varieties by farmers.
Key words: Moisture stress, common bean, seed yield, drought.
INTRODUCTION
Common bean (Phaseolus vulgaris L.) is the main grain legume grown in Tanzania, where they are often intercropped with maize. Cultivation of beans can be seen in most areas of farming communities (Kilasi, 2012), with a great potential for improving human nutrition due to its high protein content (Manjeru et al., 2007), but the crop does not tolerate prolonged periods without rainfall, and to obtain a reliable yield in the drier areas a supplementary irrigation is required (Hillocks et al., 2006). Low yields are undoubtedly due in part to the direct effect of drought, and in part to the fact that dry areas are also hot spots where there is less capital investment (Beebe et al., 2013).
Maintaining crop yields under adverse environmental conditions is probably the major challenge facing the modern agriculture. To meet this challenge it is necessary to understand the contrasting adaptations of plants to grow in stressed and non- stressed conditions, and the compromises and trade-offs between them (Lizana et al., 2006). Given the high consumption rates of water by agriculture, constraints on water resources can be mitigated by the genetic improvement for drought stress (DS) tolerance by crop species (Porch et al., 2009).
Germplasm development of common bean has resulted in the release of a number of lines tolerant to DS and has led to a better understanding of the genetics of this trait. Drought tolerance, measured as seed yield, is an additive and quantitative trait with significant interaction with the environment. The presence of large genetic variability for drought tolerance is fundamental since it allows for selection of best varieties for breeding programs (Gustavo et al., 2003). Some studies indicate that grain yield of different common bean cultivars is not intrinsically associated with vegetative vigor at flowering and that mechanisms during pod filling can strongly influence the final crop yield. The establishment of a profuse root system during pod setting, associated with the continuous N and P acquisition during early pod filling, seems to be relevant for higher grain yields of common bean (Araujo and Teixeira, 2008).
Improved photosynthate acquisition, accumulation, and then remobilization have been observed as important mechanisms for adaptation to drought stress (Asfaw et al., 2012), which is considered one of the most important causes of yield reductions (Gustavo et al., 2003). Better remobilization of photosynthates to grain production is needed for the success of superior genotypes under stress (Polania et al., 2017). The stress tolerance index (STI) is defined as a useful marker to determine the potential of tolerance and yield under stress of the evaluated genotypes (Fernandez, 1992). Several studies have been conducted on drought stress indices (STI, MP, GMP, YI, HM and YSI) for screening genotypes under drought conditions (Sánchez-Reinoso and Gustavo, 2019), (Farshadfar, 2014). Other alternative indices useful for the identification of tolerant genotypes to water stresses have been proposed, such as drought susceptibility index (DSI) (Fischer and Maurer, 1978), Pod harvest index (PHI) (Stephanie, 2012), Harvest index (HI) (Monneveux et al. 2014). According to the study of Fernandez (1992), a suitable index or criterion is an index that is able to identify genotypes with a steady superiority that have a high correlation with yield in both stress and non-stress environments.
Drought susceptibility index (DSI) was found to be the most reliable index to identify drought tolerant genotypes, while drought intensity index (DII) and stability index (SI) were better suited to identifying intensity of drought at a location and grouping of drought tolerant genotypes, respectively (Kilasi, 2012). The genotypes that had DSI value lower than unit were selected as drought tolerant genotypes and those whose DSI values were higher than a unit, were selected as drought sensitive genotypes (Salyula, 2013).
Due to the importance of reproductive development in the drought stress (DS) response, germplasm evaluation of common bean is commonly conducted through the application of DS between pre-flowering and physiological maturity (Porch et al., 2009). Two dry matter partitioning indices have been shown to be relevant for improved drought resistance: pod partitioning index (PPI) which indicates the extent of mobilization of assimilates from the vegetative structures to pod formation, and pod harvest index (PHI) which indicates the plant efficiency in partition of photosynthates from vegetative shoot structures to pods and from pod wall to grain, which varies with the genotypes and is affected by drought. The ability of genotypes to partition stored vegetative biomass to reproductive organs to a large extent determines sink establishment and economic yield under drought stress (Chaves et al., 2002) which reduce biomass and seed yield (Muñoz-Perea et al., 2006).
The main objective of this study was to evaluate genotypes from 13 lines developed with specific traits to improve tolerance to drought and to be recommended as parents in breeding programs.
MATERIALS AND METHODS
Experimental site and materials
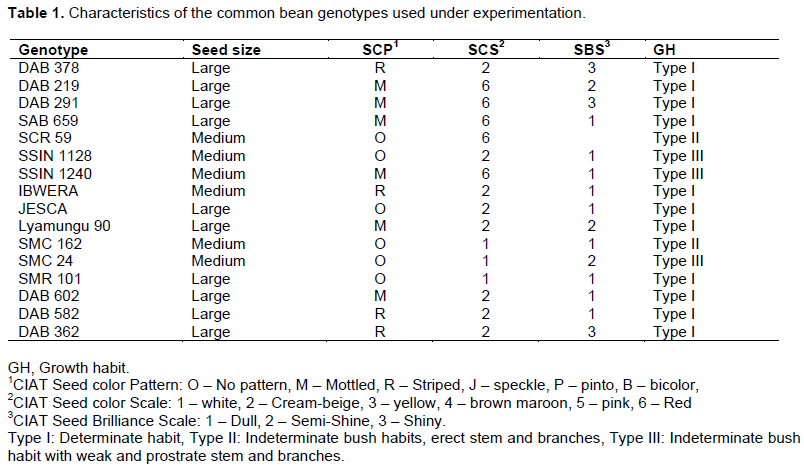
The study was conducted in screen house for two consecutive seasons; October – January 2017/2018 and February – May 2018 at TARI Maruku station which is located in Bukoba District, Kagera Region. During the experimental period, the minimum, mean and maximum temperatures were 14, 22 and 31°C respectively. A total of 16 common bean genotypes, 13 were introduced genotypes evaluated for drought tolerance from the International Center for Tropical Agriculture, CIAT, two released varieties (Lyamungu 90 and JESCA as drought check) and one landrace (Ibwera as local check) were used in the experiment (Table 1).
Experimental layout
The two – factors experiment was used in this study in layout in split – plot arrangement with three replications. The main – plot factor was water level/regimes with three levels and sub – plot factor completely randomized was common bean genotypes with 16 levels. The three levels of water were as follows: 75, 200 and 400 ml of water applied for treatment I (T1), II (T2) and III (T3) respectively, water was applied to the topsoil every day; the treatment III was considered as control.
A sandy clay loam soil was sieved through a 6 mm mesh sieve to remove large fragments and steam boiled at 100°C for three hours as a treatment measure against soil borne pathogens. Treated soil mixture containing soil, sand and farm yard manure in ratio of 1:1:1 was filled in the plastic pot (Nair and Bharathi, 2019). Each pot was filled with 5 kg of air-dried soil mixture and watered to field capacity. Four seeds were sown in each pot and one week after germination, seedlings were thinned to two seedlings per pot. All pots were well watered to field capacity in order to establish the trial until plants had three trifoliate leaves when the water stress was imposed.
Data collection
Days to flowering and days to maturity were recorded as the number of days from planting to when 50% of plants in a pot had at least one open flower and when 75% of plants in a pot had at least 90% of their pods dried, respectively (Rezene et al., 2012).
The destructive sampling was done at mid – pod filling and harvest. At mid – pod filling, one plant per pot of each genotype were sampled from both moisture stress and non – stress treatments (Polania et al., 2016). Plants were cut above the soil surface and then separated into leaves (without petioles), stems and the remaining (pods and reproductive structures) plant parts. Those plant parts were oven dried for 48 h at 80°C and dry weight of each sample was measured to determine total dry matter production and dry matter distribution in the different plant parts (Asfaw and Blair, 2014). These data were used to determine dry matter partitioning indices:
Pod partitioning index (PPI), pod harvest index (PHI) and harvest index (HI).
At the time of harvest, a plant from each pot was cut and dry weights of stem, pod, seed, and pod wall, seed number per plant (SPP) and pod number per plant (PPP) were recorded. Data were also recorded for dry weights of stem biomass, pod biomass, seed biomass, and pod wall biomass (pod without seeds). The severity of drought stress on plant traits was estimated as follows:
Drought Intensity Index (DII) = 1 – Xds/Xns,
Where Xds and Xns are the mean of all genotypes under Drought Stress (DS) and Non-Stress (NS) environments, respectively.
Drought susceptibility index (DSI) = (1 – Yds/Yns)/DII
where Yds and Yns are mean yields of a given genotype under DS and NS conditions, respectively (Fischer and Maurer, 1978).
DII and DSI were derived from the grain yield data under the three moisture regime treatments (Kilasi, 2012).
Drought tolerance index (Fischer and Maurer, 1978):
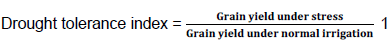
Under such conditions, common bean genotypes with higher mean yields in NS and DS environments and lower DSI values are desirable (Terán and Singh, 2002). The geometric mean (GM), harvest index (HI), pod harvest index (PHI), pod wall biomass proportion (PWBP), pod partitioning index (PPI) were determined as described by Beebe et al. (2013).
(i) Geometric mean Productivity (GMP): this was determined for economic yield,
GMP = (Yns × Yds) 1/2
where ns is non-stress and ds is drought stress (Monneveux et al., 2014).
(ii) Harvest index (HI): seed biomass dry weight at harvest / total shoot biomass dry weight at pod – filing × 100 (Monneveux et al., 2014).
(iii) Pod harvest index (PHI): The PHI for each genotype is determined by seed biomass dry weight at harvest / pod biomass dry weight at harvest × 100 (Stephanie, 2012).
(iv) Pod wall biomass proportion (PWP) (%): pod wall biomass dry weight at harvest / pod biomass dry weight at harvest × 100 (Monneveux et al., 2014).
(v) Pod partitioning index: Pod (PPI) biomass dry weight (without seeds) at harvest/total shoot biomass dry weight at mid – pod filling × 100 (Stephanie, 2012)
(vi) Yield Stability Index (YSi): Grain yield under drought stress /grain yield under non-stress (Kwabena et al., 2013).
(vii) Percentage Yield Reduction Rate (%YRR) was determined using formulae described by Fischer and Maurer (1978). YRR due to drought stress was calculated as [(mean value non-stress traits) - (mean value of drought stress trait)]/mean value of non-stress (Rezene and Zelleke, 2012).
Data analysis
Analysis of variance of the variables was done using GenStat Discovery Version edition 13 Computer program and means separation test was done using a Duncan’s New Multiple Range Test (DNMRT). Relationships between selected parameters were determined using the Pearson‘s simple correlation test.
RESULTS AND DISCUSSION
Analysis of variance
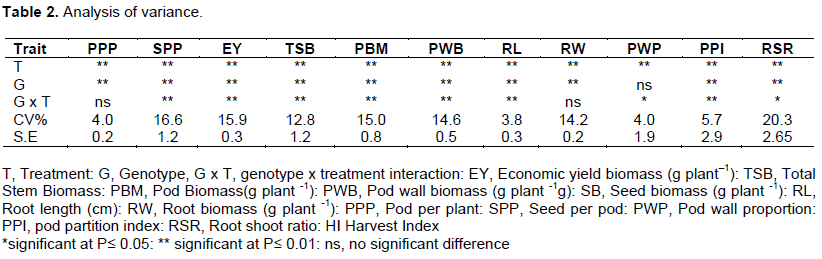
Results of analysis of variance, including the interactions were always significantly affected by treatments (Table 2). However, genotypes x treatment interaction for all traits showed significant variation except for seed biomass and pod wall biomass. The genotype x treatment had no significant differences on root weight and number of pod per plant at 0.05 level of significance.
As it was reported by Kilasi (2012) that DSI was found to be the most reliable index to identify drought tolerant genotypes. The genotypes that had DSI value lower than unit were selected as drought tolerant genotypes and those with DSI values higher than a unit, were selected as drought sensitive genotypes (Salyula, 2013). Based on the DSI, results revealed that only genotype DAB 582, performed better because it had lower values of DSI which were – 1.00, while genotypes DAB 219, DAB 291, SSIN 1128 and SAB 659 were the least performed based on the DSI which were 1.4, 1.4, 1.6 and 2.2 respectively, as shown in Table 3.
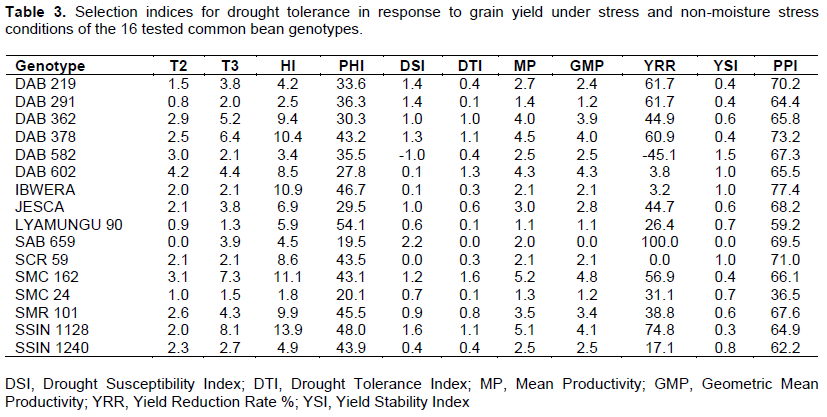
Furthermore, the genotypes responded differently to the level of moisture stress imposed during the experiment, based on the percentage yield reduction rate (YRR). The genotypes with the lowest YRR values were DAB 582, SCR 59, IBWERA, and DAB 602, respectively 45, 0.0, 3.2 and 3.8. This means that these genotypes were drought tolerant, while the last four genotypes with the highest YRR values were SAB 659, SSIN 1128, DAB 291 and DAB 219 (Table 3). The genotypes with the lowest YRR values also had the highest values of yield stability index (YSI) as shown on the Table 3.
Association among traits
The study shows that number of pod per plant (NPP), pod wall weight (without seeds) (PWW), number of seeds per pod (NSPP), seed weight per plant (SWPP) and total pod weight (TPW) were positively correlated to each other in both stress and non – stress moisture condition as shown in the Table 5. The SWPP of the tested genotypes under moisture stress (T2) had shown a highly positive correlation with TPW (r = 0.99) and TSW (r = 0.87) while in non-moisture stress (T3) the association of the SWPP and TSW was increased by 0.11 to r = 0.98 this revealed that during the moisture stress the association of seed weight and total shoot weight is decreased to make sure that photosynthetic materials were relocated to economic part of the plant during moisture stress.
The NSPP was highly positive correlated with RL (r = 0.62) and RW (r = 0.59) in the moisture stress condition but in non-moisture stress condition the association of NSPP with RL was decreased by 0.20 to r = 0.42 with no significance while its association with RW was increased to r = 0.63, this means during the non-moisture stress condition plant gets enough water therefore there were no effect of extending root length. Exposure to drought affects total biomass and seed yield, photosynthates translocation and partitioning, root length and mass (Table 4).
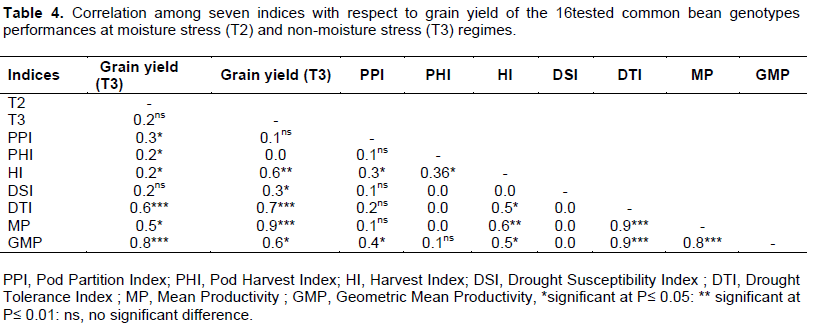
As suggested, by Fernandez (1992), that a suitable index or criterion is an index that is able to identify genotypes with a steady superiority that have a high correlation with yield in both stress and non-stress environments. Thus, drought indices which provide a measure of drought based on yield loss under drought condition in comparison to normal condition have been used for screening drought-tolerant genotypes (Mitra, 2001). This study revealed that harvest index (HI), drought tolerance index (DTI), mean productivity (MP) and geometric mean productivity (GMP) were significantly difference with grain yield in both stress and non – stress moisture conditions. Therefore, the best indices to select common bean genotypes were HI, DTI, MP and GMP (Table 4).
Also, the study revealed a positive and significant correlation between grain yield and dry matter partition indices (PPI and PHI) in moisture stress condition (Table 4). This positive relationship indicates that genotypes with higher values of grain yield under drought stress are physiologically responsive to drought stress. (Zare, 2012; Sánchez-Reinoso et al. 2019; Farshadfar, 2014; Polania et al., 2016) have suggested that the drought resistance in common bean is associated with a more efficient dry matter partitioning to pod formation and grain production.
In this regards PHI could serve as a useful selection criterion for improving drought resistance because of its simplicity in measurement and its significant correlation with grain yield under both drought stress and non – stress conditions (Assefa et al., 2013). The genotypes Lyamungu 90, SSIN 1128, IBWERA SMR 101, SSIN 1240 were superior in their ability to partition greater proportion of biomass to pod while genotypes IBWERA, DAB 378, SCR 59, DAB 219 and SAB 659 were superior in partitioning its biomass to grain production after being exposed to moisture stress environment (Table 3). As showed in the Table 5, NPP, PWW, NSPP, SWPP and TPW were highly positive and significant to each other in both moisture stress (T2) and non-moisture stress (T3) environment, also the results revealed that the RW had a positive and significant association with most of the traits except TPW in non-moisture stress but it was observed that RW had positive and significant association with NSPP only in moisture stress environment.
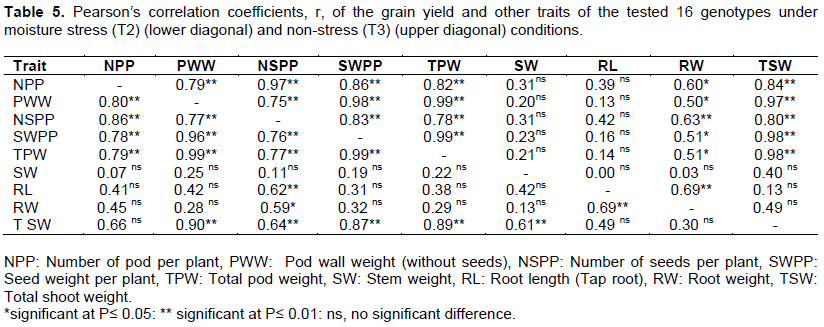
Root length (RL) had a positive significant effect on NSPP in moisture stress environment while had no significant in non-moisture stress environment, this means that during the moisture stress plants had potential to extend its tap roots deeper to extract more water from the soil; the previous study by Ndimbo (2015) reported the same result (Table 6). The yield and yield components economic yield (EY), number of pod per plant (PPP), number of seeds per pod (SPP) together with root length were used to assess the responses of the genotypes to different level of the water regime. The genotypes responded differently against moisture level, the T1 reduces economic yield, number of pod per plant, number of seed per pod and root length of the genotypes by 86.88, 86.81, 81.00 and 60.39% respectively, while the T2 had reduction of the same by 45, 36.63, 41.25 and -4.10% of the reduces economic yield, number of pod per plant, number of seed per pod and root length respectively as shown on Table 7. The reduction in economic yield of the genotypes after imposition of the moisture stress was associated with the decrease in photosynthate assimilation and poor carbohydrate partitioning to the developing grain while reduction in number of pods per plant in drought – stress as compared to the non-stress condition, may have been due to a reduction in flower fertilization under drought-stress conditions. Darkwa et al. (2016) suggests that common bean responds to drought stress by increasing root growth. Yield-component traits are generally good indicators of overall drought stress (Darkwa et al., 2016). This study revealed the significant reductions of the number of PPP and SPP under moisture stress similar as reported by Darkwa et al. (2016), Asfaw and Blair (2014) and Lizana et al. (2006).
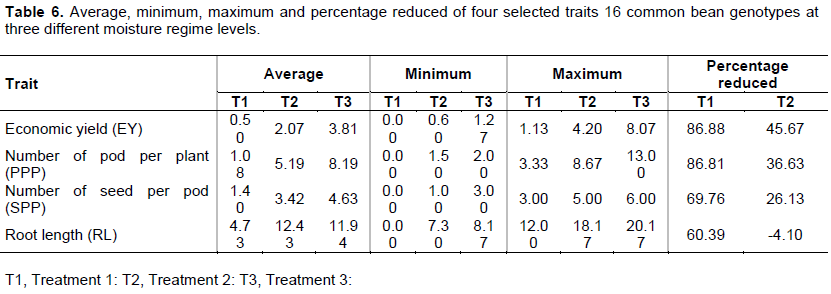
The average yield effects of all tested genotypes were 0.5 and 2.06 g plant -1 treatment 1 and 2 respectively which give a yield reduction rate of 86.88 and 45.67% respectively, while the non-stress treatment had an average of 3.81 g plant-1. The study revealed two genotypes DAB 582 and SCR 59 were able to increase its yield by 45.1% under moisture stress (T2) and maintaining the yield regardless of the stress respectively. DAB 582 performed well under moisture stress during its ability to reduced root to shoot ratio and pod wall proportional by 83% and 36.0% respectively.
Genotype SAB 659 did not performed at all in moisture stress (T2) because all plants wilted.
The effects of moisture stress on dry matter distribution
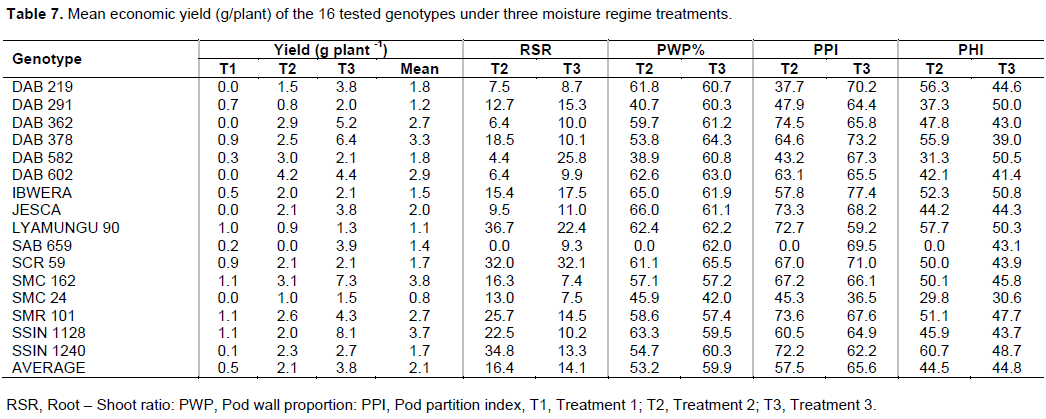
Two dry matter partitioning indices have been shown to be relevant to improved drought resistance: pod partitioning index (PPI) which indicates the extent of mobilization of assimilates from the vegetative structures to pod formation (Rao et al., 2013). The study revealed that the dry matter distribution of the 16 genotypes responded significantly to the moisture stress. Drought stress caused the significant reduction of the average pod partitioning index by 8% from 65.56 in no stress treatment (T3) to 57.55 in stress treatment (T2) (Table 7).
Root shoot ratio (w/w)
The ratio of the root biomass and the total shoot biomass revealed that DAB 582, DAB 362, DAB 602 and DAB 219 genotypes had lower ratio when subjected to the moisture stress (T2) compared to other genotypes with the average scores of 4.36, 6.4, 6.44 and 7.54% respectively while Lyamungu 90, SCR 59, SMR 101, DAB 378 had higher ratios of 36.68, 31.97, 25.74, 18.51 respectively (Table 7). In non-moisture stress treatment (T3) SMC 162, SMC 24, DAB 219 and DAB 659 were the first four genotypes which had lower ratio of the root to shoot biomass with the values of 7.42, 7.51, 8.67 and 9.26% respectively. While SCR 59, DAB 582, Lyamungu 90 and IBWERA genotypes had higher percent of the root biomass to total shoot biomass.
Pod wall proportion
Pod wall proportions (PWP) of the tested genotypes were also differed significantly with respect to the moisture stress treatments. It was observed that the average pod wall proportion of the tested genotypes was dropped from 59.94% in no stress treatment to 53.20% in stress II treatment. The study also revealed that DAB 582, DAB 291, SMC 24 and DAB 378 were the genotypes that had lower contribution to pod wall biomass when subjected to the moisture stress (T2) compared to other tested genotypes with 38.88, 40.65, 45.9 and 53.83% of the pod wall biomass in the pod biomass respectively. While the last four genotypes JESCA, IBWERA, DAB 602, Lyamungu 90 had higher contribution of the pod wall biomass to the pod biomass of 65.97%, 64.96%, 62.60%, 62.43% respectively. In the non-moisture stress treatment (T3), the SMC 24 had lower contribution of the pod wall biomass of 41.97% to the pod biomass compared to other genotypes as shown in the Table 7.
Pod partitioning Index
The pod dry matter partition index revealed that DAB 362, SMR 101, JESCA and Lyamungu 90 were the genotypes which had higher PPI values of 74.48, 73.59, 73.28 and 72.73% respectively for the T2 but in T3, IBWERA, DAB 378, SCR 59 and DAB 219 had performed better than other genotypes as shown in the Table 7.
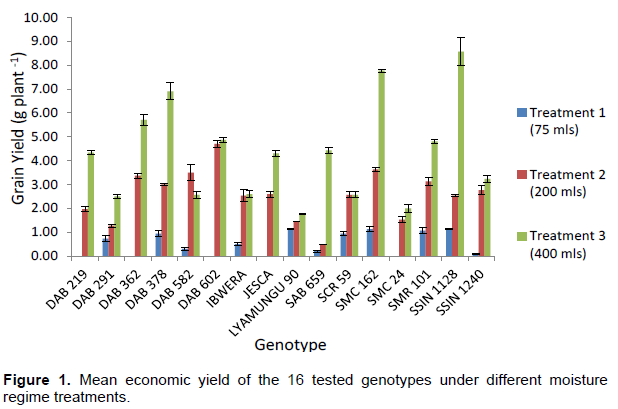
Effect of drought stress on seed yield and yield components
Figure 1 reveals that in treatment 1 genotypes SMC 162, SSIN 1128, SMR 101 and Lyamungu 90 were the ones which perform best among the tested with the mean economic yield of 1.13, 1.13, 1.07 and 1.00 g plant-1 respectively, while in the treatment 3 genotypes DAB 602, SMC 162, DAB 582, DAB 362 and SMR 101 were performed better than others with the mean yield of 4.37, 3.13, 3.00, 2.88 and 2.63 g plant -1. For the case of the treatment 3 the mean performances of the genotypes SSIN 1128, SMC 162, DAB 378, DAB 362 and DAB 602 were higher compared to others which were 8.07, 7.27, 6.4, 5.2, 4.37 g plant -1. Genotypes SSIN 1128 and SMC 162 had performed better under non-moisture stress condition compared to others but were highly sensitive to moisture stress as it reduced its seed yield by 74.8 and 56.9% respectively under moisture stress (T2) which was different to other genotypes such as DAB 602, DAB 362 which reduced its yield by 3.8 and 44.9% respectively under the same condition. Also the results revealed that genotype DAB 582 had performed better under moisture stress (T2) by increased yield of 45.1% this genotypes was able to remobilize the photosynthates to economic part of the plant while the genotype SCR 59 stabilized its yield regardless of the moisture stress condition (Table 3).
CONCLUSION
The current study revealed that there were a positive and significant association between the grain yield of the tested genotypes and the dry matter partitioning indices; PPI, PHI, HI, and DTI in moisture stress environment, this meant during the drought stress, plants had ability to partition its photosynthates from the vegetative structures to pods and grain production. It was also observed that there were a positive association (r = 0.62 **) of the tap root length and the number of seeds per pod during the moisture stress environment. Genotypes SMC 162, DAB 602, SSIN 1128, DAB 378, DAB 362 and SMR 101 had expressed their superiority in tolerating moisture stress with higher values of HI and DTI Harvest index (HI) has proved to be an important trait to breeders in identifying genotypes that are adapted to drought stress through better photosynthates mobilization.
CONFLICT OF INTERESTS
The authors have not declared any conflict of interests.
REFERENCES
|
Araujo AP, Teixeira MG (2008). "Relationships between Grain Yield and Accumulation of Biomass, Nitrogen and Phosphorus in Common Bean Cultivars." Revista Brasileira de Ciencia do Solo 32(5):1977-1986. |
|
|
Asfaw A, Blair MW (2014). "Quantification of Drought Tolerance in Ethiopian Common Bean Varieties." Agricultural Sciences 5(2):124-139. |
|
|
Asfaw A, Matthew WB, Paul CS (2012). Multienvironment quantitative trait loci analysis for photosynthate acquisition, accumulation, and remobilization traits in common bean under drought stress. G3: Genes, Genomes, Genetics 2(5):579-595. |
|
|
Assefa T, Beebe SE, Rao IM, Cuasquer JB (2013). "Pod Harvest Index as a Selection Criterion to Improve Drought Resistance in White Pea Bean." Field Crops Research 148:24-33. |
|
|
Beebe SE, Rao IM, Blair MW, Acosta-Gallegos JA (2013). "Phenotyping Common Beans for Adaptation to Drought." Frontiers in Physiology 4 MAR(March): 1-20. |
|
|
Chaves MM, Pereira JS, Maroco J, Rodrigues ML, Ricardo CP, Osório ML, Carvalho I, Faria T, Pinheiro C (2002). "How Plants Cope with Water Stress in the Field. Photosynthesis and Growth." Annals of Botany 89:907-916. |
|
|
Darkwa K, Demissie DA, Mohammed H, Asfaw A (2016). "Evaluation of Common Bean (Phaseolus Vulgaris L.) Genotypes for Drought Stress Adaptation in Ethiopia." The Crop Journal 4(5):367-376. |
|
|
Farshadfar E (2014). "Application of Integrated Selection Index and Rank Sum for Screening Drought Tolerant Genotypes in Bread Wheat." Agriculature Science and Development 3(11):375-380. |
|
|
Fernandez GCJ (1992). Effective selection criteria for assessing stress tolerance. In Mahdi Zare (2012). Evaluation of drought tolerance indices for the selection of Iranian barley (Hordeum vulgare) cultivars. African Journal of Biotechnology 11(93):15975-15981 |
|
|
Fischer RA, Maurer R (1978). Drought resistance in spring wheat cultivars: I. Grain yield responses. In Abderhim A. Jabereldar, Ahmed M. El Naim, Yasin M. Dagash, Awad A. Abdalla, Salaheldeen E. Ahmed (2017). Effect of water stress on drought tolerance index of sorghum (Sorghum Bicolor L. Moench) in North Kordofan state. University of Kordofan. Australian Journal of Agricultural Research 29:897-912. |
|
|
Gustavo MS, Saulo TA, Carlos DG, Ricardo FO (2003). "Drought Stability in Different Common Bean (Phaseolus Vulgaris L.) Genotypes." Crop Breeding and Applied Biotechnology 3:203-208. |
|
|
Hillocks RJ, Madata CS, Chirwa R, Minja EM, Msolla S (2006). "Phaseolus Bean Improvement in Tanzania, 1959-2005." Euphytica 150(1-2):215-231. |
|
|
Kwabena D, Daniel A, Hussein M, Asrat A, Matthew WB (2013). "Evaluation of Faba Bean (Vicia Faba L.) Varieties against Chocolate Spot (Botrytis Fabae) in North Gondar, Ethiopia." African Crop Science Journal 4(1):42-43. |
|
|
Lizana C, Wentworth M, Martinez JP, Villegas D, Meneses R, Murchie EH, Pastenes C, Lercari B, Vernieri P, Horton P, Pinto M (2006). "Differential Adaptation of Two Varieties of Common Bean to Abiotic Stress I. Effects of Drought on Yield and Photosynthesis." Journal of Experimental Botany 57(3):685-697. |
|
|
Manjeru P, Madanzi T, Makeredza B, Nciizah A, Sithole M (2007). "Effects of Water Stress at Different Growth Stages on Components and Grain Yield of Common Bean (Phaseolus Vulgaris L.)." Crop Science 8:299-303. |
|
|
Mitra J (2001). Genetics and genetic improvement of drought resistance in crop plants. Current Science 80:758-762. |
|
|
Monneveux P, Jean-marcel R, Antonia O (2014). Drought Phenotyping in Crops: From Theory to Practice. |
|
|
Muñoz-Perea CG, Henry T, Richard A, James LW, Dale W, Shree PS (2006). "Selection for Drought Resistance in Dry Bean Landraces and Cultivars." Crop Science 46(5): 2111. |
|
|
Nair AS, Bharathi TU (2019). "Standardization of Substrate Composition for Pot Plant Production of Tuberose Var. Arka Sugandhi." International Journal of Current Microbiology and Applied Sciences 8(01):2197-2203. |
|
|
Ndimbo MA (2015). Asian Journal of Agriculture and Rural Development effects of moisture stress levels at different growth stages on nodulation and nitrogen fixation in common bean (Phaseolus vulgaris L.) genotype 5(8):5005. |
|
|
Polania JA, Charlotte P, Stephen B, Idupulapati MR (2016). "Effective Use of Water and Increased Dry Matter Partitioned to Grain Contribute to Yield of Common Bean Improved for Drought Resistance." Frontiers in Plant Science 7:1-10. |
|
|
Polania J, Rao IM, Cajiao C, Grajales M, Rivera M, Velasquez F, Beebe SE (2017). "Shoot and Root Traits Contribute to Drought Resistance in Recombinant Inbred Lines of MD 23-24 × SEA 5 of Common Bean." Frontiers in Plant Science 8:296. |
|
|
Porch TG, Ramirez VH, Santana D, Harmsen EW (2009). "Evaluation of Common Bean for Drought Tolerance in Juana Diaz, Puerto Rico." Journal of Agronomy and Crop Science 195(5):328-334. |
|
|
Rezene Y, Setegn G, Habtamu Z (2012). "Morpho-Physiological Response to Post-Flowering Drought Stress in Small Red Seeded Common Bean (Phaseolus Vulgaris L.) Genotypes." Journal of Plant Studies 2:1. |
|
|
Salyula PK (2013). Physiological Responses of Common Bean (Phaseolus Vulgaris L.) Genotypes to Water Stress pp. 1-91. |
|
|
Sánchez-Reinoso AD, Ligarreto-Moreno GA, Restrepo-Díaz H (2019). "Evaluation of Drought Indices to Identify Tolerant Genotypes in Common Bean." Journal of Integrative Agriculture 3119:1-10. |
|
|
Stephanie MK (2012). "Photosynthate Remobilization Capacity from Drought-Adapted Common Bean (Phaseolus vulgaris L.) Lines Can Improve Yield Potential of Interspecific Populations within the Secondary Gene Pool." Journal of Plant Breeding and Crop Science 4:4. |
|
|
Terán H, Singh SP (2002). "Selection for Drought Resistance in Early Generations of Common Bean Populations." Canadian Journal of Plant Science 82(3):491-497. |
|
|
Zare M (2012). "Evaluation of Drought Tolerance Indices for the Selection of Iranian Barley (Hordeum vulgare) Cultivars." African Journal of Biotechnology 11:75-81. |
|
Copyright © 2024 Author(s) retain the copyright of this article.
This article is published under the terms of the Creative Commons Attribution License 4.0


