Full Length Research Paper

ABSTRACT
To study the genetic variability and selection index of selected tomato genotypes, an experiment was conducted at the farmer’s field of Chirirbandar Upazilla of Dinajpur District, Bangladesh. Ten tomato genotypes were evaluated in a randomized completely block design with four replications. The study results displayed high heritability plus higher genetic advance for all the traits studied. Among the traits, plant height showed high genotypic and phenotypic coefficients of variation over other traits. Yield per plant alone had 100% expected genetic gain and the relative effectiveness of the other functions was calculated in like manner. Selection indices exhibit eight traits association (yield plant-1 with plant height, canopy width, days to flowering, fruit diameter plant, fruit length, single fruit weight), and therefore the number of marketable fruit is simpler for genetic improvement thanks to the most expected genetic gain (665.23) with maximum relative efficiency (125.88%). Based on the selection index value and total rank value for selection criteria, the eight-traits combined with V6 and V10 are the promising genotypes that can be used as potential gene donor for further breeding program.
Key words: Genetic variability, selection index, tomato.
INTRODUCTION
Tomato (Solanum lycopersicum L.) is a member of Solanaceae family (Sharma et al., 2019) and belongs to the genus Lycopersicum (Mital et al., 2016). It is generally accepted that tomato originates within the new world (The America), that is the Andean region comprising Bolivia, Chile, Colombia, Ecuador, and Peru (Blanca et al., 2012). In Bangladesh, tomato is growing with the overall production of 385 thousand metric tons (BBS, 2018). In the face of higher yield potential, the potentiality of Bangladeshi tomato genotypes is comparatively lower than other tomato grower countries (Ali et al., 2014). Due to the rapid growing population of the country as well as their rapid change in food habits, it is desired to have a higher yield per unit area to meet the increasing demand for tomato. For the improvement program of any crop it is important to have the knowledge of the relationship between yield and yield contributing traits. To select breeding materials and to formulate breeding programs, a comparative study of various quantitative traits especially those associated with the yields is helpful for plant breeders.
The genetic variability in the existing materials is the prime source of effective selection for high yielding types. For effective selection, an assessment of the magnitude of genetic variability and its interaction with environmental variables is very useful for a plant breeder. Enough genetic variation is needed for an effective plant breeding program for the selection of better types. Careful selection and hybridization may help the plant breeder to obtain lines higher in yields with better quality. For the effective selection, genetic variability can offer an opportunity for high yielding tomato variety rich in fruit quality. To determine the most valuable genotypes along with the most suitable combination of traits selection index helps with the intention of indirectly improving yield in different plants (Sabouri et al., 2008; Rezai and Yousofi, 2008).
The individuals and progenies undergoing the selection process are classified by the selection index. The selection index is proposed by maximizing the correlation between the indexes itself and aggregating the genotypes (Smith, 1936; Hazel, 1943). For selection, construction of selection indices and the analysis of the phenotypic values of each of two or more traits to be used simultaneously would give the most appropriate weightage. That is why this research was performed to apply the selection index which combines the genotypic and phenotypic values of different yield contributing traits of tomato genotypes that could enhance the genetic improvement for yield and also to select promising genotypes.
MATERIALS AND METHODS
Experimental site
The research work was conducted at the farmer’s field of Chirirbandar Upazilla of Dinajpur, Bangladesh, from October 2017 to April 2018 in the Rabi season. The experimental field was located at 25.130 N latitude and 88.230 E longitudes at an altitude of 37.5 m above the mean sea level.
Soil and climate
The experimental land was medium-high. The soil belongs to the old Himalayan Piedmont Plain of the Agro-Ecological Region (AEZ-1). The initial soil (0-15 cm depth) test revealed that the soil contained 0.10% total nitrogen, 1.06 organic matter, 24 (µg/g) available Phosphorus, 0.269 (meq/100g) available Potassium, 3.2 (µg/g) available sulphur and 0.27 (µg/g) boron. The experimental area possesses a sub-tropical climate. Usually, rainfall is heavy during the Kharif season (March – September) and scantly in Rabi season (October – February).
Experimental layout and planting materials
The experiment was laid out in a Randomized Complete Block Design (RCBD) with four replications. The layout of the experiment was prepared for distributing the genotypes into every plot of each block. The individual plot size was 12 m × 1 m. Each replication contained 10 plots. Each plot contains 15 plants. The distances between the rows were 1m and plant to plant distances were 0.80 m. The distance between the block was 1m. There were 528 m2 plots in this experiment. Each of the tomato genotypes was produced in the 2017-2018 cropping season, and the purity with germination percentage was leveled as around 98 and above 95, respectively. The experimental materials were collected from the BARI (Bangladesh Agricultural Research Institute) and local market of Chirirbandar upazilla. For this research the genotypes were designated as V1, V2, V3, V4, V5, V6, V7, V8, V9, and V10.
Production procedure and data collection
The plot selected for the experiment was opened in the first week of November 2017 and it was partitioned into the unit plots in accordance with the experimental design. Bangladesh Agriculture Research Council (2018) recommended doses of manure and fertilizers (Cow dung, Urea, Triple Super Phosphate, Murate of Potash, Zinc sulphate and Gypsum at 5000, 150, 50, 75, 25 and 5 kg ha-1) were mixed with the soil. At the time of final land preparation, the whole amount of well-decomposed cow dung, Triple Super Phosphate, Muriate of Potash and half amount of urea were applied to the field. The rest half of the urea was applied in two installments (15 days after transplanting and a week before flowering) in equal quantity as ring placement method. The seed was sown on 12 October, 2017 and transplanting was done at in the afternoon of 12 November 2017 when the seedlings were 30-day old. Watering was done for seven days. Various intercultural operations like irrigation, gap filling, weeding, mulching, stacking with pant protection measures were done as per necessary. Depending on variable maturity time harvesting continued for about one month because fruits of different genotypes matured progressively at different dates and over a long time. The fruits per entry were allowed to ripe and then seeds were separated from them and then the seeds were collected from them for future use. Data on different yield and yield contributing traits were recorded on the plot and plant basis as per the experimental requirement. Data were recorded; ten (10) plants from each unit plot were selected randomly in replication and were tagged as individual plants. The traits plant height, canopy width, days to flowering, fruit length, fruit diameter, number of marketable fruits, and yield per plant were recorded in the field and the single fruit weight, shelf life, and thousand seeds weight were recorded in the laboratory after harvest.
Data analysis
The genotypic and phenotypic coefficient of variation was calculated according to Burton (1952). Broad sense heritability was estimated by the formula of Lush (1940) that was suggested by Hanson et al. (1956) and Johnson et al. (1955). The expected genetic advance for various traits under selection was estimated using the formula suggested by Lush (1940) and Johnson et al. (1955). For calculating the genotypic and phenotypic coefficient of correlation for all possible combinations the formula suggested by Hanson et al. (1956) and Johnson et al. (1955) was adopted. For creating selection indices R- Program version 3.2.2 was used.
RESULTS AND DISCUSSION
Genetic parameters of tomato genotypes
Significant differentiation was observed among the genotypes for all the studied traits. It exhibits the presence of greater genetic variation among the studied genotypes. At genotypic and phenotypic levels, the assessment of variance and coefficients of variation in a populace is a crucial factor for choice and efficacy of assortment of individuals for forthcoming breeding plan in crop species. Among the traits plant height (665.12), canopy width (138.19), number of marketable fruits plant-1 (132.01), and yield plant-1 (117139.31) displayed above 10% phenotypic variation so considered as high. On the other hand, fruit length (0.82), single fruit weight (26.81), thousand seed weight (0.12), and shelf life (3.86) exhibit a medium phenotypic coefficient of variation. Only days to flowering (2.25) and fruit diameter (1.53) showed lower phenotypic variation value. At genotypic level plant height (650.10), canopy width (130.42), number of marketable fruits plant-1 (119.00), and single fruit weight (26.11) showed higher genotypic variation but slightly lower than the phenotypic variation (Table 1).
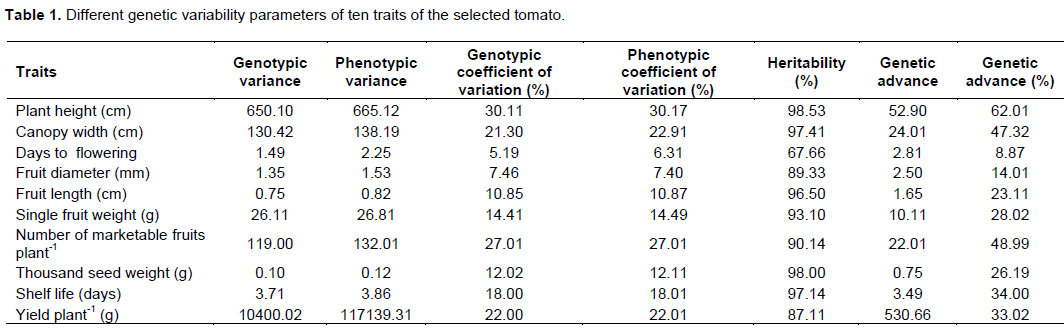
A higher difference between Phenotypic Coefficients of Variation (PCV) and Genotypic Coefficients of Variation (GCV) indicates a high influence of the environment on the traits whereas low difference indicates the low influence of the environment on the traits. The values of phenotypic coefficient of variation and genotypic coefficient of variation greater than 20% are regarded as high, whereas the values less than 10% are regarded to be low and values between 10 and 20% to be medium (Srivastava et al., 1998). The fruit length (10.85), single fruit weight (14.41), thousand seed weight (12.02), shelf life (18.00) and yield plant-1 (22.00) exhibit moderate GCV value but minor than PCV value. Among the traits plant height (30.17), canopy width (22.91), number of marketable fruits plant-1 (27.01) and yield plant-1 (22.01) displayed above 10% phenotypic co-efficient of variation so considered as high. In contrast, hand fruit length (10.87), single fruit weight (14.49), thousand seed weight (12.11), and shelf life (18.01) exhibit a medium phenotypic coefficient of variation. Only days to flowering (6.31) and fruit diameter (7.40) showed lower PCV value. However, slightly higher estimation of GCV value than PCV value was found in relation to days to flowering (5.19) and fruit diameter (7.46). Generally quantitative or agronomic traits are influenced by the environment (Table 3).
In this study, the GCV values were little lower than PCV, displayed that the environment had a slightly important role for the expression of these traits or more specifically these traits varied due to the genetic makeup of the genotype itself. The next difference between PCV and GCV indicates the high influence of the environment on the traits whereas low difference indicates the low influence of the environment on the traits. The genetic advance is a valuable indicator of the development that can be projected as a result of exercising choice on the relevant population. The estimations of heritability perform as projecting tool in expressing the trustworthiness of phenotypic value. So, high heritability helps in effective choice for a particular trait. Again, heritability values greater than 80% are considered as very high, values from 60 to 79% are moderately high, values from 40 to 59% are medium and values less than 40% are low (Singh, 2001). All the traits under study showed higher heritability (>80%) except days to flowering which showed moderately high heritability (67.66%). How much variation of a trait due to genes within a population is compared to variation due to the environment is measured by heritability. The yield plant-1 (530.66) recorded the highest GA followed by plant height (52.90 cm), canopy width (24.01 cm), number of marketable fruits plant-1 (22.01), and single fruit weight (10.11 g). The lowest GA was observed in days to flowering, fruit diameter, fruit length, thousand seed weight, and shelf life.
The estimates of genetic advance as percent of mean were highest for plant height, number of marketable fruits plant-1, canopy width, shelf life, yield plant-1, thousand seed weight and fruit length. The rest of the traits showed lowest value of genetic advance in percent mean. It showed the predominance of additive gene action for governing these traits. Therefore, these traits can be developed only over selection. High heritability per low genetic advance was detected for thousand seed weight, fruit length and fruit diameter. It recommended non-additive gene action for the expressions of these traits. The high heritability was displayed because of promising influence of environment fairly than genotype and selection for such traits might not be satisfying. Low heritability together with high genetic advance was recorded for yield plant-1. It exposed that the trait is directed by additive gene effects. The low heritability was being shown by reason of high environmental effects. Therefore, selection for this trait might be effective.
Construction of Selection Indices in tomato
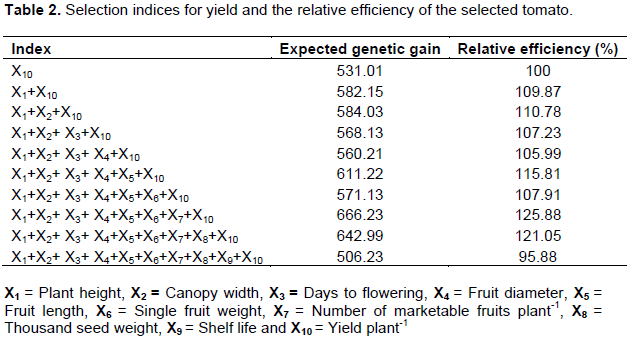
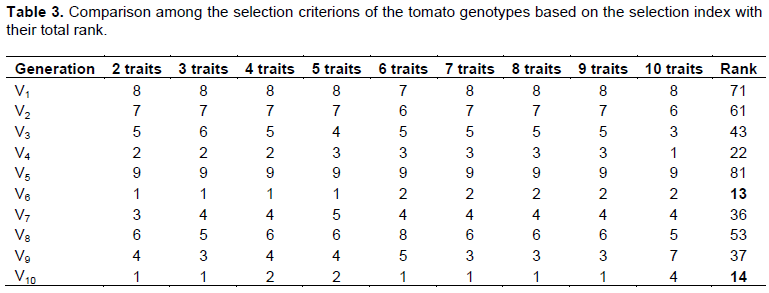
With the corresponding integration of more number of traits in functions, the benefit of selection indices was increased. By using different combinations of yield and yield contributing traits different selection indices were formulated and their expected genetic grain and relative efficiencies were estimated (Table 2). Higher relative efficiency pointed improvement of the traits would be more efficient with the selection index. The expected genetic gain for yield per plant (531.01) and relative efficiency (100%) was estimated (Table 2). The relative efficiency in two and three traits combinations (109.87 and 110.78%) were increased very slightly. But at four and five traits association the relative efficiency slightly decreased from the previous combination. This may be due to the addition of variation of fruit diameter and fruit length. However, relative efficiency (115.01%) of six traits combination increased sharply indicating those traits could be improved by the breeding program (Table 2). Likewise in four and five traits association a decreasing trend of relative efficiency was also found in seven, nine and ten trait combinations indicating these combinations are less effective for improvement than other traits combination. Eight traits combination showed maximum relative efficiency (125.88%) overall the combinations. Again, a breeder may be optimistic to increase the present yield status under the selection of more traits in the function and also gradual relative efficiencies should be analyzed for each multiple function. In this research work, the maximum relative efficiency over direct selection was 125.88% in eight traits association for the construction of selection index. Therefore, selection index based on eight traits association (yield per plant with plant height, canopy width, days to flowering, fruit diameter plant, fruit length, single fruit weight and the number of marketable fruit) would be more efficient for improvement as maximum expected genetic gain (666.23) with maximum relative efficiency (125.88%) is suggested for the improvement of yield (Table 2). By comparing among relative selection criterion of all the traits of ten tomato genotypes based on the best selection index (yield per plant with plant height, canopy width, days to flowering, fruit diameter plant, fruit length, single fruit weight and the number of marketable fruit) with their total rank value V6 and V10 are the promising parents (Table 3).
CONCLUSIONS
The traits yield plant-1, plant height, and canopy widths are attributable to belonging to additive gene, which demonstrates that advance in these traits is auspicious through hybridization followed by selection per pedigree breeding. The traits thousand seed weight, fruit length and fruit diameter with high heritability and low genetic advance representing the trait is inclined by environmental effects and selection may not be useful. Besides, by comparing among relative selection criterion of all the traits and based on the best selection index with their total rank value V6 and V10 are the promising parents those can be used for future hybridization program.
CONFLICT OF INTERESTS
The authors have not declared any conflict of interests.
REFERENCES
|
Ali AS, Reza MH, Ali M, Hossainn MD, Mahabubn ST, Hoque MA (2014). Performance of local and exotic hybrid tomato varieties in Bangladesh. International Journal of Natural and Social Sciences 1(2):100-105. |
|
|
Bangladesh Bureau of Statistics (BBS) (2018). Yearly Statistical Book. Bangladesh Bureau of Statistics, Dhaka Bangladesh. |
|
|
Blanca J, Canizares J, Cordero L, Pascual L, Diez MJ, Nuez F (2012). Variation revealed by SNP genotyping and morphology provides insight into the origin of the tomato. PloS one 7(10):e48198. |
|
|
Burton GW (1952). Quantitative inheritance in grasses. Proceedings in International Grassland Congress 1:277-283. |
|
|
Hanson CH, Robinson HF, Comstock RE (1956). Biometrical studies of yield in segregating populations of Korean lespedeza 1. Agronomy Journal 48(6):268-272. |
|
|
Hazel LN (1943). The genetic basis for constructing selection indexes. Genetics 28(6):476-90. |
|
|
Johnson HW, Robinson HF, Comstock RE (1955). Genotypic and phenotypic correlations in soybeans and their implications in selection 1. Agronomy Journal 47(10):477-83. |
|
|
Lush JL (1940). Intra-sire correlations or regressions of offspring on dam as a method of estimating heritability of traitistics. Journal of Animal Science 1:293-301. |
|
|
Mital RY, Haque MA, Rima SA, Begum SN (2016). Field performance and genetic analysis of selected tomato (Lycopersicon esculentum Mill.) genotypes. Journal of the Bangladesh Agricultural University 14(1):31-36. |
|
|
Rezai AM, Yousofi AM (2008). Comparison of direct and indirect selection methods based on selection indices in wheat lines in drought and non-drought conditions. Isfahan University of Technology-Journal of Crop Production and Processing 12(45):21-32. |
|
|
Sabouri H, Rabiei B, Fazlalipour M (2008). Use of selection indices based on multivariate analysis for improving grain yield in rice. Rice Science 15(4):303-310. |
|
|
Sharma P, Dhillon NS, Kumar V, Kumar P (2019). Correlation and path analysis for yield and its contributing traits in tomato (Solanum lycopersicum L.) under the protected environment. Journal of Pharmacognosy and Phytochemistry SP1:447-450. |
|
|
Singh BD (2001). Plant Breeding: Principles and Methods, Kalyani Publishers, New Delhi, India. |
|
|
Smith HF (1936). A discriminant function for plant selection. Annals of Eugenics 7(3):240-250. |
|
|
Srivastava JP, Singh H, Shrivastava BP, Verma HRS (1998). Heterosis in relation to combining ability in tomato. Vegetable Science 25:43-47. |
|
Copyright © 2024 Author(s) retain the copyright of this article.
This article is published under the terms of the Creative Commons Attribution License 4.0


