Commercial cattle farming in semi-arid regions is subject to high rainfall risk. At the same time, it is prone to rangeland degradation. Theoretical works suggest that rainfall risk management by means of financial instruments may stabilize farming-derived income over the short-term, but provides little incentives for conservative rangeland management. Thus, the use of financial strategies of income stabilization may accelerate rangeland degradation over the long term, as opposed to production or organization strategies which may alternatively be used to stabilize farming incomes. In this paper, we provide an empirical characterization of Namibian commercial cattle farming and explore the link between risk, management, and sustainability by examining structural farm patterns with a cluster analysis. Our data comes from a large-scale survey across the Namibian commercial cattle farming area, to which 398 farmers responded. Our results show that the most distinct of the three identified clusters is characterized by high sustainability and low financial risk management, and that it does not differ from the remaining two clusters with respect to income. This suggests an inverse relationship between financial risk management and sustainability, and thus supports theoretical insights.
A defining characteristic of semi-arid areas is low and highly variable rainfall. Roughly 50% of the land in these areas is used as rangeland for extensive livestock farming (MEA, 2005), as this type of land use offers sufficient flexibility to adapt to the challenging rainfall conditions. However, even though livestock farming is intended to deal with the variable rainfall conditions, it is frequently unsustainable with 10–20% of semi-arid areas being degraded (MEA, 2005: 637, 640). One reason is that livestock farming is often practiced as communal, common-property farming systems where it maybe rational for farmers to“ produce outcomes that are not in anyone’s long-term interest” (Ostrom, 1999: 279).
However, degradation is also observed in commercial farming systems where property-owning farmers exclusively manage rangeland and may do so for decades (de Klerk, 2004; Smit et al., 2015). One reason for degradation in commercial systems is the use of inadequate management strategies (Fynn and O'Connor, 2000; de Klerk, 2004; Wiegand, 2010; Kgosikoma et al., 2012). More specifically, theoretical analyses suggest that financial management strategies may stabilize farming-derived income, but that farmers who apply these strategies refrain from periodically resting their rangeland and thereby ultimately overstock their land (Quaas et al., 2007; Quaas and Baumgärtner, 2008, 2012; Baumgärtner and Quaas, 2009a; Müller et al., 2011). Essentially, financial strategies thus trade-off the short-term reduction of income risk against the system’s long-term sustainability. The precise link between risk, management and sustainability in commercial farming systems is, however, poorly understood, not least of all because comprehensive empirical data is lacking.
In this paper, we empirically characterize risk, management and sustainability and examine their links for commercial livestock farming in semi-arid rangelands. . Our case study is commercial cattle farming in Namibia which constitutes an economically important sector that contributes directly 1–2% to Namibia’s GDP (MAWF, 2009) and provides employment for approximately 40,000 farmers and farm workers (NTA, 2013: 15).[1] . Like other semi-arid areas, Namibian rangelands are subject to high rainfall risk (Sweet, 1998) as well as to degradation in the form of bush encroachment (de Klerk, 2004; Smit et al., 2015).
In August 2008, we conducted a large-scale survey among 2,119 commercial cattle farmers through a mail-in questionnaire (Olbrich et al., 2012).[2] We collected information on 1) perceived rainfall risk, 2) risk management strategies, 3) the farm’s sustainability, 4) individual risk and time preferences and normative views of sustainability, and 5) personal, farm and environmental features. 398 farmers responded to the survey, corresponding to a response rate of 19%. Here, we analyse these data by providing descriptive statistics and also by exploring structural farm patterns in a cluster analysis for a subset of 108 farmers. We hypothesize that risk, management and sustainability are intricately linked for our case study along the lines of earlier theoretical results described above.
The paper is organized as follows: First is a brief description of commercial cattle farming in Namibia, followed by a description of the data collection and the analytical procedures. Thereafter the descriptive statistics and results for the cluster analysis is presented, discussed and the research concluded.
[1] This amounts to 5.7% of total employment in Namibia (NSA, 2015: 6).
[2] Although dating from 2008, our survey is (to our knowledge) still the most recent and comprehensive of its kind in Namibia.
One prominent notion of sustainability is strong sustainability: critical natural and economic components of a system – such as rangeland condition or farm income – have to be conserved at or above specified thresholds, and have to be conserved independently of each other (Pearce et al., 1989; Ekins et al., 2003). Specifying sustainability thresholds is a normative decision and may, like all normative decisions, occur at the level of the individual or at the level of the society (Schwartz, 1977; Stern, 2000; Baumgärtner and Quaas, 2009b; Young and Burke, 2010; Olbrich et al. 2014).
Once thresholds are specified, achieving sustainability depends on choosing and applying adequate management strategies (or, more generally, measures) in order to comply with the thresholds (Baumgärtner and Quaas, 2009b).
The management strategies that are ultimately adequate may not be obvious at first, as different strategies may all have beneficial effects over the short-term. However, some strategies may ultimately be detrimental for the system and lead to an unsustainable development, which may become only obvious over the long term.
In a series of theoretical studies, Quaas and Baumgärtner (2008), Baumgärtner and Quaas (2009a) and Müller et al. (2011) showed for Namibian rangelands that conservative rangeland management that employ resting strategies particularly adapted to variable rainfall may provide a form of natural insurance, as it buffers the negative effects of low rainfall events. Such strategies that are aimed at the production process / farm organisational levels and financial strategies are substitute for reducing income risk – and thus for stabilizing income – over the short term. Over the long-term, however, financial strategies can be unsustainable: farmers no longer have an incentive to use natural insurance by means of conservative rangeland management. Instead, they overstock their farms. This slowly degrades their rangeland and eventually also leads to considerably lower farm income.
System description of commercial cattle farming in Namibia
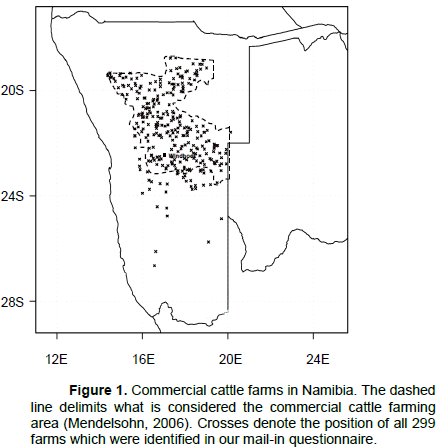
Commercial cattle farming is an extensive farming system and economically the dominant livestock system in Namibia: it contributes by far the largest share of total agricultural output and approximately 1–2% directly to GPD (MAWF, 2009: 7, 9). An estimated 2,250 commercial cattle farmers (Olbrich et al., 2012) keep an average of 840,000 cattle (MAWF, 2009: 13). Of the 298,961 cattle that are on average marketed each year, roughly half (49%) are sold as live cattle (almost exclusively as weaners) whereas the other half (51%, almost exclusively oxen) are sold as beef (MAWF, 2009: 14). Almost all weaners are exported as live cattle to feed lots in South Africa (Schutz, 2010). Beef is primarily sold to South Africa (45%), overseas (37%) and other markets (3%) with only a small fraction consumed domestically (15%) (MAWF, 2009: 14, 15). The commercial cattle farming area in Namibia covers approximately 14.5 million hectares (ha) (Mendelsohn, 2006: 42) of rangeland in the northern half of Namibia (Figure 1). It is confined at its southern and western fringes by areas too dry for farming and at its northern and eastern fringes by communal lands. On average, the commercial cattle farming area receives an annual rainfall of only 374 mm, with 95% (352 mm) of rainfall falling during the rainy season from November to April (NMS, unpublished).
Rainfall is low on average and varies considerably, both across rainy seasons (NMS, unpublished) and across individual farms (Ward et al., 2004). The rangeland’s production is rainfall-limited and strongly co-varies with rainfall (Ward and Ngairorue, 2000; du Plessis, 2001; Atlas of Namibia Project, 2002: Figure 2).
As such, precipitation risk directly transforms into rangeland production risk. Since commercial cattle farming in Namibia is extensive farming, the rangeland production risk in turn translates into cattle production and ultimately income risk.
Beyond being subject to low and highly variable rainfall, rangelands of the commercial cattle farming area are in an unsustainable state. They suffer from degradation due to bush encroachment, i.e. they have come to be dominated by woody vegetation (de Klerk, 2004; Joubert et al., 2008; Kgosikoma et al., 2012; Smit et al., 2015). Bush encroachment entails a reduction in the rangeland’s overall production which is equivalent to a reduction in grazing capacity. A reduction in grazing capacity, in turn, diminishes farm income (de Klerk, 2004; Lukomska et al., 2014) since grazing capacity directly relates to the amount of cattle that may be supported by the rangeland. Bush encroachment across the commercial cattle farming region is illustrated by grazing capacity being nowadays much worse than the historic value of above 0.1 Large Stock Unit per hectare (LSU/ha) that was encountered on average across Namibia until the mid 1960s (de Klerk, 2004: 21).
Risk management strategies in cattle farming
As previously mentioned, farmers’ income is highly risky since it is related to the high rainfall risk via rangeland production and cattle production. Income may thus change dramatically from year to year if no risk management is conducted.
A farmer may manage the risk through a number of risk management strategies. These strategies either adjust the organization or production processes of the farm (“on-farm strategies”) or makes use of financial products or off-farm assets (“financial strategies”). The main on-farm strategies are:
i) Increasing the rangeland size (“rangeland size increase”),
ii) Resting part of the rangeland to provide feed throughout the year (“resting rangeland”),
iii) Providing cattle with purchased hay and licks (“additional feed”),
iv) Choosing cattle breeds adapted to local environmental conditions (“breed adaptation”),
v) Choosing a production system, such as weaner or ox production, that is adapted to local environmental conditions (“production system adaptation”);
and the main financial strategies are:
i) agreeing on advances on livestock sales (“advances on livestock sales”),
ii) keeping a checking account as a financial buffer (“checking account as buffer”),
iii) taking up loans for covering operating losses (“loans for covering operating losses”),
iv) obtaining income from off-farm sources (“off-farm income”), and
v) investing into agricultural derivatives (“investment into agricultural derivatives”).
Data sources
Here, we briefly describe the process and the questionnaire that we used for the data collection. A detailed description of the data collection can be found in Olbrich (2012) which also includes a copy of the questionnaire.
Description of data collection
In August 2008, we sent out mail-in questionnaires to commercial cattle farmers in Namibia in order to elicit 1) perceived rainfall risks, 2) risk management strategies, 3) the farm’s sustainability, 4) individual risk and time preferences and normative views of sustainability, and 5) personal, farm and environmental features. Questionnaires were sent to a group of 2,119 farmers which consisted of members of the Namibia Agricultural Union (NAU) and of farmers that deliver cattle to MeatCo, the largest slaughterhouse in Namibia. This group essentially is the whole population of commercial cattle farmers in Namibia (Olbrich et al., 2012). We mailed out questionnaires for the first time in the period 19th – 21st of August 2008, and a second time as a follow up on the 15th of September 2008.
398 questionnaires were returned, equaling a return rate of 19%. An optional question for identification of the farm was answered by 299 (75.1%) of questionnaire participants.
Elicitation of rainfall risk, management and sustainability
We elicited rainfall risk by asking farmer to rate this risk on a six-item Likert-scale ranging from “no risk at all” to “very high risk”.We elicited risk management by asking farmers for each on-farm risk management strategy (that is, rangeland size increase, resting rangeland, additional feed, breed adaptation and production system adaptation) and financial risk management strategy (that is, advances on livestock sales, checking account as buffer, loans for covering operating losses, off-farm income and investment into agricultural derivatives) to self-report the importance they ascribe to each strategy. Importance was recorded on a six-item Likert-scale ranging from “not at all important” to “very important”.
We measured sustainability by the grazing capacity in the unit LSU/ha, in line with our depiction of the rangeland system. Note that we explicitly asked farmers to report the grazing capacity of their rangeland (and that we did not simply calculate the stocking rate).
Elicitation of risk and time preferences and normative views of sustainability
We elicited risk and time preferences by hypothetical choice experiments in the questionnaire using a multiple-price-list format (Olbrich et al., 2012). Based on this elicitation, we construct indices for risk and time preference out of the raw responses in the experiments. The risk preference index hereby is a discrete variable with values in {1, 2, …, 7} where low values denote high risk aversion and high values denote risk attraction. For the time preference index we construct a discrete variable with values in {1, 2, …, 6} where low values denotes patience and high values denote impatience.
In accordance with the definition of strong sustainability in Section 2.1, we pre-selected ecosystem condition of the rangeland, measured as grazing capacity in the unit LSU/ha, as one critical component for conservation; and we selected income, measured as net annual income in the unit N$, as an additional critical economic component. We then elicited the threshold level at or above which ecosystem condition (income) should be conserved.
In addition, we elicited two further normative views of sustainability which are tied closely to the notion of strong sustainability. Firstly, the acceptable risk that the conservation of ecosystem condition (income) fails in a given year, measured as a probability, and secondly the time horizon for conservation of ecosystem condition and income, measured in the generations.
Elicitation of personal, farm and environmental features
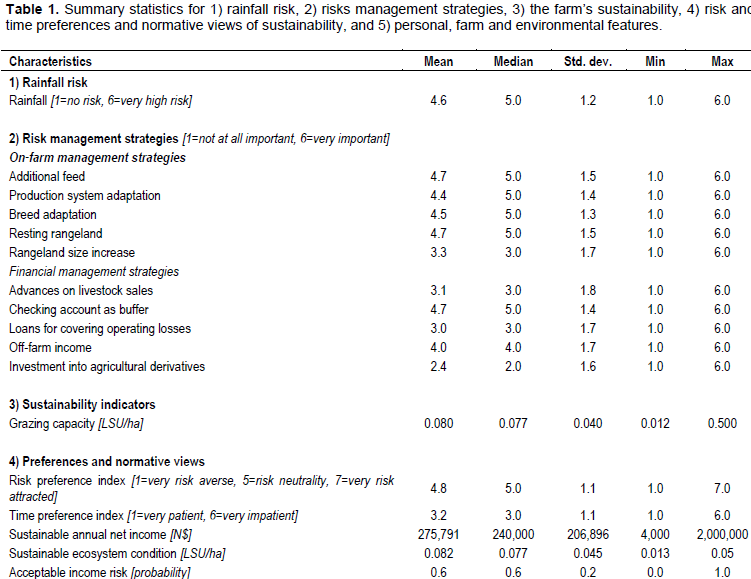
In addition to the aforementioned variables, we elicited a variety of personal, farm and environmental features. A list of all elicited variables along with their summary statistics is given in Table 1.
Statistics analysis
In a first step, we analyze data through the use of descriptive statistics. Results are presented in the form of a summary table.
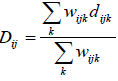
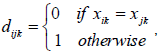
We then analyze characteristics jointly through a cluster analysis to explore whether we may classify farms into similar groups. Specifically, we conduct a hierarchical cluster analysis. We use Ward’s method for agglomeration over an N x N dissimilarity matrix, where N is the number of observations (Ward, 1963). The matrix contains as elements the Gower dissimilarity measure between observations which is designed to accommodate both continuous and binary characteristics (Gower, 1971). It is defined as
where Dij is the dissimilarity between observation i and j as the sum of the dissimilarities dijk between observation i and j with respect to each characteristic k = {1, …, K} (StataCorp, 2007; Everitt et al., 2011). wijk is a binary indicator that takes on the value 1 if observations i and j have non-missing entries for characteristic k and is 0 otherwise. We only include observations that have non-missing entries for all K characteristics since all Dij are then calculated over the same set of characteristics. Thus, wijk always takes on the value 1, and the denominator equals K. Only including observations with non-missing entries has the side effect of reducing the sampling set to 108 observations, since not all farmers responded to all questions.
The specification of dijk differs between binary and continuous characteristics. For binary characteristics,
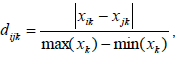
where xik and xjk are the values that characteristic k takes on for observations i and j, respectively. For continuous characteristics,
which standardizes the absolute distance between xik and xjk by the range of values that characteristic k takes on over all observations.
When calculating the Gower dissimilarity measure, highly correlated characteristics may bias results as the impact of these characteristics on the measure is overemphasized with respect to the remaining characteristics (Backhaus et al., 2006: 550). However, none of the 528 unique characteristics pairs (based on 33 characteristics over which we conduct the cluster analysis) display a correlation coefficient above 0.6 and only 11 a correlation coefficient above 0.4.
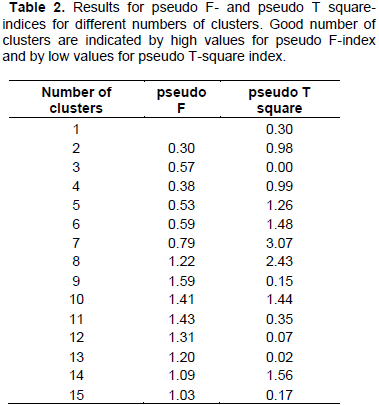
We chose the number of clusters by calculating the pseudo F index (Calinski and Harabasz, 1974), where large values indicate a good number of clusters, and the pseudo T squared Je(2)/Je(1) index (“pseudo T squared index”) (Duda and Hart, 1973), where low values indicated a good number of clusters, and by subsequently identifying local maxima and minima, respectively. As a robustness check we require that both indices display local optima at the same number of clusters.
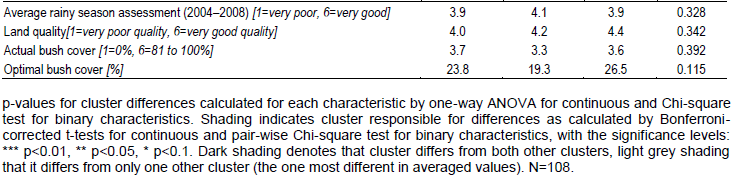
Subsequent to the cluster analysis, we examine in regards to which characteristics the clusters differ significantly overall and exactly which clusters are responsible for the significant difference. For continuous characteristics, we thereto conduct one-way analyses of variance (ANOVA) followed by pair-wise, Bonferroni-corrected t-tests. For binary characteristics, we conduct Chi-square tests followed by pair-wise, Bonferroni-corrected Chi-square tests. All analyses are performed using the Stata/SE 10.1 statistical software package.
Descriptive statistics
A comprehensive overview of descriptive statistics is given in Table 1. Here we briefly discuss these statistics, beginning with rainfall risk, risk management and sustainability, and closing with farmers’ preferences, normative views and personal, farm and environmental features.
Rainfall risk
The rainfall risk is rated above average with a value of 4.6 (out of 6.0) on the Likert scale. The risk is heterogeneous across farmers as indicated by a standard deviation of 1.2.
Risk management strategies
In terms of risk management, farmers predominantly consider on-farm management strategies to be important in the management of risky rangeland production. Especially those on-farm strategies where the decision process is in the hand of farmers are rated high, that is, resting rangeland (4.7 on a six-item Likert-scale), additional feed (4.7), breed adaptation (4.5) and production system adaptation (4.4). In contrast, the remaining on-farm strategy, rangeland size increase is rated considerably lower (3.3), potentially because the application of this strategy depends on third parties offering land for sale or renting.
Financial risk management strategies are of less importance. Checking accounts as buffer (4.7) and off-farm income (4.0) are rated relatively high. In contrast, farmers seem to be skeptical towards the remaining financial management strategies: advances on livestock sales (3.1), loans for covering operating losses (3.0) and investment into agricultural derivatives (2.4) are among the lowest rated strategies.
Heterogeneity in ratings across farmers is considerable for most risk management strategies (standard deviations of 1.6 to 1.8).
This finding is in accordance with our aforementioned statement that strategies may (in part) be substitutes with respect to risk management, which allows for considerable leeway in whether individuals farmers apply a specific strategy or not.
Sustainability
Average grazing capacity is 0.080 LSU/ha and is lower than the historic 0.1 LSU/ha that was found on average prior to the mid 1960s (de Klerk, 2004: 21). The rangeland thus (on average) has not been managed sustainably. However, grazing capacity is, with a standard deviation of 0.040 LSU/ha, highly variable across farms, suggesting large differences in sustainability of individual farms.
Risk and time preferences
Farmers are on average risk averse, as indicated by a value of 4.8 (out of 7.0) for the risk preference index. In another study on the same database, the authors calculate for the average farmer a point estimate for the coefficient of relative risk aversion (CRRA) of 0.78 which likewise indicates risk aversion (Olbrich 2012). The estimate is slightly higher than the value of 0.54 reported for a field study of semi-subsistence farmers in Ethiopia, India and Uganda by Harrison et al. (2010), but in range with the value of 0.79 provided for the Danish population by Andersen et al. (2006).
Farmers are of intermediate impatience as exemplified by a value of 3.2 (out of 6.0) for the time preference index. Calculating point estimates of discount rates – to mirror the aforementioned point estimates of risk aversion – has not yet been done by the authors in a separate publication, and is beyond the scope of this publication.
Normative views of sustainability
Farmers believe that ecosystem condition should be sustained at or above a threshold of 0.082 LSU/ha and annual net income at or above a threshold of N$ 275,791.
Heterogeneity for both the normative view on ecosystem condition and income is high with standard deviations of 0.045 LSU/ha and N$ 206, 97, respectively.
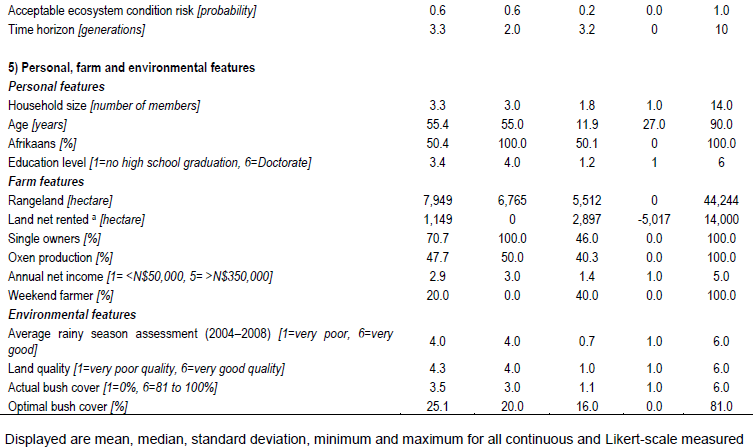
In regards to the time horizon for sustaining ecosystem condition and income we find that 8.7% of farmers do not care about the future beyond their own generation, whereas 16.1% of farmers have a very long outlook, i.e. ten generations or more. On average, farmers indicated that ecosystem condition and income ought to be sustained for the 3.3 generations following their own generation, that is, for the generations of their children, grandchildren, and great-grandchildren. This is the timeframe that most farmers are expected to experience in their lifetime.
Acceptable ecosystem condition risk and acceptable income risk are both centred at an intermediate probability value of 0.6, that is, a probability of 60% that grazing capacity (income) falls below the specified threshold is still acceptable. Distributions of both probability thresholds are, however, spread out over the whole range of possible values, as exemplified a standard deviation of 0.2 for both characteristics, revealing large heterogeneity across the farmers’ population.
Personal, farm and environmental features
Farmers are very heterogeneous in age and the distribution is centred within the advanced age: average age of farmers is 55.4 years with a standard deviation of 11.9 years. The majority of farmers (50.4%) are of Afrikaans decent, with the remaining farmers being predominantly of German descent. Education is of high importance among farmers with a median of 4.0, indicating that half of the farmers have a university degree (bachelor, master or doctorate). Household size is on average 3.3 members.
Farms are typically large with an average area of rangeland of 7,949 ha, but individual farms are very heterogeneous in size as indicated by a standard variation of 6,765 ha. On average, farmers rent 1,149 ha of farmland in addition to the land they own. Farms are typically operated by a single owner (70.7%) as opposed to forms of joint ownership (e.g. corporations, partnerships or cooperatives). The most common production system is oxen production (pursued by 47.7% of farmers), while other production systems such as weaner production or speculation production are of less importance. Farmers earn a considerable higher income than other Namibians: median income among farmers is N$ 150,001 to N$ 250,000 which is much greater than the 2009/2010 Namibian median household income of N$ 40,744. Not all farmers earn this income primarily from their farm: 20% of farmers are weekend farmers that operate the farm only on the weekend (as a hobby or secondary occupation) while earning their livelihood primarily in a different occupation.
Farmers assess the previous five rainy seasons as above average as indicated by a value of 4.0 (out of 6.0). Land quality (e.g. soil conditions) is likewise assessed to be above average with a value of 4.3 (out of 6.0). Almost half of the farms (48.2%) have actual bush cover that is intermediate or higher (that is, 41% or more of the farm covered by bushes).Finally,the bush covers farmers consider optimal on their farms is a low to medium cover (an average of 25% of the farm being covered by bush) and thus lower than actual bush cover.
Cluster analysis
In reporting results for the cluster analysis, we make three terminological simplifications for convenience: firstly, we say “characteristics of clusters” when we, of course, actually refer to characteristics of the farmers or farms included in the respective clusters; secondly, the values we report are cluster-averaged values, but we do not explicitly refer to them as “averaged”; thirdly, when we state that a cluster is “different” we always mean, unless otherwise noted, that the discussed clusters differ significantly from all other clusters.
As previously mentioned, we excluded in the cluster analysis all observations which had a missing entry in any of the analyze characteristics. As a consequence, only 108 observations (out of 398) were used in the cluster analysis.
Choice of cluster number
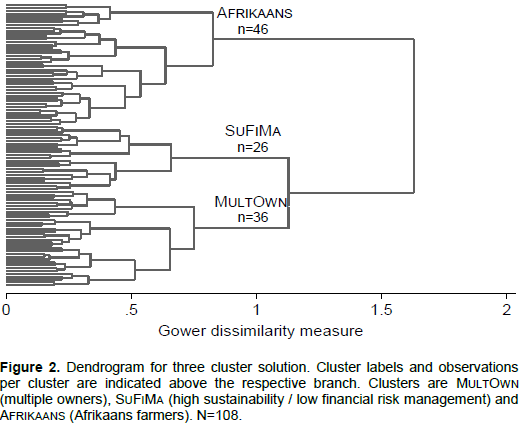
Both the pseudo F- and the pseudo T-index have optima jointly at a number of three and nine clusters (Figure 2, Table 2). At three clusters the pseudo T-index has a global minimum while the pseudo F-index has only a local maximum.
Conversely, at nine clusters the pseudo so large that individual clusters are distinct in only very few characteristics; secondly, under this solution we encounter clusters with fewer than 7 observations, making the validity of the analysis doubtful due to the low F-index has a global maximum and the pseudo T-index’ only a local minimum. Examining both indices thus does not give a unique solution to the optimal number of clusters. Nonetheless, we report the three cluster solution as the nine cluster solutions has two disadvantages: firstly, it is not very insightful as the number of clusters is number of observations.
Cluster SuFiMa
This cluster is best described by high sustainability and low financial risk management (“SuFiMa”). It is the smallest in that it contains 26 out of the 108 analyzed farms (Table 3). It is also the most distinct cluster, differing significantly from each of the two other clusters in 10 out of the 33 analyzed characteristics.
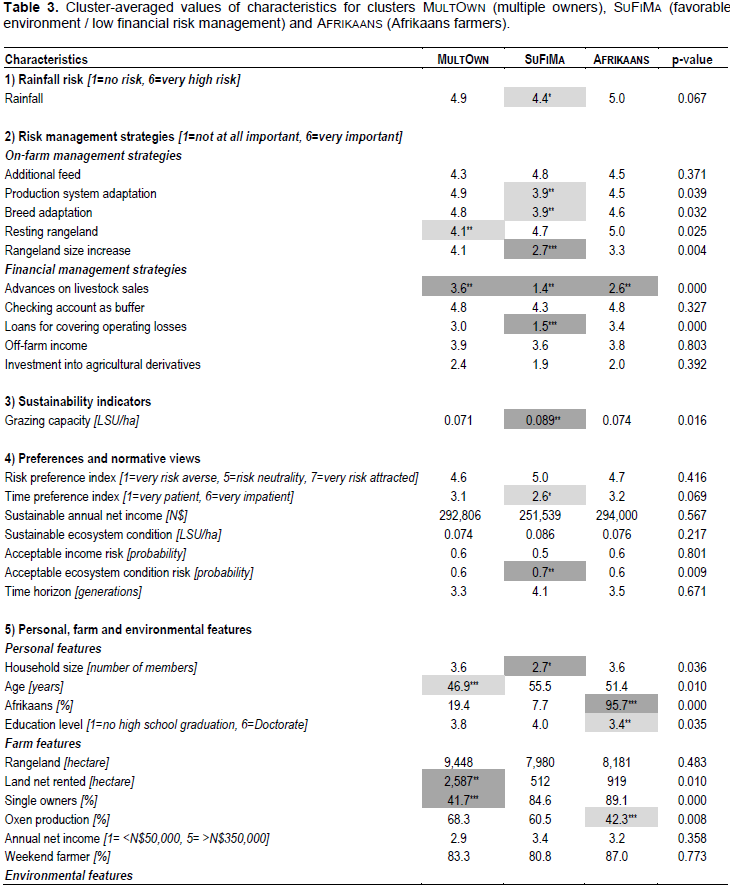
The cluster has the highest grazing capacity (0.089 LSU/ha; p<0.05) and thus the highest sustainability. In regards to risk management, it has the lowest ratings of the three clusters for all financial risk management strategies, albeit the differences are significant only for the strategies advances on livestock sales (1.4 on a six-item Likert-scale; p<0.05) and loans for covering operating losses (1.5; p<0.01). In contrast, it does not have the lowest ratings for all on-farm strategies, but only for three of these strategies: for rangeland size increase (2.7; p<0.1), albeit at only the 10% significance level; and for production system adaptation and breed adaptation (both 3.9; p<0.05), albeit differing in both strategies only from one other cluster. Finally, it also has the lowest rating of rainfall risk (4.4 on a six-item Likert-scale; p<0.1), but differs in the latter only at the significance level of 10% and only from one other cluster. Thus, of the aforementioned characteristics it is sustainability (via the proxy grazing capacity) and financial risk management that make this cluster distinct.
Cluster SUFIMA also has the most demanding normative views pertaining to acceptable grazing capacity risk (probability threshold of 0.7; p<0.05), possibly because farmers in this cluster experience low risk and can thus “afford” this more demanding normative view. Other normative views are not significantly different.
Finally, the cluster is distinct in two characteristics which are not obviously related to sustainability and management: it has the lowest number of household members (2.7 members; p<0.1) and it is the most patient (2.6 out of 6.0, p<0.1), albeit it is again significantly distinct in the latter characteristics from only one other cluster.
The cluster does not differ significantly in any other personal, farm and environmental features or in risk preferences. We especially note that it does not differ in income, and that it also does not differ in weekend farming (a criterion which, in Namibian everyday use, is typically employed to characterize farmers).
Cluster MULTOWN
Based on the distinct characteristics of cluster SUFIMA,the remaining two clusters are accordingly characterized by low sustainability and high financial risk management. Beyond this distinction, however, they also have their own distinct characteristics.
The next larger cluster with 36 farms is significantly distinct in five such characteristics and best characterized by multiple ownership (“MULTOWN”) as it has the highest proportion of multiple ownership (41.7% of single owners, corresponding to 58.3% multiple owners; p<0.01). It also has the highest area of (net) rented land (2,587 ha, p<0.05) and the highest area of rangeland, although the difference in the latter variable is not significant. We may interpret this as a tenuous indication that multiple owners have the means to operate altogether larger farms.
This cluster also differs from the other clusters in characteristics that are less obviously associated with multiple ownership: it has the highest rating of the strategy advances on livestock sales (3.6; p<0.05), the lowest rating of the strategy resting rangeland (4.1; p<0.05) and the youngest farmers (46.9 years; p<0.01), albeit it significantly differs in latter two characteristics from only one other cluster.
Cluster Afrikaans
The largest cluster with 46 farms is distinct in four characteristics. It is difficult to describe this cluster as we see no obvious connection between these characteristics; we opt to describe it as Afrikaans farmers (“AFRIKAANS”) as it exclusively consists of farmers of this ethnicity (p<0.01). Beyond this distinction, it has an intermediate rating of the strategy advances on livestock sales (2.6; p<0.05) and, differing significantly from one other cluster, has the lowest proportion of oxen production (42.3%; p<0.01) and the lowest education level (3.4 index points; p<0.05).
Summary of cluster analysis results
Altogether, we thus also observe heterogeneity of cattle farms when classifying them, albeit only one cluster of farms (namely SUFIMA) is very distinct. In accordance with the key distinct characteristics of this cluster, classification is predominantly driven by sustainability and financial risk management. To a lesser extent, classification is driven by organizational structure or ethnicity, the defining characteristics of the remaining two clusters. Rainfall risk, risk and time preferences as well as normative views play only a marginal role for classification. Finally, we especially note again that income does not drive classification at all.
In this paper we Wecharacterize commerciall cattle farms in Namibia, a prime case of livestock farming in semi-arid rangelands, according to 1) perceived rainfall risk, 2) risk management, 3) the farm’s sustainability, 4) risk and time preferences and normative views of sustainability, and 5) personal, farm and environmental features. We find that cattle farms are highly heterogeneous in a wide range of characteristics.
When classifying farms in a cluster analysis, we also find heterogeneity as exemplified by the identification of three separate clusters (“SUFIMA”, “MULTOWN” and “AFRIKAANS”). More specifically, results from the cluster analysis show that cattle farms are classified mainly by their sustainability and the farmer’s financial risk management, but not by the farmer’s income: the most distinct of the three identified clusters is characterized by high grazing capacity (a proxy for high sustainability) and low financial risk management, but not by high or low income. In other words, our results suggest that sustainability and financial risk management are inversely related while income levels appear to be unaffected by the choice of risk management technique. One possible explanation, is that financial risk management may provide income risk reduction to a similar extent than on-farm management over the short term; however, it may simultaneously reduce long-term sustainability since farmers neglect the adequate on-farm management of their rangeland. Such a link has already been proposed in theoretical work (Quaas et al., 2007; Quaas and Baumgärtner, 2008, 2012; Baumgärtner and Quaas, 2009a; Müller et al., 2011), and our empirical results thus nicely conform to these theoretical findings.
It is also interesting to note which other characteristics (apart from income) that are not driving farm classification. Firstly, risk and time preferences as well as normative views of sustainability are only marginally important for classification. Based on the observed differences in management, one might hypothesize that preferences and normative views, which are key behavioural determinants, are not related to management behaviour in Namibian cattle farming. Regarding preferences, this is controversial and we do not expect that such a hypothesis will be upheld under more in-depth scrutiny than can be achieved through a cluster analysis. Regarding normative views, however, we indeed find no evidence that they impact on farm management in an in-depth analysis (Olbrich et al., 2014). Secondly, weekend farming, a characteristic typically employed by Namibian farmers and decision makers for characterization of farms, also does not drive our classification. It thus seems that it is only of minor importance for characterization in comparison to other characteristics.
Having provided these observations, we note the limitations of the cluster analysis: it cannot be used to make definite statements concerning the causal relationship between single characteristics and thus cannot be a substitute for an in-depth analysis. Most importantly, we cannot clarify the exact relationship between sustainability, financial risk management and income without further analysis, as we have, for example, done in respect to normative views (Olbrich et al., 2014).
Altogether, this study is the first to provide a characterization of Namibian commercial cattle farms in respect to risk, management and sustainability. It furthers the understanding of the system and provides the basis for more in-depth analyses. Finally, it highlights issues that may warrant close attention and may ultimately contribute to the development of policies that promote sustainability of commercial cattle farming in Namibia.