ABSTRACT
This study was conducted to investigate historical climate dynamics and the resultant risks at four sites (Meki, Melkassa, Miesso and Ziway) in the Central Rift Valley of Ethiopia. It involved analysis of rainfall and temperature data in the study areas. The results showed the existence of high inter-annual rainfall variability within seasons and sites. The number of rainy days exhibited a declining trend at Meki in both belg (FMAM) and kiremt (JJAS) seasons and an increasing trend at Melkassa in the belg season; while an increasing trend was observed at Miesso and Ziway in the kiremt season, and no change in trends was observed in the belg season at both sites. The minimum and maximum temperature showed an increasing trend at Miesso and Ziway, whereas no change was observed at Melkassa. As opposed to the cessation of the rainfall, onset dates of rainfall were highly variable at all sites. The median length of the growing period was found to be 101, 88, 118 and 104 days at Meki, Melkassa, Miesso and Ziway, respectively. The obtained results will certainly help the farming community and the agricultural sector to make a decision for the best management scheme in the central rift valley of Ethiopia.
Key words: Climate change, risk, rainfall, temperature, crop production, Central Rift Valley, Belg, Kiremt.
Increasing fossil fuel burning and land use changes emits large quantities of greenhouse gases into the atmosphere. These greenhouse gases include carbon dioxide (CO2), methane (CH4) and nitrous oxide (N2O). A rise in these gases is causing a rise in the amount of heat from the sun withheld in the Earth’s atmosphere, heat that would normally be radiated back into space. This increase in heat load has led to the greenhouse effect resulting in climate change (UNFCCC, 2007).
The fourth assessment reports of the Inter-governmental Panel on Climate Change (IPCC, 2007) dispels many uncertainties about climate change.
Warming of the climate system is now unequivocal. It is clear that global warming is mostly due to man-made emissions of greenhouse gases (mostly CO2). Over the last century, atmospheric concentrations of carbon dioxide has increased from a pre-industrial value of 278 ppm to 379 ppm in 2005, and the average global temperature has risen by 0.74°C (IPCC, 2007). There is now strong evidence showing that the earth’s climate is changing mainly as a result of the increasing concentration of greenhouse gases in the atmosphere emitted from various human activities (NAPA, 2007).
Agriculture is the source of livelihoods for the majorityof the Ethiopian population and the base of the national economy. It employs more than 80% of the labor force and accounts for 45% of the GDP, as well as 85% of the export revenue (MoFED, 2006). However, Ethiopian agriculture is dominated by small-scale and subsistence farming systems and it is heavily dependent on rainfall, as irrigation is currently applied to only 3% of arable land. Thus, the dependency of farmers on rainfed agriculture has made the country’s economy extremely vulnerable to the aberrations of weather and climate (Kidane et al., 2006).
A recent vulnerability and poverty mapping study of Africa (Orindi et al., 2006; Stige et al., 2006) put Ethiopia as one of the most vulnerable countries to climate change with the least capacity to respond. Rainfall variability and associated drought have been major causes for the country’s food shortages. Nationally, the link between drought and crop production is widely recognized, but little is known about how climate change is affecting crop production and what strategies households are employing (Mahmud et al., 2008).
The Ethiopian Central Rift Valley (CRV) is one of the regions in the country which is affected by climate variability and change. It covers a variety of agro- ecologies characterized by extensive areas of low rainfall and limited areas receiving adequate rainfall. The rainfall pattern in the CRV is bi-modal in nature and largely influenced by the annual oscillation of the inter-tropical convergence zone, which results in warm, wet summers (with most of the rainfall occurring from June to September) and dry, cold and windy winters. The main rainy season accounts for 70 to 90% of the total annual rainfall. Minor rain events, originating from moist south-easterly winds, occur between March and May (Hengsdijk and Jansen, 2006).
Crop production in semi-arid regions is largely determined by climatic and soil factors. Among the climatic factors, the distribution and amount of rainfall affect the agricultural systems of the CRV. Therefore, rainfall is considered a limiting factor in these areas and many of the farm decisions are made based on the time of the onset of rainfall. The onset and distribution of rainfall governs crop yields and determines the choice of the crops to be grown (Stelio, 2004). The cultivated land in the CRV is mostly located on the valley floor and the major field crops grown include: teff, barley, maize, sorghum, lentils, chickpeas and field peas. The most important vegetables grown under irrigation include the common bean, tomato, onion, cabbage and broccoli (Moti, 2002).
In general, the inter-annual and inter-seasonal climate variability coupled with climate change are the main causes of fluctuating annual production with occasional drastic reduction of crop yields in the region. However, the dearth of information on the degree of climate variability and change; and information on climate risks on agricultural production, such as rainfall onset dates, end dates, duration and dry spell lengths, which together make up the overall rain feature for field crop management options in the study areas is extensive. Therefore, this study was undertaken to analyze risks of climate in crop production in the Central Rift Valley of Ethiopia, using long term rainfall and temperature data.
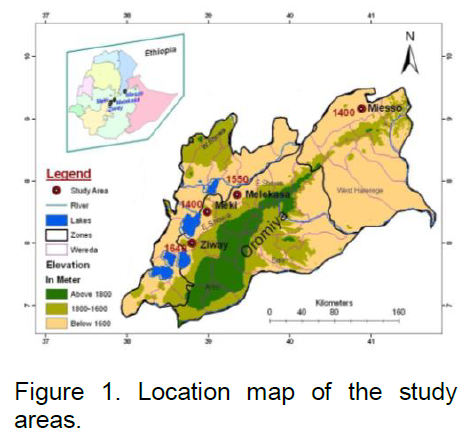
The areas covered by this study were Meki (latitude 8° 15’ N, longitudes 38° 82’ E and altitude 1400 m.a.s.l), Melkassa (latitude 8° 4’ N, longitude 39° 32’ E and altitude 1550 m.a.s.l), Miesso (latitude 9° 23’ N, longitude 40° 75’ E and altitude 1400 m.a.s.l). Ziway (latitude 7° 93’ N, longitudes 38° 72’ E and altitude 1640 m.a.s.l), all located in the Central Rift Valley of Ethiopia. The choice of the districts was based on data availability, farming systems and representativeness of agro-ecological settings in the Central Rift Valley (Figure 1).
Climate change and variability analysis
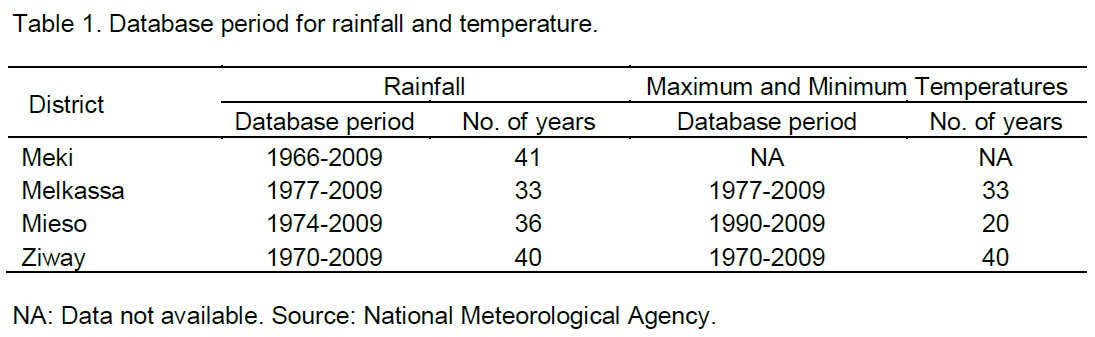
Secondary data obtained from the National Meteorological Agency was used for climate change and variability analysis. The data base period for all the study sites is shown in Table 1.
Rainfall and temperature variability and change analysis
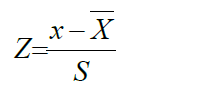
The annual and seasonal pattern of rainfall and temperature were examined for each district by processing daily rainfall and temperature data using the INSTAT version 3.36 (Stern et al., 2006). The rainfall and temperature variability at each site were determined by calculating mean, standard deviation and the coefficient of variation (CV). The CV was calculated as the ratio of the standard deviation to the mean rainfall in a given period. The standardized anomaly (Z) for rainfall and temperature was calculated as:
Where x = annual total rainfall or annual mean temperature

= long term mean
S = standard deviation of the entire series
Onset and cessation of rain, probability of dry spells and length of growing season analysis
The onset of rain (a successful planting date) was defined as the first occasion after 1st March when the rainfall accumulates for three consecutive days and rainfall is at least 20 mm and no dry spell of more than seven days in the next 30 days (Sivakumar, 1988; Kindie and Walker, 2004). To analyze the onset of wet and dry spells, a first order Markov chain model was fitted to get more than 30 years of data for each site using the INSTAT version 3.36. The daily rainfall data was processed to give maximum dry spell lengths in the next 30-day periods, starting from the onset of rain for each site. Probabilities of the maximum dry spell lengths exceeding 5, 7, 10, 15 and 20 days over the next 30 days from planting, were calculated to get an overview of the drought at the study area for the whole year. The end of the rainy season (defined as the occurrence of a day after first September when the soil water drops to 10 mm m-1) was determined by using the water balance dialogue in the INSTAT climatic guide (Stern et al., 2006). Subsequently, the length of the growing period in the study areas was determined as the difference between the onset date and end date (Stern et al., 2006; Kindie and Walker, 2004).
Climate variability and change analysis
Rainfall variability and change
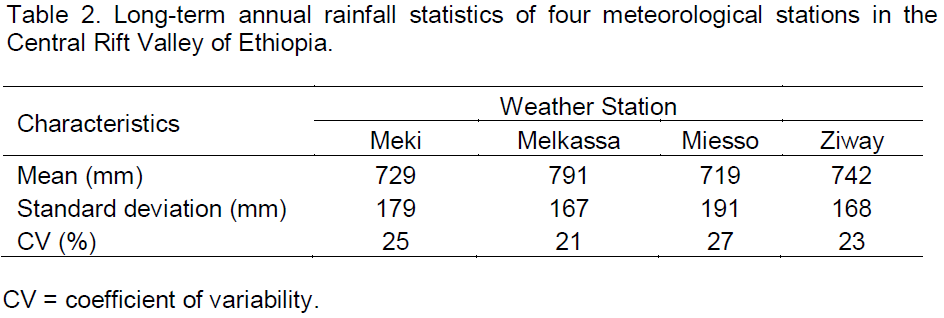
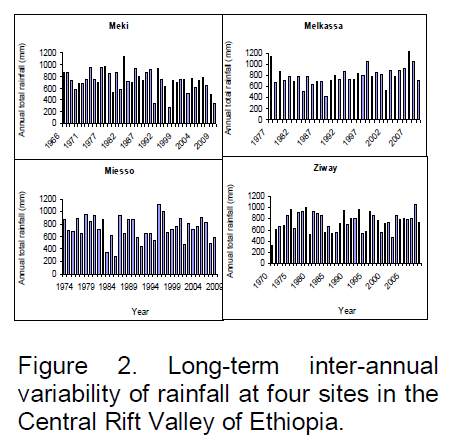
The long-term rainfall data for the four sites are presented in Table 2. The mean annual rainfall of the study areas ranged from 719 mm (Miesso) to 791 mm (Melkassa) and varied slightly from district to district with a standard deviation ranging from 167 (Melkasa) to 191mm (Miesso) and CV ranging from 21(Melkassa) to 27 % (Miesso). This indicates that the rainfall at Miesso is more variable than the other sites.
A time series bar chart indicates high inter-annual rainfall variability among the districts (Figure 2). The annual total rainfall ranged from 281 to 1131 mm at Meki, 425-1234 mm at Melkassa, 271 to 1111 mm at Miesso and 314 to 1042 mm at Ziway (Figure 2). These annual rainfall figures indicate that Melkassa has a greater total annual rainfall than the rest of the sites studied. The highest and lowest total annual rainfall years were 1983 and 1995 at Meki, 2007 and 1989 at Melkassa, 1996 and 1986 at Miesso and 2008 and 1970 at Ziway, respectively (Figure 2).
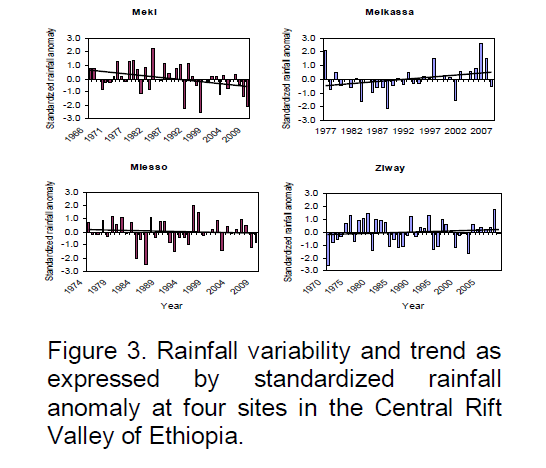
The standardized rainfall anomaly gives a clear picture of average (normal), above average (wet) and below average (dry) years (Figure 3). As can be seen from Figure 3, the four stations experienced both dry and wet years over the last 33 (Melkassa) and 41 years (Meki). For instance, Meki experienced dry conditions in 1991, 1995 and 2009, whereas it enjoyed wet conditions in 1983. The years that gave above average rainfall at Melkassa were 1977 and 2007 as opposed to 1989 when dry conditions prevailed. Miesso experienced dry conditions in 1984 and 1986 and wet conditions in 1996.
The years that dry and wet conditions prevailed in Ziway were 1970 and 2008, respectively (Figure 3). Moreover, the linear trend line for Meki clearly demonstrates a general decline in rainfall since 1966, whereas an increasing trend was observed for Melkassa. On the other hand, there was little or no change in the rainfall trend at Miesso and Ziway (Figure 3).
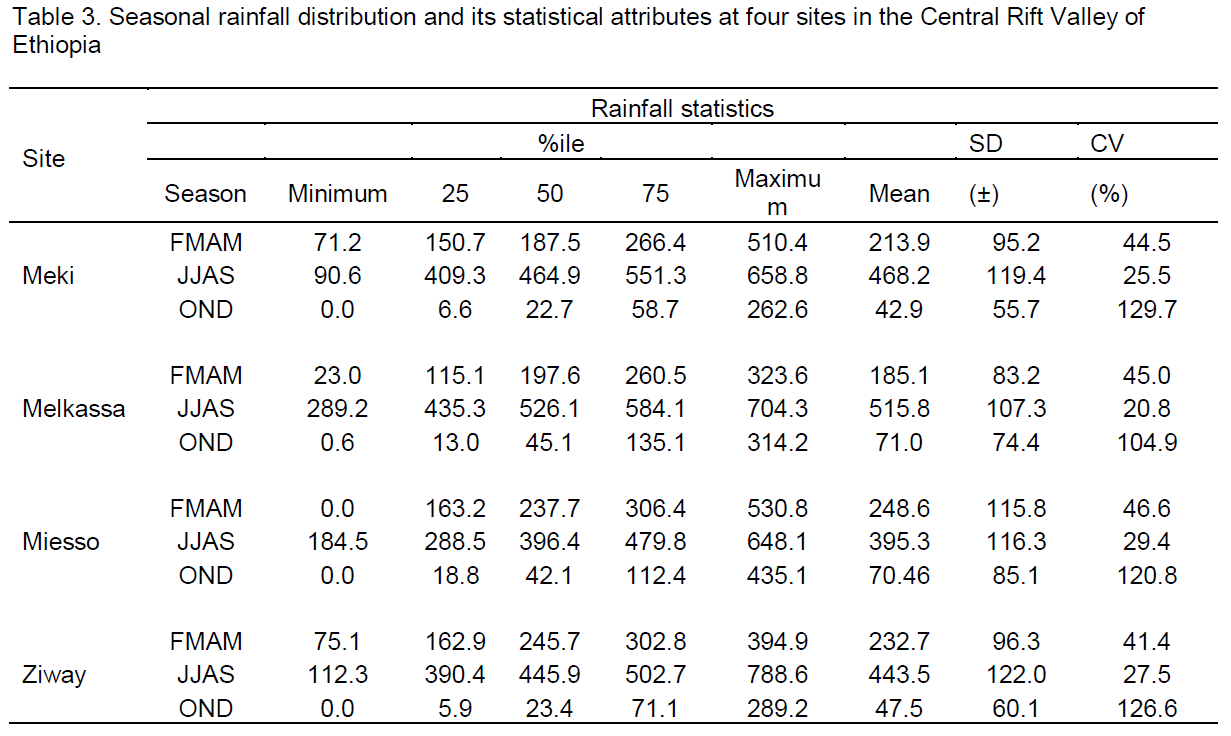
The bimodal pattern of rainfall at the study sites is presented in Table 3. The first rainy season (Belg) extends from the end of February to May (FMAM), while the second (Kiremt) runs from June to September (JJAS). The long-term minimum FMAM season rainfall total ranges from 0 mm (Miesso) to 75.1 mm (Ziway), while the long-term maximum rainfall ranges from 323 mm (Melkassa) to 531 mm (Miesso). In 1 out of 4 years, the FMAM season rainfall ranges from 115.1 mm (Melkassa) to 163.2 mm (Miesso) with an upper quartile value of 260.5 mm (Melkassa) to 306.4 mm (Miesso). The median and average seasonal rainfall for belg season ranges from 187.5 mm (Meki) to 245.7 mm (Ziway) and 185.1 mm (Melkassa) to 248.6 mm (Miesso), respectively.
The belg (FMAM) exhibited higher rainfall variability (41 to 47%), compared to the kiremt rainfall variability (21 to 29%) at the four sites (Table 3). The analysis also shows that the belg rainfall was more variable at Miesso, while it was much less variable at Ziway. Miesso had the most variable kiremt rainfall, while Melkassa varied the least for the same season. Even though the study areas are located in close proximity, they differed in the amount of seasonal rainfall distribution and the degree of variability of seasonal rainfall. On the other hand, the dry season (Bega) in the study area extends from October to December (OND). The long term minimum seasonal rainfall total is 0 mm in all sites and the maximum seasonal rainfall total ranges from 262 mm (Meki) to 435mm (Miesso). The Bega rainfall exhibits the highest rainfall variability (105 to 130%) at the four sites, compared to Belg and Kiremt seasons, even if the season was dry under normal conditions (Table 3).
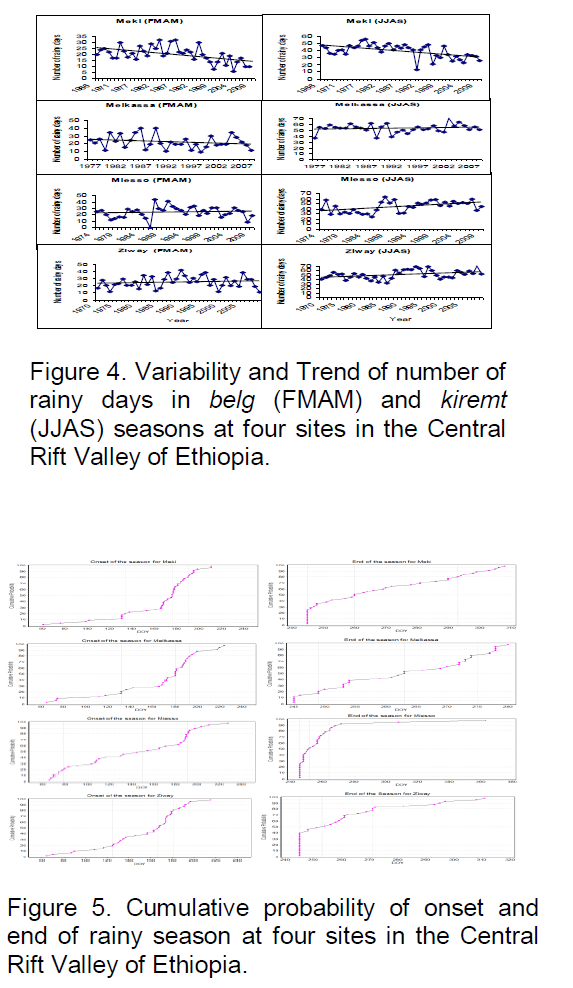
The seasonal rainfall analysis on the number of rainy days is presented in Figure 4. Number of rainy days shows a declining trend in both the belg and kiremt seasons at Meki, followed by the belg season at Melkassa. On the other hand, the number of rainy days showed an increasing trend in the kiremt season at Melkassa, Miesso and Ziway.
Onset and cessation of rainfall, length of growing season and dry spell risk analysis
The analysis of rainfall for agricultural purposes mustinclude information on the trends or changes in precipitation; the start, end and length of the rainy season; and the distribution of rainfall amounts through the year, and the risk of dry spells (Stelio, 2004).
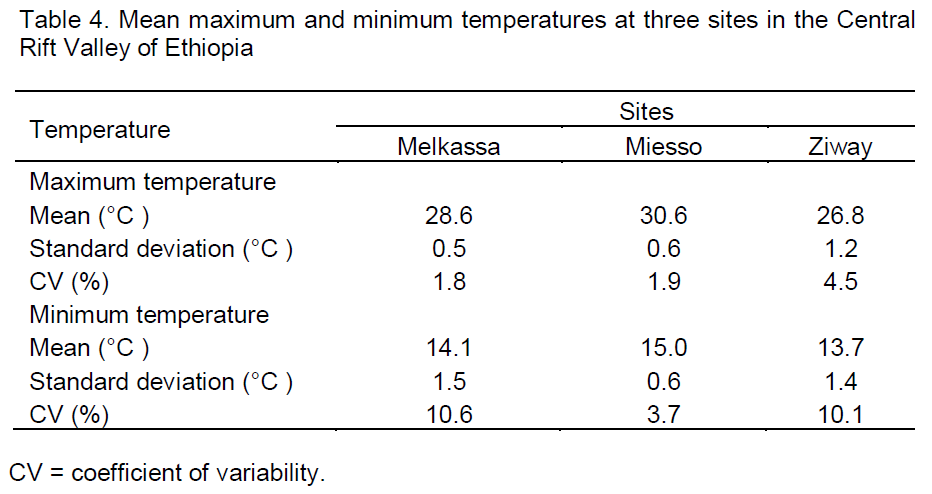
The cumulative probabilities of onset and end dates and length of the growing period in the study areas are presented in Figures 5 and 6 respectively. The variability of onset dates for the four districts was higher, compared to end dates and lengths of the growing period. At Meki, the rain started before May 10 (131 DOY) in 20% of the time, before June 21 (173 DOY) 50% of the time and before July 6 (188 DOY) 80% of the time. In the case of Melkassa, the rain started earlier than May 11 (132 DOY) in one out of five years, earlier than June 25 (177 DOY) 50% of the time and 80% of the time in four out of five years as it started before July 9 (191 DOY).
On the other hand, at Miesso, the rain started earlier than March 18 (78 DOY) 20% of the time, indicating that planting earlier than 18 March is possible only once in every five years. The chance of planting before June 3 (155 DOY) and July 10 (192 DOY) at Miesso is 50 and 80%, respectively. The chances of effective planting before April 19 (110 DOY), June 14 (166 DOY) and June 24 (176 DOY) at Ziway were 20, 50 and 80%, respectively (Figure 5). A further note that could also be made from the data in Figure 5 is that rainfall duration is dependent mainly on the onset date. For 50 to 80% of the time, the rain ended in all districts in the month of September, except Meki where it extended up to the month of October 80% of the time. The median (50%) length of the growing period was found to be 101, 88, 118 and 104 days at Meki, Melkassa, Miesso and Ziway respectively. For 80% of the years studied, the length of the growing period did not exceed 138, 121, 175 and 141 days at Meki, Melkassa, Miesso and Ziway, respectively (Figure 6).
Overall, except for the rainfall onset dates of seasons, the four stations bear similar patterns for the end dates and lengths of growing periods. Culturally, the first planting time for the study area is in the month of March in Miesso, but the probability of having rainfall onset in the beginning of this month is less than 10 % in all the other three sites.
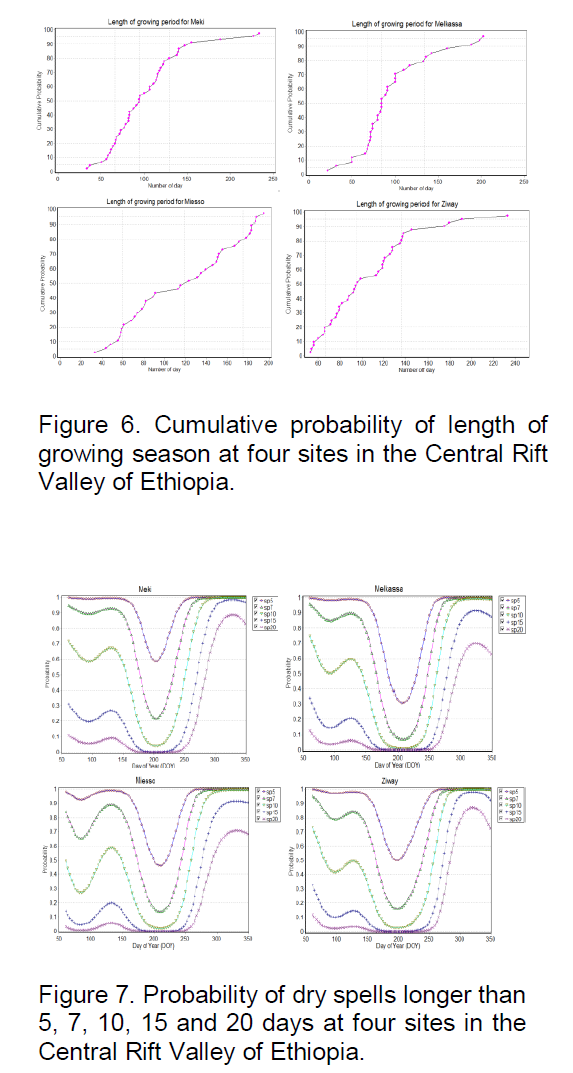
The ‘parabolic-type’ curves explain that the probability of dry spells longer than 20 days from March to September is less than 10% in all districts, whereas they show a certain degree of an upward slope in April and May and descend to zero from the middle of June to the middle of July. The probability of dry spells more than 15 days is less than 10% for Miesso, and less than 20% for the rest of the districts in March. The dry spell graphs show a variation across sites in the probability of dry spells longer than 10 days (Figure 7). Moreover, the probability of five day dry spells stays at 100 % during the earlier and later months in the growing season. All the dry spell length probability curves converge to their minimum only during the peak rainy period (July and August) for all districts and turn upward again around September, indicating the end of the growing season (Figure 7).
Temperature variability and change
The mean annual maximum temperature at the three sites (Melkassa, Miesso and Ziway) ranged from 26.8 to 30.6°C, while the mean minimum temperature ranged from 13.7 to 15.0°C (Table 4). The minimum temperature shows a higher variability than the mean maximum temperature at all the sites (Table 4). The maximum temperature indicates a clear increasing trend at Miesso and Ziway but it remained static at Melkassa. On the other hand, the minimum temperature shows a slight increasing trend at Miesso and Ziway, but a clear decreasing trend at Melkassa (Figures 8 and 9).
The increasing trend of both mean maximum and minimum temperatures particularly at Miesso and Ziway and increase in maximum temperature at Melkassa indicate a clear warming of the atmosphere in the regions. An increase in maximum and minimum temperatures is taken as a good indicator of global warming in a given area (IPCC, 2001).
There was high inter-annual rainfall variability within the four districts. All districts experienced both very dry and very wet years in their meteorological record history. The trend line analysis exhibits a decreasing tendency of rainfall at Meki and an increasing tendency at Melkassa. There was no change in annual rainfall trends at Miesso and Ziway. The belg (FMAM) season had higher rainfall variability than the kiremt season (JJAS) at the four study sites. Meki exhibited a dramatic decline in the trend of number of rainy days in both seasons, while a slight declining trend was observed in the belg season at Melkassa. On the other hand, a reasonable increment was observed at Miesso and Ziway in the kiremt season, while there were no changes in the trend of rainy days in the belg season at both these sites.
Onset, cessation, dry spells and length of growing season analyses have shown that except for the onset date of the rainfall season, the districts have similar patterns for end dates and lengths of the growing period. In 50 to 80% of the time, the rains ended in September in the study sites except for Meki where it ended in the month of October. For 50% of the time, the length of the growing period is 3 to 4 months. Given that 1st March is a potential planting date, the probability of getting dry spells longer than 20 days from March to September is less than 10% at all sites, while the probability of getting dry spells longer than five days is above 50% for all sites, except Melkasaa. The long-term temperature analysis shows an alarming increase in both maximum and minimum temperatures at Miesso followed by Ziway. However, no change in minimum temperature was observed at Melkassa, although the maximum temperature exhibits an upward trend.

The result of this study will help the farming community in their day-to-day agricultural activities and the agricultural sector will also benefit for the best agricultural management scheme and decision making in the central rift valley of Ethiopia. The current study clearly indicates a high inter-annual rainfall variability in the study areas and associated climate risks. This calls for consideration of climate information utilization by the farmers. Therefore, research in the utilization of climate information by farmers in the study area is suggested for further study.
The authors have not declared any conflict of interest.
REFERENCES
|
Kidane G, Abebe T, Tibebe D (2006). Estimating crop water use and simulating yield reduction for maize and sorghum in Adama and Miesso districts using the cropwat model. CEEPA Discussion University of Pretoria, Pretoria, South Africa. P. 31. |
|
|
Kindie T, Walker S (2004). Matching of crop and environment for optimal water use: the case of Ethiopia. Phys. Chem. Earth 29:1061-1067.
Crossref |
|
|
|
Hengsdijk H, Jansen H (2006). Agricultural development in the Central Ethiopian Rift Valley: A desk-study on water-related issues and knowledge to support a policy dialogue. Plant Research International B.V. Wageningen, the Netherlands. |
|
|
|
IPCC (2007). Climate Change 2007 Synthesis Report. Cambridge University Press. Cambridge. |
|
|
|
IPCC (2001). Climate Change Impacts, Adaptation, and Vulnerability: Contribution of Working Group II to the Third Assessment Report. Cambridge University Press. Cambridge. |
|
|
|
Mahmud Y, Salvatore DF, Temesgen D, Claudia R, Gunnar K (2008). The impact of climate change and adaptation on food production in low- income countries evidence from the Nile Basin, Ethiopia. International food policy research institute Discussion P. 00828. Washington, DC. |
|
|
|
MoFED (2006). Survey of the Ethiopian economy. Addis Ababa, Ethiopia. |
|
|
|
Moti J (2002). Inter locked markets and intensity of input use in vegetable production: A case around Lake Ziway, Oromiya region, Ethiopia. MSc thesis Wageningen University, Netherland. |
|
|
|
NAPA (2007). The Federal Democratic Republic of Ethiopia, Ministry of Water Resources, and National Meteorological Agency, Addis Ababa, Ethiopia. |
|
|
|
Orindi V, Ochieng A, Otiende B, Bhadwal S, Anantram K, Nair S, Kumar V, Kelkar U (2006). Mapping Climate Vulnerability and Poverty in Africa. Nairobi, Kenya pp. 1-127. |
|
|
Sivakumar MVK (1988). Predicting rainy season potential from the onset of rains in southern Sahelian and Sudanian climatic zones of West Africa. Agric. For. Meteorol. 42:295-305.
Crossref |
|
|
|
Stelio P (2004). Trends of precipitation in Cyprus rainfall analysis for Agricultural Planning. Meteorological Service, Nicosia, Cyprus. P. 1418. |
|
|
|
Stern R, Rijks D, Dale I, Knock J (2006). Instat climatic guide. United Kingdom, England. |
|
|
|
Stige LC, Stave J, Chan K, Ciannelli L, Pattorelli N, Glantz M, Herren H, Stenseth N (2006). The Effect of Climate Variation on Agro-Pastoral Production in Africa pp. 3049-3053. |
|
|
|
UNFCCC (2007). Impacts, vulnerabilities and adaptation in developing Countries. Martin-Luther-King-Strasse 853175 Bonn, Germany. pp. 8-14. |