ABSTRACT
Maize (Zea mays L.) production in the Sudan savannah agro-ecological zone of Ghana is hindered by erratic rainfall and low soil fertility. This study was conducted to refine profitable fertilizer recommendations for maize production on a selected benchmark soil in Sudan savannah agro-ecological zone using Decision Support System for Agro-technology transfer (DSSAT). Maize variety Obaatanpa was used for the experiment and the rates of N P K nutrients evaluated were 0-0-0, 0-90-90, 40-90-90, 80-90-90, 120-0-90, 120-45-90, 120-90-90, 120-90-0, 120-90-45 and 160-90-90 kg ha-1. Predictive ability of the model was tested and validated and the simulation of maize yields with nutrient rates. Results showed that treatment 160-90-90 was efficient for maize production in 2010 growing season and 120-0-90 was efficient for maize production in 2011 growing season. However, the use of treatment 120-90-90 was more preferred and sustainable option for maize production due to the available types and combinations of fertilizer in the Ghanaian market, affordability and prevalence of P-deficient soils. Model sensitiveness to N fertilizer rates should be reworked in order to make model predictions for treatments with low N rates more accurate.
Key words: maize production, agro-ecological and fertilizer.
Maize is the third most cultivated field crop after wheat and rice in the world as well as in most parts of West Africa (Fosu et al., 2004). Maize is the most popular crop due to its high yield and easy to process at low cost compared to other cereal crops (Jaliya et al., 2008). In Ghana, maize is the major staple crop especially in the northern part where it is currently replacing sorghum and millet which were the major staple crops some years ago.
The major maize growing areas in Ghana are forest, savannah and transition agro-ecological zones. Ghana produces about 1,100,000 metric tons of maize annually over an area of 755,300 ha (SRID, MoFA, 2007). The average yield is 1.5 t ha-1 compared to an immense potential yield of up to 7.5 t ha-1 in the tropics if the crop is properly managed. The most limiting factors for maize production in these areas, especially the savannah agro- ecological zone are the erratic rainfall pattern and low soil fertility. The major causes of the low soil fertility are low application of external inputs, poor soil fertility management practices, continuous cropping on the same piece of land for a very long time and poor nature of soils. Average fertilizer application in Ghana is approximately 8 kg ha-1 (FAO, 2005). FAO estimates show negative nutrient balance for all crops in Ghana despite that the escalating rate of soil nutrient mining is a serious threat to sustainability of agriculture. Improving soil productivity therefore is the key to reversing the negative trends in maize production in potential areas of Ghana.
The introduction of high yielding varieties alone has not solved the problem of low yields and sustainable increase in maize production. The use of old or blanket fertilizer recommendations in the Sudan savannah agro-ecological zone is not useful recently. The combination of these has not attained the maximum yield potentials. In spite of all these efforts, Ghana still needs to increase maize productivity while conserving the natural resource base and preventing further degradation that has characterized most soils in the country. Use of inorganic fertilizers is the core strategy to overcome soil fertility depletion through nutrient mining and soil degradation. Smallholder and resource poor farmers in Ghana appreciate the use of inorganic fertilizers but the problem associated with the use of these soil amendments is the inconsistency in the quantity to be applied.
There is also inadequate knowledge and inherent complexities about how the weather, soil and crop interact to affect crop production, which prompts many researchers to make use of models. Models also help in matching biological requirement of crops for achieving specified objectives faster than the traditional method which requires substantial time. The Decision Support Systems for Agro-technology Transfer (DSSAT) model has been used in most researches and it is able to approximate weather, soil and crop dynamics for a narrow range of factors that influence them under limited conditions (Hoogenboom et al., 2004, 2009). Therefore, there is a need to determine the most limiting nutrient requirement and develop new fertilizer recommendations for increased and sustainable production of maize in the Sudan savannah agro-ecological zone of Ghana. This study was to refine profitable fertilizer recommendations for maize on a selected benchmark soil of the Sudan savannah agro-ecological zone of Ghana. Another objective was to test and validate the CSM-CERES-Maize model in DSSAT.
Description of the study area
This study was conducted in the Sudan savannah agro-ecological zone of the extreme north-east corner of Ghana. The area lies between latitude 10° 30’ 11’’ and longitude 0° 1’ 30’’ and covers an area of 1765 km2 along Ghana-Burkina Faso border. It has an altitude of 200 to 400 m above sea level (Adu, 1969; Nyarko et al., 2008). The area experiences a unimodal rainfall season which extends from April to October, with the heaviest rainfall mainly occurring between June and October and the mean annual rainfall is 1365 mm usually recorded in August (Nyarko et al., 2008). The mean monthly minimum temperature ranges from 18.9 to 25.7°C and the mean monthly maximum temperature ranges from 32.4 to 38.6°C while the mean annual minimum and maximum temperatures are 22.3 and 34.3°C, respectively (Adu, 1969). The mean annual relative humidity for a day is about 40 to 50% (Adu, 1969) and the dominant soil in the study area is Tanchera series (Ferric Lixisol) (FAO, 2006).
Field experiment and simulation study
A field experiment was conducted for 2 years during the rainy seasons of 2010 and 2011. A randomized complete block design with 4 replications and a plot size of 6.0 x 4.8 m was used. The treatments used in the experiments were 0-0-0, 0-90-90, 40-90-90, 80-90-90, 120-0-90, 120-45-90, 120-90-90, 120-90-0, 120-90-45 and 160-90-90 kg ha-1. The maize variety used was Obaatanpa and was planted at a spacing of 80 x 40 cm.
In simulation studies, the treatments were developed to cover a range of management input files. These input files included experimental file which was created by inputting name and geographical position of the field, planting date, fertilizer application dates, five levels of N (0, 40, 80, 120, 160), three levels of P (0, 45, 90) and three levels of K (0, 45, 90). The source of N was urea, P was from triple super phosphate and K was obtained from muriate of potash. The soil file included the analytical characteristics of the soil of the study field such as particle size, pH, nitrate, ammonium, total N, available phosphorus, exchangeable potassium, organic carbon, bulk density, and volumetric moisture content. The weather file also consisted of precipitation, minimum and maximum temperatures and solar radiation of the study field from 1960 to 2050. Field results were used to calibrate the genetic co-efficient of maize and these model inputs were integrated to provide a framework for simulating and analyzing outputs.
Model calibration and validation
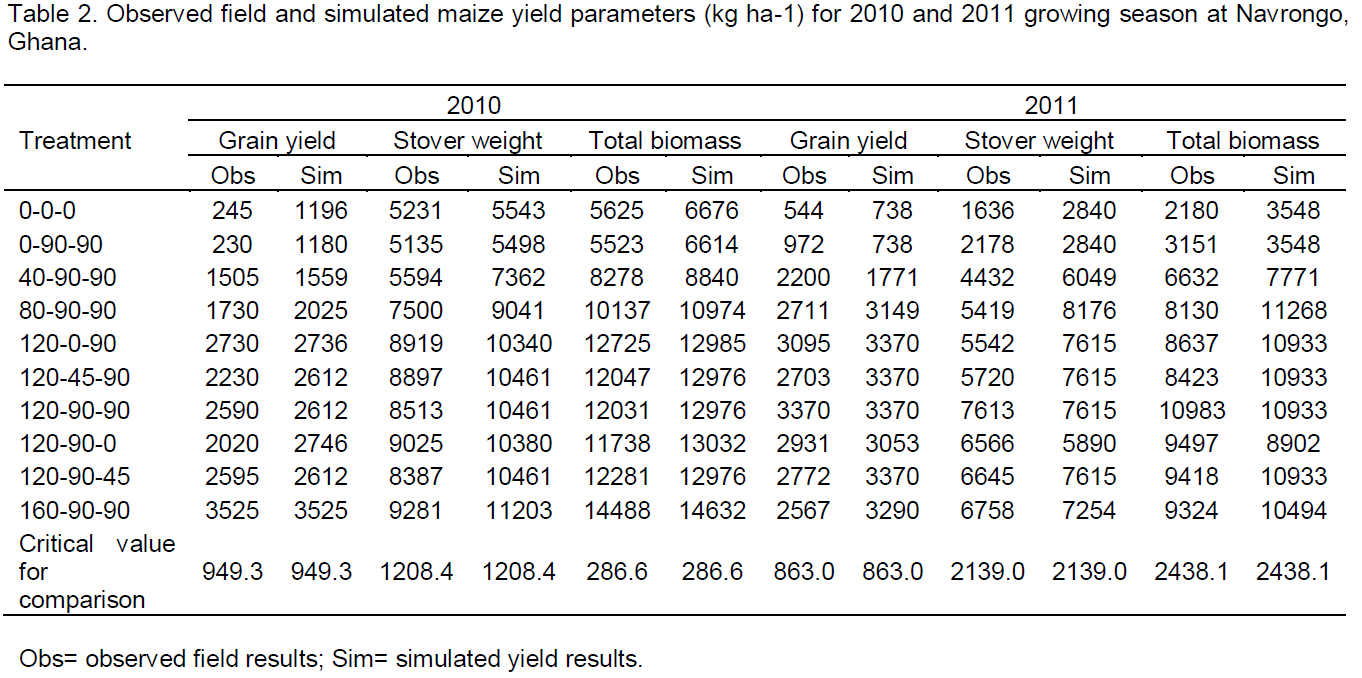
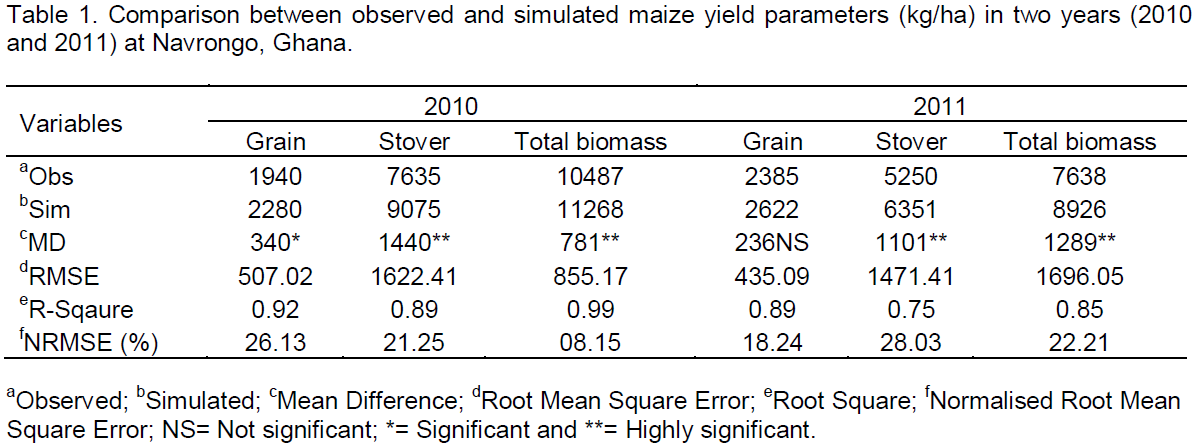
Evaluation of the DSSAT-CERES model involved comparing model outputs with real data and determination of suitability for an intended purpose of making site-specific fertilizer recommendations. The results of the thermal time from seedling emergence to the end of juvenile phase (P1 in degree days), photoperiod sensitivity coefficient (P2 in days), and thermal time from silking to physiological maturity (P5 in degree days) were collected. Other results were maximum kernel number per plant (G2), potential grain filling rate (G3 in mg d-1) and thermal time between successive leaf tip appearances (PHINT in degree days). These results were all reported in two different years to be 380, 0.1, 750, 532, 8.0, 38.9 for 2010 growing season and 300, 0.1, 700, 693, 7.8, 56.8 for 2011 growing season, respectively. The CSM-CERES model was validated by comparing the observed field data with the simulated data for 2010 and 2011 growing seasons (Table 1). Results indicated that the normalized root mean square error (NRMSE) between the observed and the simulated grain yield results for 2010 and 2011 were 26.13 and 18.24%, respectively.
Maize performance
The mean difference between the observed and simulated grain yield was significant for 2010 and not significant for 2011 results based on t-test for paired sample analysis. The comparison between the observed and simulated data showed that the R2 values were 0.99% for 2010 growing season and 0.89% for 2011 growing season. The R2 value between the observed and the simulated result was 0.92% for 2010 season and 0.89% for 2011 season. The model showed a good simulation performance for both 2010 and 2011 growing season with R2 values of 0.89 and 0.75% between the observed and simulated results, respectively. The NRSME between the observed and simulated were 08.15 and 22.21% for 2010 and 2011, respectively.
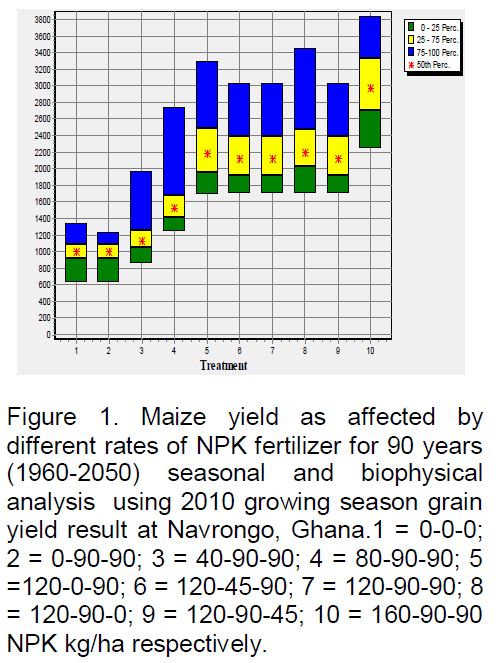
Seasonal and biophysical analysis
The yields at maturity for the treatments for 2010 and 2011 growing seasons were used to run 90 years seasonal analysis. The biophysical analysis determined the minimum and maximum yields for the treatments during the 90 years. Treatment 160-90-90 gave the best yield among the treatments but was not significantly different from treatment 120-90-0, 120-0-90, 120-90-45, 120-90-90 and 120-45-90 during the 90 years seasonal analysis using 2010 growing season grain yield results. The minimum yield of 25% was above 2200 kg ha-1 which was above 75% yield of the rest of the treatments and the maximum yield of above 3800 kg ha-1. Treatment 0-90-90 had the least yield with a minimum of 640 kg ha-1 and maximum yield of 1400 kg ha-1. This showed the level of significance of N in the development and growth of maize. Cumulative probability of grain yield for using treatment 160-90-90 was high within 25 to 75% level (about 2550 to 3350 kg ha-1) compared to the rest of the treatments which were within 75 to 100% level. This was due to a wide range of yield obtained of 25 to 75 % level of treatment 160-90-90.
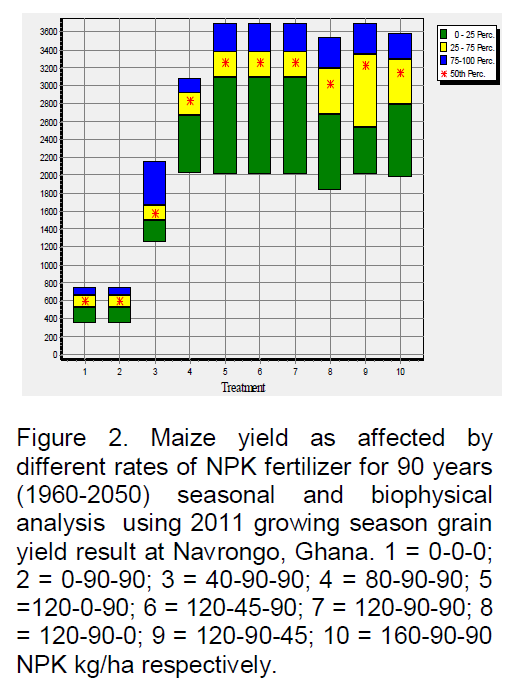
Treatment 120-90-90 together with treatments 120-0-90, 120-45-90 and 120-90-45 gave the highest yield but were not significantly different from treatment 160-90-90, 80-90-90 and 120-90-0 for the 90 years seasonal analysis using 2011 growing season grain yield result (Table 2). Treatment 120-0-90, 120-45-90, 120-90-90 had a minimum up to 25% yield of about 4600 kg ha-1 which was similar to 50% yield obtained in treatments 120-90-0, 120-90-45, and 160-90-90 and higher than 100% yield obtained from the rest of the treatments. Cumulative probability for using treatment 120-90-90 was within 0 to 25% level (about 2000 to 3100 kg ha-1 and was the same for treatments 120-0-90 and 120-45-90. This was as a result of a wide range of grain yield obtained by 0 to 25% level of these treatments. The cumulative probability of treatments 120-0-90, 120-45-90 and 120-90-90 were better than the cumulative probability of the rest of the treatments.
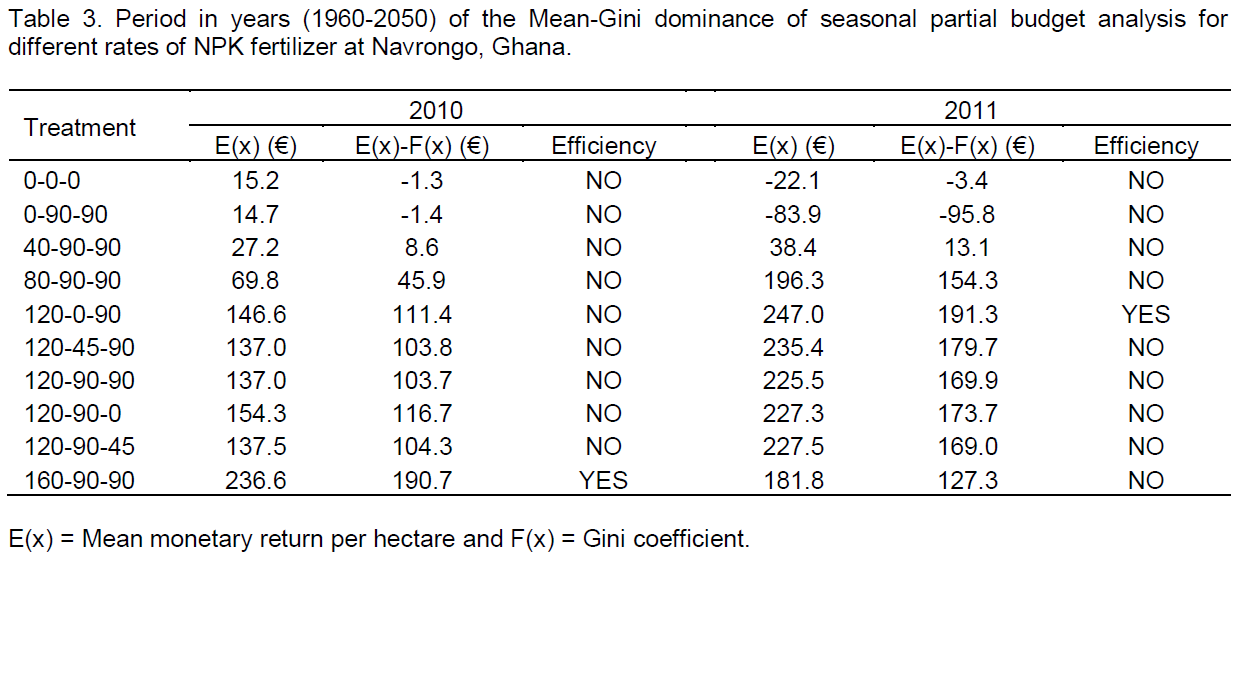
Economic and strategic analysis
Mean-Gini dominance analysis was performed to evaluate the economic strategies of the treatments for 50 years behind and 40 years ahead. The results showed that treatments 160-90-90 and 120-0-90 were the best fertilizer recommendations for economic strategic production of maize in the Sudan savannah agro-ecological zone of Ghana in 2010 and 2011 growing seasons respectively (Table 3, Figures 1 and 2).
The model simulation of grain yield had similar trend to the observed field results for the 2010 and 2011 growing season respectively. The model showed a good performance as the R2 value was close to 100% (Wilmott et al., 1985; Wallach and Goffinet, 1987). This also showed
that the model performance in simulating the yield at maturity was in acceptable range for 2010 season and good range for 2011 season (Jamieson et al., 1991; Loague and Green, 1991). However, the model was very sensitive to fertilizer rates as the simulation of yields for treatments with no or low fertilizer rates especially N was not good compared to treatments with high fertilizers. The model underestimated yields at low N levels in 2011 as compared to overestimation of yield values at low N levels in 2012 . Model sensitiveness to low N fertilizer rates should be reworked in order to make model predictions for treatments without N or low N levels more accurate.
The mean difference between observed and simulated by-product weight showed a highly significant difference for both 2010 and 2011 growing seasons using t-test for paired sample analysis. According to Wilmott et al. (1985) and Wallach and Goffinet (1987), any R2 value between observed and simulated result close to 100% shows a good model simulation performance. The NRSME values between the observed and simulated results of 21.25% for 2010 growing season and 28.03% for 2011 growing season were within the acceptable range according to Jamieson et al. (1991) and Loague and Green (1991).
The simulation of top weight at maturity in general by the model, showed a similar trend as the observed field results for the 2010 and 2011 growing season. The mean difference between the observed and simulated top weight at maturity for the 2010 and 2011 growing seasons were highly significant using t-test for paired sample analysis. The R2 values were in accordance with the findings of Wilmott et al. (1985) and Wallach and Goffinet (1987) that R2 value between observed and simulated result close to 100% shows a good performance of the model.
The values of NRSME showed an excellent model performance for 2010 season and acceptable model performance for 2011 season in simulating top weight in comparison with the observed top weight (Jamieson et al., 1991; Loague and Green, 1991).
The average performance of the Mean-Gini Dominance for the 2 seasons showed that treatment 160-90-90 had the highest return per hectare followed by treatment 120-0-90 and 120-45-90 respectively. This was due to the high monetary return obtained by these treatments from the difference between mean monetary return per hectare and Gini-coefficient. However, high cost of fertilizer, availability of fertilizer in the market and poor nature of soils make treatment 120-45-90 more economical for sustainable production of maize on Tanchera series (Ferric Lixisol, FAO, 2006) in the Sudan savannah agro-ecological zone of Ghana.
The model was helpful in making decision for refining fertilizer recommendation for the Sudan savannah agro-ecological zone. Dzotsi et al. (2003) and Soler et al. (2007) also depicted that CERES-Maize in DSSAT could successfully be used to predict the future crop yields under different management practices, and select the best one for sustainable production of maize and other crops.
Maize grain yield was affected by different rates of fertilizers. The model predictions were generally very good and were in the same trend as the observed field results. This suggests that the model can be used as a tool for developing site specific fertilizer recommendations for improved maize and other crops production in similar agro-ecological zones of Ghana. The model could be rerun with many years of generated weather data to compare different N management strategies for improving fertilizer efficiency given the uncertainty of weather.
The authors have not declared any conflict of interest.
REFERENCES
|
Jaliya A M, Falaki AM, Mahmud M, Sani YA (2008). Effects of sowing date and NPK fertilizer rate on yield and yield components of quality protein maize (Zea mays L.). ARPN J. Agric. Biol. Sci. 2:23-29. |
|
|
Fosu M, Ronald F, Vlek PLG (2004). Improving maize yield in the Guinea Savannah zone of Ghana with leguminous cover crops and P K fertilization. J. Agron. 3 (2):115-121.
Crossref |
|
|
|
SRID MoFA. (2007). National Crop production estimates 2002-2006. Statistical Research and Information Department, Ministry of Food and Agriculture. FAO (2005). Fertilizer Use by Crop in Ghana. Rome. P. 39. |
|
|
|
Hoogenboom G, Jones JW, Wilkens PW, Porter CH, Batchelor WD, Hunt LA, Boote KJ, Singh U, Uryasev O, Bowen WT, Gijsman AJ, du Toit AS, White JW, Tsuji GY (2004). Decision Support System for Agrotechnology Transfer Version 4.0, [CD-ROM].University of Hawaii, Honolulu, HI. |
|
|
|
Hoogenboom G, Jones JW, Wilkens PW, Porter CH, Batchelor WD, Hunt LA, Boote KJ, Singh U, Uryasev O, Bowen WT, Gijsman AJ, du Toit AS, White JW, Tsuji GY (2009). Decision Support System for Agrotechnology Transfer Version 4.5 [CD-ROM].University of Hawaii, Honolulu, HI. |
|
|
|
Adu SV (1969). Soils of the Navrongo-Bawku area, Upper Region, Ghana.Memoir Number 5. Soil Research Institute, Kumasi. |
|
|
|
Nyarko P, Wontuo P, Nazzar A, Phillips J, Ngom P, Binka F (2008). Navrongo Demographic Survey System, Ghana.INDEPTH Monograph. 1:1-13. |
|
|
|
FAO (2006). World Reference Base for Soil Resources, by IUSS-FAO.World Soil Resour. Report P.103. Rome. |
|
|
Wilmott CJ, Ackleson SG, Davis RE, Feddema JJ, Legates KM, Legates DR, O'Connell J, Rowe CM (1985). Statistics for the evaluation and comparison of models. J. Geophy. Res. 90(C5):8995–9005.
Crossref |
|
|
Wallach D, Goffinet B (1987). Mean squared error of prediction in models for studying ecological and agronomic systems. Biometrics 43:561–573.
Crossref |
|
|
Jamieson PD, Porter JR, Wilson DR (1991). A test of the computer simulation model ARC-WHEAT1 on wheat crops grown in New Zealand. Field Crops Res. 27:337–350.
Crossref |
|
|
Loague K, Green RE (1991). Statistical and graphical methods for evaluating solute transport models: overview and application. J. Contaminant. Hydrol. 7:51–73.
Crossref |
|
|
|
Dzotsi KA, Agboh-Noameshie T, Struif E, Bontkes Singh U, Dejean P (2003). Using DSSAT to derive optimum combinations of cultivar and sowing date of maize in southern Togo. In: T.E. Struif Bontkes and M.C.S.Wopereis (eds).Decision support system tools for smallholders agriculture in Sub-Saharan, Africa. A practical guide. IFDC & CTA. pp. 100-113. |
|
|
Soler CMT, Sentelhas PC, Hoogenboom G (2007). Application of the CSM-CERES-Maize model for planting date evaluation and yield forecasting for maize grown off-season in a subtropical environment, Eur. J. Agron.
Crossref |