Full Length Research Paper

ABSTRACT
Lack of detailed soil data has been a major constraint to hydrological modeling and making of agronomic decisions in the Koupendri Catchment. A soil survey was carried out to characterize and classify the soils of the 11.8 km2 catchment using Soil and Terrain (SOTER) approach. The soils were classified using the soil taxonomy (USDA) and the world reference base for soil resources (WRB) classification systems. The soil map produced at a scale of 1:25000 using FAO/UNESCO legend showed five distinct soil types. The dominant soil type - Dystric Plinthosols - covered about 55% of the area and supports few crop productions but make plantation agriculture almost impossible. The soils are slightly acidic to alkaline, predominantly silty to clayey in texture with good to imperfect drainage, low permeability and high bulk density that impedes root growth. The poor soil organic carbon content, total nitrogen, available phosphorus, cation exchange capacity, base saturation and other basic exchangeable cations with moderately leached horizons indicated low-moderate fertility status of less weathered soils. The soils belong to three major soil orders: Ultisols, Inceptisols and Alfisols (USDA), and reference soil groups: Plinthosols, Cambisols, Luvisols and Gleysols (WRB). The WRB gave a better and detailed soil classification compared to USDA, and thus should be used in subsequent classification of soils in the region.
Key words: Soil and terrain (SOTER), ultisols, alfisols, inceptisols, plinthosols, cambisols, luvisols, gleysols.
INTRODUCTION
Soil is a basic natural resource with widespread utilization ranging from agriculture, forestry, and other engineering and environmental purposes such as hydrological modeling. The importance of soil data for sound environmental and natura resource management has been reported (McKenzie et al., 2000). Besides being a storage reservoir and source of water supply, soil protects groundwater supplies by buffering and transforming pollutants. It is said that many of the current environmental, social, economic, geologic, and human health issues such as heavy metal poison can be better addressed if soils are considered important and paid due attention (Howitt et al., 2009; Brevik, 2013; McBratney et al., 2014 cited in Brevik et al., 2014). Recently, there is an increasing global demand for soil data and information for environmental monitoring due to global warming impact on water resources. An understanding of nature, properties, dynamics, distributions and functions of the soil as part of landscapes and ecosystem is paramount especially to prevent its continuous degradation and ensure its continuous and sustainable utilization. In land evaluation, wise decisions on land use and effective management of soils for improved agronomic productivity require an understanding of soil distribution patterns (McBratney et al., 2000). This important data most times is non-existent and sometimes available at a small scale too coarse and difficult to use for accurate modeling of hydrological processes. This is particularly true for most West African catchments including Koupendri catchment in north western Benin, where the impact of climate change is expected to be pronounced. For instance, the existing data on soil types and supporting maps for the catchment were those produced by the erstwhile ORSTOM at the scale of 1:200.000, 1:250.000 and 1:500.000 and date back to the colonial period.
Reliable soil data is a prerequisite for hydrological and environmental modeling, as well as for the design of appropriate land-use systems and soil management practices. This will help to arrest further degradation and rehabilitate the potentials of degraded soils, as well as for a better understanding of the environment (FAO, 2006a). Such reliable soil information is obtained through examination and description of the soil in the field. Most soil surveys result in the preparation of a soil map alongside a soil or scientific report which gives the inventory of the soils found in the area, their geographic distribution, physical and chemical characteristics, and climate and land use together with interpretations comparing different land use.
Thorough soil description serves as the basis for soil classification and site evaluation as well as for interpretations on the genesis and environmental functions of the soil (FAO, 2006a). Thus, the aim of this study is to make a detailed soil survey of the Koupendri catchment aimed at providing basic soil data appropriate for hydrological modeling, and for making recommendations and decisions on the present and future use of the land for planners, agronomists, and other engineering uses/purposes.
Objectives of the study
1. To characterize and classify the soils using appropriate soil classification systems.
2. To develop a detailed soil map of Koupendri catchment.
3. Make recommendations that ensure sustainable management of soil and water resources.
Description of the study area
The study was conducted on 11.8 km2 area of Koupendri catchment - a part of Volta basin located north-west of Benin (Figure 1). The geology of north western Benin is made up of the Precambrian Voltaian (Faure and Volkoff, 1996). The catchment can be characterized as an undulating pediplain relief overlying a Precambrian crystalline basement. According to ORSTOM, fersialitic and ferralitic soils are dominant often with gravelly or plinthic horizons. The catchment is located on latitude 1° 05’55’’ to 1°14’54’’ N and longitudes 10°44’12’’ to 10°55’48’’E, and has a relatively flat physiography with a mean slope of 0.4%, and height above sea level of 220 m. It has a population density of 60 persons/km2. It has a unimodal rainfall distribution pattern with distinct wet (rainy) and dry seasons. The rainy season lasts for about five months, from May to September while the dry season lasts for seven months, from October to April. Annual rainfall varies between 900 and 1200 mm, with a yearly mean of 920 mm. During the rainy season, temperature varies between 25 and 30°C, with a relative humidity that can reach up to 97% in August. Between March and April, the temperature reaches a maximum of between 42 and 45°C. The relative humidity throughout the season is between 25 and 55%. The catchment is located within the Northern (dry) sudanian region according to the vegetation zone classification of Benin by Wezel and Böcker (2000). The Sudanian vegetation is dominated by grassland and trees/shrubs of low density. The major land use is agriculture which focuses on grain crops such as maize, sorghum, rice etc., tuber crops such as yam, oil and cash crops such as cotton, and pastoralism (livestock production). Only a small amount of land is suitable for agriculture, livestock, and for dwellings in the Volta Basin of Benin due to poor nutrient status of the soil and limited availability of water. Despite these constraints, agricultural activities are rapidly expanding due to population growth, migration and accessibility.

As a result, competition exists over these finite resources resulting to over-exploitation and further degradation of these resources. The significant demographic pressure experienced in the region put more pressure on land resources, and thus hinders economic development in the region.
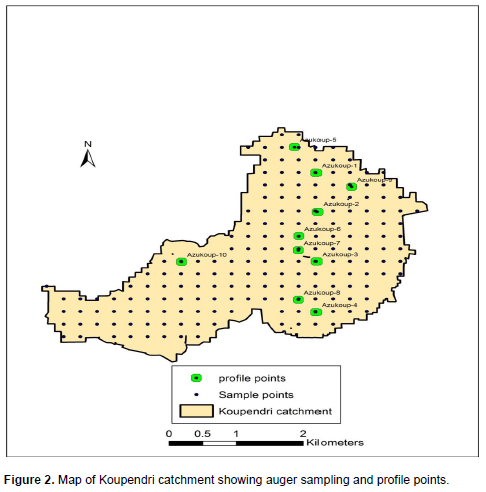
Field observations were made using toposequence method with clinometer during reconnaissance survey of Koupendri catchment. Transects were positioned at an interval of 250 m both along tracks or roads across the catchment. With the help of the global positioning system (GPS), about 200 observations points by auger drillings at 250 m interval and ten (10) profile pits were done in the catchment (Figure 2).
The soil mapping of the location was carried out using Soil and Terrain (Soil and Terrain (SOTER) approach (Igué, 2000; Weller, 2002) with the idea that land in which terrain and soil occur incorporates processes and systems of interrelationships between physical and biological phenomena evolving through time. Soil profile description was made based on the guidelines for soil profile description (FAO, 1990, 2006a). The profiles were sampled for determination of both physical and chemical properties of the soil. The results of the soil analysis were used for the classification and characterization of the soil.
The description, classification and characterization of the soil were done based on the Guidelines for Soil Description (FAO, 2006a), Field Book for Describing and Sampling Soils (Schoeneberger et al., 2002), Keys to Soil Taxonomy (USDA Soil Survey Staff, 2010) and the third edition of the World Reference Base for Soil Resources (IUSS Working Group WRB, 2014), and correlated with the FAO/UNESCO legend and French classification system (CPCS, 1967).
The particle size distribution of the < 2 mm size fraction of soil samples were determined using the hydrometer method described by Gee and Or (2002). Bulk density was determined by core method as described by Blake and Hartge (1986), and Anderson and Ingram (1993). Organic carbon (C) was determined on the air dried, 2 mm sieved samples according to the Nelson and Summer (1982) method. The organic matter content (OM) was obtained by multiplying values of organic carbon by a factor of 1.724. The pH value was determined potentiometrically using a pH meter in a soil: liquid ratio of 1:2.5 suspensions of soil in 0.1N KCl and distilled water (McLean, 1982).
Saturated hydraulic conductivity (ksat) was measured using the constant head permeameter method. Darcy’s equation, as outlined by Young (2001) was used for the computation of Ksat.

Where Q = steady state volume of outflow from the entire soil
column (cm3), L is the length of soil column (cm), A is the interior cross-sectional area of the soil column (cm2), ΔH is the change in hydraulic head or the head pressure difference causing the flow (cm), T is the time of flow (sec).
Soil water retention characteristics (field capacity (0.33 bars) and wilting point (15 bars)) were determined using pressure plate extractors or apparatus (Van Reeuwijk, 2006), then Available Water Holding Capacity (AWHC) was computed from FC and PWP.

Total nitrogen (N) was determined by Kjeldahl method (Bremner, 1996). Available phosphorus (P) was determined using Bray II method (Bray and Kurtz, 1945). Cation exchange capacity (CEC) was determine using the method described by Lavkulich (1981) or the BaCl2 compulsive exchange method by Gillman and Sumpter (1986). Exchangeable Cations (Na, K, Ca, and Mg) were extracted using ammonium acetate (NH4OAc). The cations were read on Flame Photometer (K, Na, and Ca) and Atomic Absorption Spectrophotometer (AAS) (Mg) respectively. Soil color was determined using Munsell colour charts (Munsell Colour Company, 2000). Soil depth was determined by measuring the thickness of each soil horizon using a ruler/tape graduated in centimeters. Total porosity (%) (assumed particle density ps = 2.65 kg m-3), base saturation (BS), exchangeable sodium percentage (ESP) and CEC of clay were computed, using their respective equation as follows:

RESULTS AND DISCUSSION
Soil map of Koupendri catchment
The soil map of Koupendri catchment was produced using both field observable features and analytical results based on Soil and Terrain (SOTER) approach. Soil and Terrain (SOTER) approach was originally designed for small scale mapping at 1: 1,000,000 considering terrain-soil attribute relationships.
However, at larger scales of 1:100,000 and beyond, only the soil attributes are retained with little or no terrain attributes. These soil attributes obtained from about 200 auger drilling points spaced at 250 m intervals were projected on the map of the catchment. Soils with similar attributes based on field observable features and analytical results were grouped together and mapped using expert knowledge. The soil map of this study was produced at the scale of 1:25,000 showing mainly the soil attributes using the FAO/Unesco soil map legend. The soil map showed that Plinthosols are the dominant soil type in the catchment. Plinthosols which are characteristic of strongly weathered soils (FAO, 1988) consist more than 55% of the catchment soils compared to other soil types; Gleysols, Luvisols and Cambisols (Figure 3).

Soil description and characteristics of Koupendri catchment
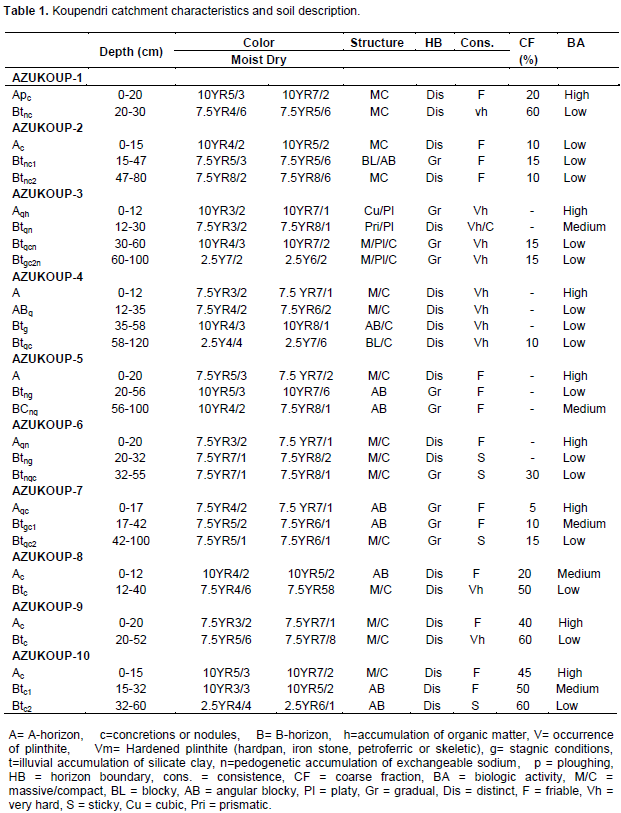
The soil colour (moist, dry) value and chroma varied with depth ranging from dark brown 10 YR mostly at the A-horizon to reddish brown 7 YR and yellow 2 YR at the sub-surface horizon except at few horizon (AZUKOUP-4 and AZUKOUP-5) with uniform reddish brown 7 YR throughout the horizons (Table 1). The increase in soil color from dark brown 10 YR to reddish brown 7 YR could be attributed to the oxidation of iron oxides responsible for the reddish colour in subsoil horizons (Buol et al., 2003) and to a lesser extent, the decrease in SOC with depth. The poor variability in the soil colour hue, value and chroma is an indication of the presence of soil moisture caused by a high water table due to a shallow aquifer. The presence of mottles in some subsoil layers confirms that the soils have moderate to poor drainage conditions.
The soil structure of the surface horizons of the soil profiles were mostly massive and compact with varying size of weak peds except at AZUKOUP-3 that has cubic and platy structure at the surface (Table 1). The subsurface horizons were massive and compact with few exception having either platy, prismatic, angular blocky or blocky structure. The consistence (dry) of both surface and subsurface horizons ranged from friable through hard to very hard. The gravel content of the soils increases with depth and ranges from 10 % to more than 60%.
Soil textural characteristics
The clay content increased with increasing depth throughout the profiles except at AZUKOUP-4 and AZUKOUP-5 where it is irregular resulting to abrupt textural change (Table 2). The sand content decreased with increasing depth throughout the profiles while the silt content was irregular with increasing depth. The top soils were mostly sandy loam with few silty loam and loam.

The silt/clay ratio and the degree of degradation they reflect are shown in Table 2. Generally, the silt/clay ratio decreased with depth throughout the profiles contrary to variation in clay contents. The highest value (6.1) was obtained in the A-horizon of AZUKOUP-4 while the least value (0.5) was obtained at the B-horizon of AZUKOUP-6 and AZUKOUP_10 respectively.
The gravel content of the soils increases with depth in most horizons with mixture of increase and decrease in gravel contents in few horizons (Table 2). The gravel content ranges from 9% in the A-horizon (Agn) ofAZUKOUP-6 to more than 65% in the B-horizon (Btc1) of AZUKOUP-10.
Soil hydraulic/hydrological properties
The saturated hydraulic conductivity (Ksat), bulk density (BD), porosity (P) and soil water characteristics results for the profiles studied were shown in Table 3. The Ksat value was lowest (1.68 cm/d) in a clay loam B-horizon (Btgc2n) of AZUKOUP-3, and highest (395 cm/d) in a sandy clay loam B-horizon (Btc1) of AZUKOUP-10.
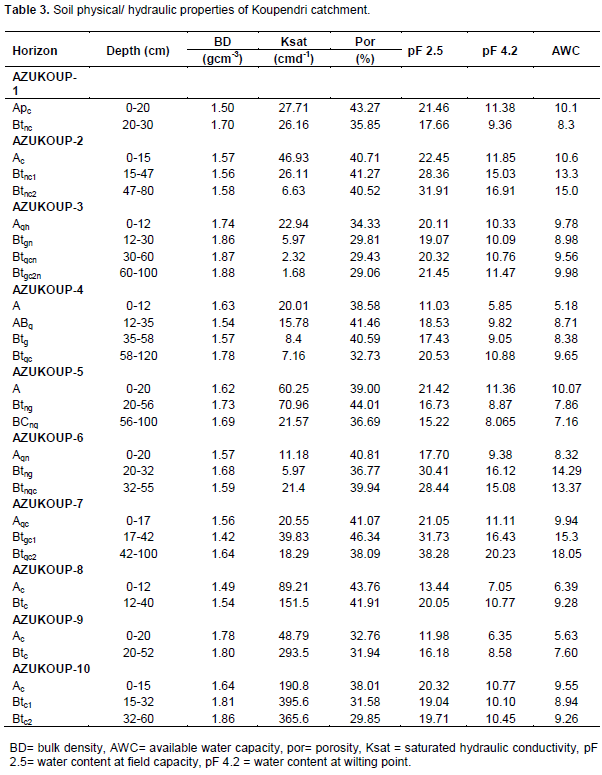
The bulk density was relatively high while the porosity was moderate to low throughout the profiles studied (Table 3). The bulk densities range from 1.42 kgm-3 at the B-horizon of AZUKOUP-7 to 1.88 Kgm-3 at the B-horizon of AZUKOUP-3. Bulk density increases with depth in some profiles and vice versa in other profiles. The high bulk density (1.42 to 1.88 kgm-3) above the optimal value of 1.40 Kgm-3 and the moderate to low porosity (< 50%) below the ideal value (>50%) for healthy root growth in most horizons of the profiles studied could be attributed to soil compaction caused by continuous and intensive pastoral activities and cultivation for many years, poor soil structure (less inter-ped spaces), low soil OM and to a lesser extent the texture especially the silt content as seen in AZUKOUP-3 profile.
The soil water content at field capacity (FC; 0.33 bars) and at Permanent Wilting Point (PWP; 15 bars) had shown a slight variation among the studied profiles (Table 3). The highest FC (38.28) and PWP (20.23) were recorded for the sub-surface horizon (Btgc2) of AZUKOUP-7. This could be caused by high water table and to a lesser extent due to clay or silt content.
Soil pH
The soils pH varies from moderately acidic (5.2) in the B-horizon (Btnc1) of AZUKOUP-2 to slightly alkaline (7.6-9) in the B-horizon (Btgc2n) of the same profile (Table 4). Also shown in Table 4 is change in pH i.e. ∆pH (pHH2O –pHKCl) which were positive for all profiles and horizons studied. The values of ∆pH range from 1.1 in the A-horizon (Apc) of AZUKOUP-1 to 2.1 in the B-horizons (Btgn and Btgcn) of AZUKOUP-3.
Total Nitrogen (N), Available Phosphorus (P) and Soil Organic Carbon (SOC)
The total N ranged from 0.02 in the B-horizon (Btgc) of AZUKOUP-4 to 0.08 in the A-horizon (Agh) of AZUKOUP-3 (Table 4). The SOC decreases with increasing depth in each profile and ranged from 0.048 in the B-horizon (Btc) of AZUKOUP-9 to 2.02 in the A-horizon (Agh) of AZUKOUP-3. The available P ranges from 1 mg/Kg in most sub-surface horizons of the soil profiles to 6 mg/Kg in the surface or A-horizon (Agn) of AZUKOUP-6.
The C:N ratio for the profiles and their horizons varied from a narrow range of 4.2 in the B-horizon (Btngc) of AZUKOUP-6 to the wider range of 24.02 in the A-horizon (Agh) of AZUKOUP-3 (Table 4). Generally, the C:N ratio shows a decreasing trend with increasing depth throughout the profiles and their horizons (Table 4).
Base saturation and cation exchange capacity
Generally, the base saturation (BS) was low to moderate (20-60%) for most soil profiles studied with few exceptions (Table 4). The exchangeable calcium (Ca) throughout the profiles ranged from very low (<2%) to moderately few (2-5%) in some horizons. The exchangeable Mg is low throughout the profiles except in some horizons where it is moderately high. The exchangeable K was also very low in most profiles and their horizons, although moderate to very high values were also recorded in few horizons. The exchangeable sodium (Na) was low throughout the profiles ranging from 0.281 in the A-horizon (Agn) of AZUKOUP-6 to 0.545 in the B-horizon Btc2) of AZUKOUP-10. The trend or abundance in decreasing order is Ca++ > Mg++ > Na+ > K+ except at AZUKOUP-4. The exchangeable sodium percentage ((ESP) was low throughout the horizons except at the B-horizon (Btgc2n) of AZUKOUP-3 where it is 17.3, a value that is above the critical level (> 15%) that causes deterioration of soil structure and Na toxicity (Landon, 1991). Since the BS indicates the degree of leaching of basic cations, most of the soil profiles studied was moderately (43-46%) to highly leached (16-29%) except AZUKOUP-3, AZUKOUP-4, AZUKOUP-7 and AZUKOUP-10 with higher BS values. The A-horizons of AZUKOUP-5 and AZUKOUP-8 also show some signs of weak/low leaching. The CEC across the landscapes and profiles ranged from 4.72-28.56 Cmolkg-1 (Table 4). The lowest values for the CEC were recorded at AZUKOUP-5 with a range of 4.72-6.08 Cmolkg-1 and the highest values at AZUKOUP-10 with a range of 10.8-28.56 Cmolkg-1. The CEC of soil profiles followed the trend exhibited by the exchangeable basic cations especially exchangeable Ca++ reflecting that these basic cations are the main ion contributors in the exchange complexes.
Soil classification of Koupendri catchment
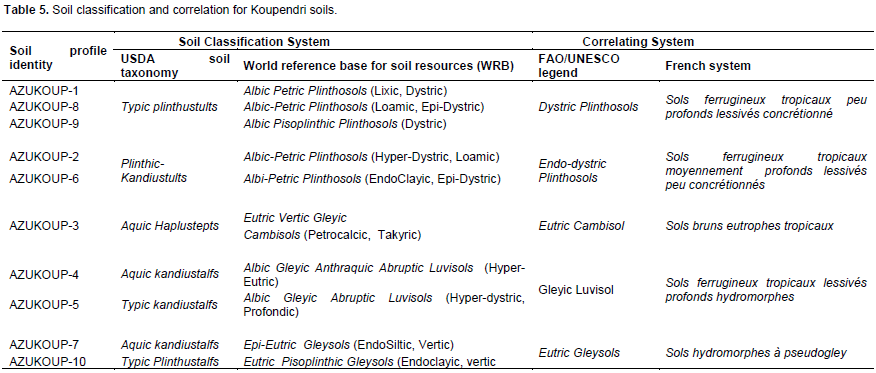
Soil classification of Koupendri catchment was done following World Reference Base for Soil Resources [WRB] (IUSS Working Group, 2006; 2014) and Soil Taxonomy (Soil Survey Staff, 2010) classification schemes, and then correlated with the FAO-UNESCO legend and French Classification schemes (Table 5). The table showed 7 soil types at sub-group level classification for Soil Taxonomy and 10 soil types for WRB correlated to 5 soil types for both FAO-UNESCO legend and French classification schemes.
.png)
.png)
DISCUSSION
The soils show indication of poor structure or structural deterioration caused by cultivation and compaction through trampling by human and animals that destroy or fragments soil aggregates. The soils were less deep with mainly Ap and Bt horizons while C horizon was virtually absent. This confirmed why cash crops and plantation agriculture could not thrive in the catchment. The soils were mostly gravelly ranging between 10% and above 60%. Such soils with gravel contents above 60% aretermed gravelly soils (Buol et al., 2003), and affect the physical and hydraulic properties of soil (Brakensiek and Rawls, 1994; Sauer and Logsdon, 2002). The combination of the soil structure and the gravel content also influenced the drainage of the catchment which ranged from good through normal to imperfect or very poor drainage.
The clay increase in most B-horizons especially the kandic horizons is a confirmation of reports from other studies. It has been reported that clay increase in most kandic horizons is as a result of clay migration-accumulation or illuviation, clay destruction, selective erosion, sedimentation or lithological discontinuity (FAO, 1988; Van Wambeke, 1989; Driesen and Dudal, 1991). The fact that clay minerals are unstable and break down under intense chemical weathering especially in humid and sub-humid climates further buttressed the claim. This was also reported in Alemayehu et al. (2014) for some Ethiopian soils. This also applied to the Argic B-horizon which is similar to kandic horizons since part of the pedon may meet the requirements of both horizons when considered at the same classification level (Ngongo and Langohr, 1992).
The decrease in silt/clay ratio with depth can be attributed to massive destruction of clay, selective erosion, and to a lesser extent illuviation of clay from the surface (Ap) horizon to the sub-surface (Bt) horizon. The decrease in silt/clay ratio with depth is in agreement with reports from some studies of Nigerian soils (Ezeabasili et al., 2014; Chukwu, 2013; Lal, 2000). Lal (2000) reported that the silt/clay ratio of most tropical soils decline with depth and widely ranged from soil to soil even within the same toposequence. However, a contrary result of an increasing silt/clay ratio with depth was reported for lowland soils in southwestern Ethiopia (Alemayehu et al., 2014). The silt/clay ratio is an index of weathering (Van Wambeke, 1959), and one of the most important criteria for the definition of the ferralic horizon. According to FAO (1988), this silt/clay ratio should be less than or equal to 0.2. This underscores the absence of a ferralic horizon and Ferralsols in all the studied profiles. High silt/clay ratios observed in most horizons alongside resistant skeletal composition of the parent material reflect that the soil is less weathered and thus, at less advanced stage of development.
The decreasing Ksat with increasing depth observed has also been reported in some tropical studies (Ziegler et al., 2004; Zimmermann and Elsenbeer, 2008; Zimmermann et al., 2006). Such decrease could result to saturation excess overland flow during high-intensity rainfall events (Germer et al., 2010; Godsey et al., 2004). The low values of Ksat at some soil depth can form an impeding layer and may lead to perched water tables, diminished groundwater recharge and the development of interflow. This is because, Ksat represent the capacity of the soil to drain or transmit water (Klute and Dirksen, 1986) and governs vertical percolation of water within the soil profile. The high bulk densities obtained agrees with that obtained for similar soils in Terou-Igbomakoro catchment, central Benin (Junge, 2004; Sintondji, 2005). Such high bulk density may present serious challenge to agronomic and hydrological processes. The available water holding capacity (AWHC) showed a closer relationship with silt content than with clay or SOC contents.
The acidic nature of the soils could be attributed to the parent material which is acid metamorphic schists. However, as an indication of soil acidification, soil pH is dependent not only on the nature of the parent material but also on the level of soil leaching in the environment. This may suggest why some of the soils were moderately alkaline. Based on the soil pH rating of Jones (2003), the pHH2O throughout the profiles and their horizons fall within moderately/slightly acidic to moderately/slightly alkaline.
According to Soil Survey Staff (2006), ∆pH can be positive, zero or negative depending on the net surface charge at the time of sampling. The positive ∆pH which indicates presence of negatively charged colloids lends credence to the translocation of clay from the upper or surface horizon and its accumulation in the B-(illuvial) horizon through illuviation processes.
Generally, available P shows a decreasing trend with increasing depth for all the profiles. The slightly higher values of SOC and total N observed in the A-horizon of AZUKOUP-3 could be due to waterlogging of the location which slowed down the turn-over of the surface organic material while that of available P could be due to use of phosphate fertilizer for cultivation at the site of the profile pit (AZUKOUP-6). Similar decrease in SOC with increasing depth for each profile has been reported (Alemayehu et al., 2014; Campos, 2002; Agyare, 2004). There was no clear direct association of total N and SOC with increasing depth of the profiles as reported by Alemayehu et al. (2014) for some Ethiopian soils. However, the very low contents of total N, SOC, and available P may be attributed to the frequent annual bush burning and crop residues (a common land clearing practice for cultivation) at the end of the year or more explicitly during the dry season. This frequent bush burning practices, coupled with high temperature accelerates the rapid turn-over of organic materials in the catchment. This was also affirmed by Yilma (2006) who reported that burning of biomass in prevailingâ€slashâ€and burn systems and high temperatures lead to a rapid decomposition of organic matter and consequently, poor SOC. Studies in Ethiopia (Habtamu et al., 2009; Alemayehu et al., 2014), west Africa (Lal et al., 2003; Yilma, 2006) and other parts of the world had reported significant reduction in SOC and Total N caused by burning and removal of crop residue. Low fertility is linked with low CEC and low reserves of N and P-availability. The very low contents of available P suggest that it is a serious limiting nutrient for crop production in the catchment despite that moderately acidic to slightly alkaline soils (5.5-9.0) favour P- availability. This confirms the report that P is considered the main limiting nutrient for crop production in drier savanna (Sanchez, 1976, Kowal and Kassam, 1978).
The C:N ratio was low throughout the horizons and fall below the optimal range (10-12:1) acceptable for arable soils (Havlin et al., 1999). This could be attributed to high oxidation and loss of organic matter as evidenced by the poor or very low SOC in the two profiles. The C:N ratio is important because the availability of nitrogen (N) for plant growth is dependent on the ratio. High C:N > 30:1 implies N immobilization due to decomposition of organic residue by microbes while C:N < 20:1 implies limited immobilization and release of N into the soil environment for plant uptake (Jones, 2003).
The analytical result of the base saturation (BS) and cation exchange capacity (CEC) revealed that exchangeable Ca and Mg were dominant cations at the exchange complex accounting for more than 80% of exchangeable bases and between 50 to 65% of total cations of the exchange site. Both BS and CEC were low to moderate and could be due to the predominance of Kaolinite clay minerals and also, poor recycling and depletion of basic cations, OM and clay contents due to erosional processes and inappropriate management (incessant bush burning) of residues but to a lesser extent, soil reaction or pH. Similar reports were made for sub-humid catchment in central Benin (Igué, 2000; Impetus, 2003).
CONCLUSION
Soil survey and classification for Koupendri catchment in north western Benin, West Africa provided soil information for hydrological modeling, future agronomic decisions, soil and water management, engineering and other socio-economic purposes. The catchment has a relatively flat physiography with height above sea level ranging from 215-224 m above sea level, which is gently slopy (0 to 6%). The parent material is acid metamorphic mica schist. The soil pH ranges from slightly acidic to relatively alkaline with poor fertility status evidenced by poor SOC, total N, C/N ratio, low CEC, exchangeable cations, less weathered soil with textural characteristics that is prone to crusting, compaction and hinders root growth. The study also confirms that P-availability is the major agronomic constraints in drier savanna regions. The permeability and the available water capacity of the soil were very low, presenting a serious soil water management problem for both agronomic and hydrological purposes. The soil map of the catchment produced at a scale of 1:25000 using FAO/UNESCO legends showed five distinct soil types. The classification of the soils reveal seven soil types at sub-group level of classification belonging to three major orders: Ultisols, Inceptisols and Alfisols (USDA). The WRB gave ten distinct soil types belonging to five major or reference soil groups. These were correlated with Plinthosols, Cambisols, Luvisols and Gleysols for FAO-UNESCO legend; and Sols ferrugineux tropicaux peu profonds lessivés concrétionnés, Sols hydromorphes à pseudogley, Sols tropicaux moyennement profonds lessivés peu concrétionnés, Sols bruns eutrophes tropicaux and Sols ferrugineux tropicaux lessivés profonds hydromorphes for French classification system. The WRB gave a more detailed, concise and better soil classification that correlates better with FAO/UNESCO legend and French classification scheme than USDA Soil Taxonomy. Soil fertility or nutrient assessment for the catchment will provide information for improved soil nutrient management. Also, land cover and residue management with appropriate tillage and conservation practices is paramount for improved soil productivity and hydrological processes of the catchment.
CONFLICT OF INTEREST
The authors have not declared any conflict of interest.
ACKNOWLEDGEMENT
The work was funded by the West African Science Service Center on Climate Change and Adapted Land Use (WASCAL).
REFERENCES
| Agyare WA (2004). Soil characterization and modeling of spatial distribution of saturated hydraulic conductivity at two sites in the Volta Basin of Ghana. Ecol. Dev. Ser. 17:206. | ||||
| Alemayehu Y, Gebrekidan H, Beyene S (2014). Pedological characteristics and classification of soils along landscapes at Abobo, southwestern lowlands of Ethiopia. J. Soil Sci. Environ. Manag. 5(6):72-82. Doi 10.589/JSSEM13.0432. | ||||
| Anderson JM, Ingram JSI (1993). Tropical soils biology and fertility. A handbook of methods, 2nd Ed; CAB International, Wallingford U.K., P. 221. | ||||
| Blake GR, Hartge KH (1986). Bulk density. In: Klute, A. (ed.) Methods of soil analysis. Part 1 – Physical and mineralogical methods. 2nd ed. SSSA Book Series No. 5. SSSA and ASA, Madison, WI, pp. 363-382. | ||||
|
Brakensiek DL, Rawls WJ (1994). Soil containing rock fragments: effects on infiltration. Catena 23:99-110. Crossref |
||||
|
Bray RH, Kurtz LT (1945). Determination of total, organic and available forms of phosphorus in soils. Soil Sci. 59:30-45. Crossref |
||||
| Bremner JM (1996). Nitrogen – total. In: Bigham JM (ed) Methods of soil analysis, part 3, chemical methods. Soil Sci. Soc. Am. Am. Soc. Agron. SSSA Book, Series no 5, Madison, WI, pp. 1085-1121. | ||||
| Brevik EC (2013). Soils and human health – an overview, in Soils and human health, edited by: Brevik, E. C. and Burgess L. C., Boca Raton, FL, USA, CRC Press, pp. 29-56. | ||||
|
Brevik EC, Cerdá A, Mataix-Solera J, Pereg L, Quinton JN, Six J, Van Oost K (2014). Editorial "The Interdisciplinary Nature of Soil", Soil Discuss. 1:429-462. doi:10.5194/soild-1-429-2014. Crossref |
||||
| Buol S, Hole F, McCracken J, Southard R (2003). Soil genesis and classification, 5th ed. Iowa State Press, USA, pp. 126-327. | ||||
| Campos A (2002). Physical and mechanical properties of three tropical forest soils on limestone in Chiapas, Mexico Foresta Veracruzana. 4(2):1-9. | ||||
| Chukwu GO (2013). Soil survey and classification of Ikwuano Abia state Nigeria. J. Environ. Sci. Water Resour. 2(5):150-156. | ||||
| CPCS (1967). Classification des Sols. Travaux CPCS 1963-1967. ENSA, Grignon. P. 87. | ||||
| Driesen PM, Dudal R (1991). The major soils of the world: Lecture notes on their geography, formation, properties and use. Wageningen and Leuven. P. 310. | ||||
| Ezeabasili ACC, Okoro BU, Emengini EJ (2014). Relative erodibilities of some soils from Anambra basin. Sky J. Soil Sci. Environ. Manag. 3(8):83-90. | ||||
| FAO (1988). Soil map of the world. Revised Legend, World Soil resources. Report 60, Rome, P. 119. | ||||
| FAO–ISRIC. (1990). Guidelines for profile description. 3rd Edition. Rome. | ||||
| FAO (2006a). Guidelines for soil description. 4th ed. Viale delle Terme di Caracalla. Rome, Italy. | ||||
| Faure P, Volkoff B (1996). Différentiation régionale des couvertures pédologiques et litho-geomorphologie sur socle granite-gneissique du Bénin (Afrique Occidentale). C.R. Acad. Sci. Paris t. 322, série IIa, pp. 393-400. | ||||
| Gee GW, Or D (2002). Particle size analysis. In: Dane, J.H., Topp, G.C. (eds). Methods of soil analysis. Part 4. Physical Methods Soil Science Society America Book Series N0. 5 ASA and SSSA, Madison, WI, pp. 255-293. | ||||
|
Germer S, Neill C, Krusche AV, Elsenbeer H (2010). Influence of land-use change on near-surface hydrological processes: Undisturbed forest to pasture. J. Hydrol. 380(3-4):473-480. Crossref |
||||
|
Gillman GP, EA Sumpter (1986). Modification to the compulsive exchange method for measuring exchange characteristics of soils. Aust. J. Soil Res. 24:61-66. Crossref |
||||
|
Godsey S, Elsenbeer H, Stallard R (2004). Overland flow generation in two lithologically distinct rainforest catchments. J. Hydrol. 295(1-4):276-290. Crossref |
||||
| Habtamu K, Husien O, Haimanote B, Tegenu E, Charles F, Amy S, Tammo S (2009). The effect of land use on plant nutrient availability and carbon sequestration. Proc. 10th conf., March 25-27. Addis Ababa. pp. 208-219. | ||||
| Havlin J, Tisdale S, Nelson W, Beaton J (1999). Soil Fertility and Fertilizers, 6th ed. Macmillan Publishing. USA, pp. 85-196. | ||||
|
Howitt RE, Català-Luque R, De Gryze S, Wicks S, Six J (2009). Realistic payments could encourage farmers to adopt practices that sequester carbon. Calif. Agric. 63:91-95. Crossref |
||||
| Igué AM (2000). The use of a soil and terrain databases for land evaluation procedures-case study of central Benin, PhD university of Hohenheim, Stuttgard, Germany. Thesis P. 235. | ||||
| IMPETUS (2003). Final Report, Period 1.5.2000 - 30.4.2003. – P. 152. | ||||
| IUSS Working Group WRB (2006). World Reference Base for Soil Resources. World Soil Resources Report No. 103. Food and Agriculture Organization of the United Nations, Rome. P. 128. ISBN-10: 9251055114. | ||||
| IUSS Working Group WRB (2014). World Reference Base for Soil Resources 2014. International soil classification system for naming soils and creating legends for soil maps. World Soil Resources Reports No. 106. FAO, Rome. | ||||
| Jones J (2003). Agronomic Handbook: management of crops, soils, and their fertility. CRC Press, Boca Raton, Florida, USA. P. 482. | ||||
| Junge B (2004). Die Böden des oberen Ouémé-Einzugsgebietes in Benin/Westafrika. Pedologie, Klassifizierung, Nutzung und Degradierung. Dissertation, Bonn. P. 307 S. | ||||
| Klute A, Dirksen C (1986). Hydraulic conductivity and diffusivity: Laboratory methods. In: Klute A (ed) Methods of Soil Analysis, Part 1:687-734. Madison, WI: Am. Soc. Agron. | ||||
| Kowal JM, Kassam AH (1978). Agricultural ecology of savanna: A study of West Africa. Clarendon Press, Oxford, UK. P. 403. | ||||
|
Lal R, Sobecki TM, Iivari T, Kimble JM (2003). Soil degradation in the United States: extent, severity and trends, pp. 3-21. CRC Press LLC, Boca Raton, Florida. PMid:12749479 |
||||
|
Lal R (2000). Physical management of soils of the tropics: Priorities for the 21st Century. Soil Sci. 165:191-207. Crossref |
||||
| Landon J (1991). Booker tropical soil manual: A handbook for soil survey and agricultural land evaluation in the tropics and subtropics. Longman, NY. | ||||
| Lavkulich LM (1981). Methods Manual, Pedology Laboratory. Department of Soil Science, University of British Columbia, Vancouver, British Columbia, Canada. | ||||
|
McBratney AB, Odeh IOA, Bishop TFA, Dunbar MS, Shatar TM (2000). An overview of pedometric techniques for use in soil survey. Geoderma 97:293-327. Crossref |
||||
|
McBratney A, Field DJ, Koch A (2014). The dimensions of soil security, Geoderma 213(30):203-213. Crossref |
||||
| McKenzie NJ, Jacquie DW, Ashton LJ, Cresswell HP (2000). Estimation of soil properties using the Atlas of Australian soils, CSIRO Land and Water, Technical Report 11/00 | ||||
| McLean EO (1982). Soil pH and lime requirements. In: methods of Soil Analysis Part II, Page, A.L., R.A. Miller, D.R. Keeney (eds). Chemical and Microbial Properties. American Society of Agron. Madison Wiscosin, U.S.A, pp. 199-220. | ||||
| Munsell colour company (2000). Munsell Soil Color Charts Rewashable | ||||
| Nelson DW, Sommers LE (1982). Total carbon, organic carbon and organic matter. In: Page, A.L, Miller, R.H. and Keeney, D.R. (eds). Methods of soil analysis, part 2. Am. Soc. Agron, Madison WI, pp. 539-579. | ||||
| Ngongo R, Langohr L (1992). Classifying strongly weathered soils from the Zarian basin into the revised international soil classification systems (Soil Taxonomy, 1990; FAO-UNESCO legend, 1988). In PEDOLOGIE: Van Cleemput et al., (eds); XLII-2, pp. 99-117. | ||||
| Sanchez PA (1976). Properties and management of soils in the tropics. John Wiley and Sons. New York, USA. P. 618. | ||||
|
Sauer TJ, Logsdon SD (2002). Hydraulic and physical properties of stony soils in a small watershed. Soil Sci. Soc. Am. J. 66:1947-1956. Crossref |
||||
| Schoeneberger PJ, Wysocki DA, Benham EC, Broderson WD (2002). Field book for describing and sampling soils, (editors), Version 2.0. Natural Resources Conservation Service, National Soil Survey Center, Lincoln, NE. | ||||
| Sintondji L (2005). Modelling the rainfall-runoff process in the Upper Ouém catchment (Terou in Benin Republic) in a context of global change: extrapolation from the local to the regional scale. Dissertation, Bonn. 205 S. | ||||
| Soil Survey Staff (2006). Keys to Soil Taxonomy, 10th ed. USDA, NRCS. Washington DC, United States Govt Printing Office. pp. 161-323. | ||||
| Soil Survey Staff (2010). Keys to Soil Taxonomy, 11th ed. USDA, NRCS. Washington DC, United States Govt Printing Office. P. 346. | ||||
| Van Wambeke A (1959). "Le rapport limon/argille, mesure appriximative du stade d'altération des materiaux originels des sols tropicaux. Troisieme Conf. international des sols, Dalaba, 1:161-167. | ||||
|
Van Wambeke A (1989). Tropical soil and soil classification updates. Adv. Soil Sci. New York. 10:176-193. Crossref |
||||
| Weller U (2002). Land evaluation and land use planning for Southern Benin (West Africa) BENSoil and Terrain (SOTER). Hohenheimer Bodenkundliche Hefte 67. Institut für Bodenkunde und Standortlehre. University of Hohenheim. Stuttgart. P. 165. | ||||
| Wezel A, Böcker R (2000). "Vegetation of Benin. Adapted Farming" In West Africa: Issues, Potentials and Perspectives Graef, F., Lawrence, P. & M. von Oppen (Editors). Verlag Ulrich E. Grauer, Stuttgart, Germany ISBN 3-86186-315-4 | ||||
| Yilma T (2006). Modeling farm irrigation decisions under rainfall risk in the White Volta Basin of Ghana. A tool for policy analysis at the farmâ€household level. Bonn, Göttingen, Germany: University of Göttingen. P. 170. | ||||
|
Ziegler AD, Giambelluca TW, Tran LT, Vana TT, Nullet MA, Fox J, Tran DV, Pinthong J, Maxwell JF, Evett S (2004). Hydrological consequences of landscape fragmentation in mountainous northern Vietnam: Evidence of accelerated overland flow generation. J. Hydrol. 287:124-146. Crossref |
||||
|
Zimmermann B, Elsenbeer H, De Moraes JM (2006). The influence of land-use changes on soil hydraulic properties: Implications for runoff generation. For. Ecol. Manag. 222:29-38. Crossref |
||||
|
Zimmermann B, Elsenbeer H (2008). Spatial and temporal variability of soil saturated hydraulic conductivity in gradients of disturbance. J. Hydrol. 361:78-95. Crossref |
||||
Copyright © 2024 Author(s) retain the copyright of this article.
This article is published under the terms of the Creative Commons Attribution License 4.0


