Full Length Research Paper

ABSTRACT
The study analyzed energy input-output of irrigated rice production at the Jere Bowl Borno State, Nigeria. One hundred and thirty farms were sampled through multistage sampling procedure. The data collected were analyzed using descriptive statistics and energy equations. The result showed that total of 36,397.85 MJ/ha of energy was consumed in the irrigated rice production with the highest energy input taken up by irrigation water (48.51%) and fuel (23.58%). The forms of energy estimated showed that direct energy contributed much to rice production (76.21%) than the indirect energy with 23.77%; similarly, renewable energy constituted higher energy (59.98%) to the production system, while non-renewable energy constituted only 39.99% of energy to the production system. The results on energy indices of rice production indicated energy ratio of 2.47, specific energy of 31.38 MJ/kg, energy productivity of 0.147 kg/MJ, water productivity of 0.103 kg/M3 and net energy of 53,598.71 Mj/ha. The lower values of energy indices indicate inefficient use of energy. The study recommended that farmers should adopt efficient and cost effective irrigation system which will ensure efficient utilization of energy.
Key words: Input-output, energy, direct energy, indirect energy, renewable energy, indices, water productivity.
INTRODUCTION
Rice is a very important food crop in the world because it is the second largest cereal consumed after wheat which provides staple food for more than half of the world’s population with about 80% of its food calorie requirements (Inuwa et al., 2011). Rice is cultivated and consumed in all parts of Nigeria. Rice production produces and consumes energy in form of bio-energy. The resource inputs used in rice production are composed of energy. This energy is called bio-energy or energy input. The ability of the input to function in the production of rice is as result of the energy input. The production of rice in a system with high yield targets cannot be achieved without energy inputs such as energy in seed, fertilizer, pesticides and labour to the system. This energy is further categorized into direct, indirect, renewable and non-renewable energy. Direct energy is the energy consumed directly in the rice production e.g. human labour, animal labour, fossil fuels, and electricity. The sources of these energy are human, animal, petrol, diesel and water required to perform different tasks in the crop production processes such as field preparation, cultural practices, irrigation, harvesting, threshing and transportation. However, the energy that is used in manufacturing, packaging and transportation of different farm inputs such as seed, fertilizers, farmyard manure, pesticides and other chemicals and machineries are called indirect energy. The energy that come from human in form of labor, from animal in form of power, from seed and farmyard manure are classified as renewable energy, however, the non-renewable energy sources are petrol, diesel, electricity, chemicals and machinery. On the other hand, the petrol, diesel and electricity falls under the category of commercial energy but the human, animal and farmyard manure fall under the category of non-commercial energy (Singh et al., 2007). Effective planning for the use of the energy in the process of rice production is imperative to attain efficient performance of rice with less environmental pollution. The extent to which irrigated rice production in Jere Bowl Borno State consumed energy is unknown. This study seeks to unravel this information.
Objectives of the study
The objectives of the study were to:
(1) examine the level of energy consumption in rice production in the study area;
(2) identify the forms of energy used in rice production in the study area; and
(3) estimate the energy indices of rice production in the study area.
METHODOLOGY
Study area and data collection
The study was conducted in Jere Bowl Borno State, Nigeria. It lies between latitudes 11° 40' and 12° 05'N and longitudes 13° 05' and 12° 20' E with a projected population of 277, 913 persons in 2017 based on 2.8% population growth rate (National Population Census, 2006). Jere Bowl has a cultivable land area of about 22,000 ha, out of which a gross area of 15,850 ha was identified as suitable for irrigated agriculture (Jibirin, 2010). The climate of the area is dry and hot for most part of the year with minimum temperature ranging from 15 to 20°C and maximum range of 37 to 45°C. The annual rainfall ranges from 500 to 700 mm characterized by high variability and intensity. The rainy season usually last from May to September with a relatively low humidity (Nigerian Metrological Agency (NMA), 2008). This is followed by a long dry season. The major river in the area is the Ngadda River which flows through Alau Dam where overbank flows occur. This resulted in the formation of the Jere Bowl (Nyanganji, 1994), which is generally referred to as Fadamas in Hausa language, meaning lowland, floodplain, and valley-bottom around a river.
Both primary and secondary data was used for this study. The primary data were collected with the aid of well-structured questionnaire which was administered to the respondents. The questionnaire contains information on the rice farm inputs (such as seed, fertilizer, labour, water, pesticides and fuel) and farm output (rice grain and straw). A total of 130 farmers were selected from four purposively selected communities using multi-stage sampling procedure. The sampling frame was rice farmers associations of Jere Bowl Borno State. The sample equation was used to determine the number of respondents from each of the community and was expressed as follows:

where n = Sample size, N = Population, and α = Confidence interval.
Analytical techniques
The energy equivalents in Table 1 were used with Equations 1, 2 and 3 to convert the physical amount of inputs and outputs to energy forms expressed in Mj/ha.

Following Gevao et al. (2007), Karale et al. (2008) and Ann (2011), the equations are given as.
(1) Labour energy: The energy of labour in the production was estimated using the following equation:

where Lab = Energy of labour (mj/ha), Lb = Number of working labourers (No), T = Operating time (h), Lf = equivalent energy of labour (mj/h), and a = Area covered (ha).
(2) Energy of water: The energy of water used during irrigation in rice production, was determined using the following equation:

where EW = Energy of water (MJ/ha), DC = Discharge capacity of the water pump (m3/min), T = Time of water application (Min/application), F = Frequency of application (Number of time), Eqf = Energy Equivalent for water (MJ/M3), and a = Area applied (ha).
(3) Energy per unit area for other production inputs such as fertilizer, fuel, pesticides and seed as well as the energy output was expressed as:
EID = RATE . MATENF (4)
where EID = Energy inputs (Mj/ha), RATE = Application rate of Input (unit/ha), and MATENF = Energy equivalent of input (Mj/unit).
Energy indices
To estimate the energy indices in rice production (such as energy ratio, energy productivity, specific energy and net energy), Equations 4, 5, 6 and 7 were used to satisfy objective iii of the study. Following Mohammadi et al. (2008) the energy indices was determined using the following equation:
Energy ratio = Energy output (MJ/ha) / Energy input (MJ/ha) (5)
Energy productivity = Rice output (kg/ha) / Energy input (MJ/ha) (6)
Specific Energy = Total Energy output (MJ/ha)/Grain yield (kg/ha) (7)
Water Productivity = Grain Yield (Kg/ha) / Amount of Water Applied (M3/ha) (8)
Net Energy = Energy output (MJ/ha) - Energy input (MJ/ha) (9)
It is assumed that if the value of energy ratio >1, it means production system is gaining energy, <1; it means production system is losing energy. Similarly, if the energy/water productivity ³1, it means higher productivity and if <1 it means lower productivity (Falaye, 2013; Ibrahim and Ibrahim, 2012).
RESULTS AND DISCUSSION
Level of energy consumption in rice production
Amounts of inputs used and output produced in rice production for each item as well as their energy components per hectare are shown in Table 2. The result revealed that 766.59 h of human labour, 153 kg of seed, 82.07 kg of nitrogen, 15.18 kg of phosphorus, 15.18 kg of potassium, 2.71 L of pesticide, 29,817.76 m3 of irrigation water and 232.09 L of fuel, per hectare were used for the production of rice in the study area. These are equivalent to, 1502.51, 2677.5, 4973.40, 168.51, 101.71, 732.27, 17654.54 and 8581.42 MJ/ha of energy for labour, seed, nitrogen, phosphorus, potassium, pesticide, irrigation water and fuel, respectively. The output gives an average yield of 2867.73 kg/ha of paddy equivalent to 53253.77 MJ of energy was obtained.

Level of energy consumption in rice production which is the total average energy used in various farm operations during rice production in the area was found to be 36,397.85 MJ/ha (Table 2). This is higher than the 23,358.75 MJ/ha reported by Iqbal (2007) in Bangladesh and 12906.8 MJ/ha reported by Ibrahim and Ibrahim (2012) in Nasarawa State in Nigeria. This might be due to the fact that most of the rice farmers were not efficient in their resource used in Jere Bowl (Malah, 2015). Of the total energy inputs consumed, 4.13% was from human labour, 7.36% seed, 14.41% fertilizers (the share of Nitrogen, Phosphorus and Potassium having 13.67, 0.46 and 0.28%, respectively), 2.06% pesticide (the share of insecticides and herbicides having 0.25 and 1.78%, respectively), and 48.51% irrigation water and 23.58% fuel (petrol energy was mainly consumed for irrigation water application) inputs. This indicates that the highest energy inputs were taken up by water and fuel. This is because irrigation operation consumed the maximum energy on the rice farm due to the higher water requirement of rice crop. Rice crop under irrigation was mostly grown with water from tube well and canal water. While the fuel (petrol) energy is mainly utilized by water pumps to run irrigation pump set. This shows the needs for efficient and cost effective irrigation system that will minimize the use of water resulting in less energy requirement.
Forms of energy in rice production
The different forms of energy according to direct, indirect, renewable and non-renewable energy are shown in Table 3. This table revealed that the ratio of direct energy (76.21%) to indirect energy (23.77%) is higher. This indicates that direct energy contribute much to rice production than the indirect energy. This is because water for irrigation and fuel are component of direct energy and both consumed high energy in the production. The table also showed that renewable energy constituted the higher energy (59.98%) while non-renewable constituted only 39.99% of energy to the production system. This implies that rice production system in the area causes less environmental pollution with minimum (39.99%) of non-renewable energy. This finding differs from that of Cherati et al. (2012) in the study of energy and economic analysis of three varieties of rice production in North Iran who reported higher non-renewable energy. This is because fertilizer and agrochemicals which are the major sources of non-renewable energy were not being used adequately by the farmers in Jere Bowl due to its cost and affordability by the farmers.

Energy indices of rice production
The energy indices of rice production estimated in this study were energy ratio, specific energy, energy productivity, water productivity, and net energy.
Energy ratio
Energy ratio is the ratio of total average energy input to total average energy output. Table 3 revealed that the energy ratio in Jere Bowl agro-ecosystems was 2.47. This implies that the farmers in Jere Bowl earn in terms of energy at least 2.47 times of what they put into the production process. This index is lower and could be as a result of inefficient use of some energy inputs due to inefficient irrigation system. This finding compares closely to Alipour et al. (2012) that rice energy ratio in Guilan province of Iran was 2.19 lower than 6.7 rice energy ratio index estimated in Australia by Khan et al. (2010). As rice farm practices in Jere Bowl in Nigeria and Guilan province in Iran are considerably not modernized and efficient as in Australia.
Specific energy
Specific energy is an index which shows how much energy was used to produce one unit of disposable/ marketable yield (rice grain). The lower the index the more efficient is the use of energy in the production system. The result revealed an index of 31.38 MJ/kg (Table 3), indicating that about 31.38 MJ of energy is required to produce only a kilogram of paddy. This implies that there was low grain output in respect to energy inputs used in the production process due to inefficient energy inputs used. This might be due to the inefficient practices of the rice farmers in their production in Jere Bowl as reported by Malah (2015).
Energy productivity
Energy productivity is the yield of marketable product, that is, rice grain per unit of energy consumed. The higher the value (>1), the more energy efficient is the production system. Table 4 shows that energy productivity of rice production in Jere Bowl was 0.147 kg/Mj indicating lower energy productivity. This implies that one Mj of energy used by the farmers produced only 0.147 kg of paddy rice. The lower energy relevance in the area could justify lower productivity on energy consumption in the area. This compares closely to the findings of Asmat (2009) that the rice energy productivity for small, medium and large farmers in Thailand were 0.32, 0.28 and 0.24 kg/Mj, respectively.
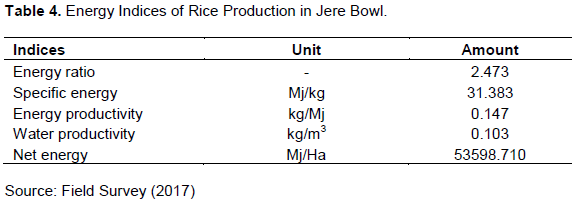
Water productivity
Water productivity is the ratio of rice grain yield to irrigation water consumed. The higher the value (>1) the more water productive is the production. Table 4 shows that the water productivity index in Jere Bowl was 0.103 kg/M3 indicating that water productivity in the Jere Bowl was low. This is apparently because of inefficient irrigation system and ineffective water management. This index was much lower as compared to studies by Khan et al. (2009) in Pakistan with 0.33 kg/m3 for rice crop.
Net energy
The amount of net energy calculated in the Jere Rice Bowl agro-ecosystems was approximately 53,598.71 Mj/ha (Table 4) which was considerably lower than the net energy of 86,050 MJ/ha reported in Bangladesh by Iqbal (2007). This observation could be argued by the statement that overusing of inputs caused increment in consumed energy and lower yield of rice in this region compared to other areas in the world. This is because of inappropriate management practices, planting of low yielding indigenous varieties and perhaps decreasing return to scale could clarify the low yield of rice in this area as well.
All the energy indices measured in Table 4, indicated inefficient use of all the energy inputs. This might affect the sustainability of irrigated rice production in the area because a step towards achieving sustainable production (that is, efficient use of energy inputs).
CONCLUSION
A quantitative energy input-output analysis of irrigated rice production in Jere Bowl Borno State, Nigeria was studied based on the level of energy consumption, forms of energy and some energy indices such as energy ratio, specific energy, energy productivity, water productivity and net energy. On an average, total energy input was estimated as 36,397.85 MJ/ha. The highest energy inputs were taken by water (17654.54 MJ/ha) and fuel use (petrol) (8581.42 MJ/ha). This is because irrigation operation consumed the maximum energy on rice farm due to the higher water requirement of rice crop while the fuel energy is mainly utilized by water pumps to run irrigation pump set. The results on energy indices of rice production indicated 2.47, 31.38 MJ/kg, 0.147 kg/MJ, 0.103 kg/M3 and 53,598.71 Mj/ha for energy ratio, specific energy, energy productivity, water productivity and net energy, respectively indicating lower values of energy indices due to inefficient use of energy inputs.
CONFLICT OF INTERESTS
The authors have not declared any conflict of interests.
REFERENCES
|
Alipour A, Veisi H, Darijani F, Mirbagheri B, Behbahani AG (2012). Study and Determinationof Energy Consumption to Produce Conventional Rice of the Guilan Province. Research in Agricultural Engineering 58(3):99-106. |
|
|
Ann HJ (2011). Calculation of the carbon footprint of Ontario Wheat. SURG Journal 4(2):49-55. |
|
|
Asmat U (2009). A comparative analysis of energy use patterns in Small and large scale irrigated rice farming Systems: A Case Study in Ayutthaya Province in the Central Region of Thailand. (Unpublished Msc theses) Asian Institute of Technology School of Environment, Resources and Development Thailand. |
|
|
Cherati FE, Bahrami H, Asakereh A (2011). Energy Survey of Mechanized and Traditional Rice Production System in Mazandaran Province of Iran. African Journal of Agricultural Research 6(11):2565-2570. |
|
|
Cherati FE, Kamyab S, Shekofteh M, Amraei A (2012). Investigation of energy and economic analysis of three varieties of rice production in North Iran. Research Journal of Applied Sciences, Engineering and Technology 4(16):2666-2671. |
|
|
Erdal GK, Esengun OH, Gunduz O (2007). Energy use and economical analysis of sugar beet production in Tokat province of Turkey. Energy 32:35-41. |
|
|
Falaye A (2013). Energy Input-Output, Optimization of Energy Consumption with DEA Approach for Corn Silage Production in Iran. International Journal of Agriculture and Crop Sciences 5(1):80-88. |
|
|
Gevao SM, Ismail W, Yahya Y, Wan C (2007). Analysis of Energy Consumption in Lowland Rice-Based Cropping System of Malaysia. Energy 27(4):820. |
|
|
Gundogmus E (2006). Energy use on Organic Farming: a Comparative Analysis on Organic versus Conventional Apricot Production on Small Holdings in Turkey. Energy conversion and management 47:3351-3359. |
|
|
Ibrahim HY, Ibrahim HI (2012). Energy Use Analysis for Rice Production in Nasarawa State, Nigeria. Tropical and Subtropical Agroecosystems 15:649-655. |
|
|
Inuwa IMS, KyiogwomAla AL, Maikasuwa MA, Ibrahim ND (2011). Profitability Analysis of Rice Processing and Marketing in Kano State, Nigeria. Nigerian Journal of Basic and Applied Sciences 34(18):2796-3801. |
|
|
Iqbal MT (2007). Energy Input and Output for Production of Boro Rice in Bangladesh. EJEAFChe. 6(5):2144-2149. |
|
|
Jibirin JM (2010). Forms of potassium and potassium absorption in some Fadama soil of Nigeria. Savannah Journal of Agriculture 5:1597-1613. |
|
|
Kaltsas AM, Mamolos AP, Tsatsarelis CA, Nanos GD, Kalburtji KL (2007). Energy Budget in Organic and Conventional Olive Groves. Agriculture, ecosystems and environment 122:243-251. |
|
|
Karale S, Khambalkar V, Bhende B, Sharddha A, Pranali W (2008). Energy Economic of Small Farming Crop Production Operations. World Journal of Agricultural Sciences 4(4):276-482. |
|
|
Khan MA, Awan IU, Zafar J (2009). Energy Requirement and Economic Analysis of Rice Production in Western part of Pakistan. Soil and Environment 28(1):60-67. |
|
|
Khan S, Khan MA, Latif N (2010). Energy Requirements and Economic Analysis of Wheat, Rice and Barley Production in Australia. J. Soil Environ. 29(1):61-68. |
|
|
Malah JB (2015). Technical Efficiency of Rice Producers at the Jere Bowl of Jere Local Government Area of Borno State, Nigeria. Unpublished Msc thesis department of agricultural economics and extension services. University of Maiduguri, Borno state, Nigeria. |
|
|
National Population Census (NPC) (2006). Population Census Data Borno State, Nigeria Federal Republic of Nigeria Official Gazette, National and State Provisional Totals Census. Printed and Published in 2007 by the Federal Government Printer, Lagos, Nigeria. 94(21):175-198. |
|
|
Nigerian Metrological Agency (NMA) (2008). Annual Report. Office Memo File. |
|
|
Nyanganji JK (1994). The Morphology and Hydrography of the Ngadda Catchments and the Bama Beach Ridge" Unpublished PhD Thesis, Bayero University Kano. |
|
|
Singh H, Singh AK, Kushwaha HL, Singh A (2007). Energy consumption pattern of wheat production in India. Energy 32:1848-1854. |
|
Copyright © 2024 Author(s) retain the copyright of this article.
This article is published under the terms of the Creative Commons Attribution License 4.0


