Full Length Research Paper

ABSTRACT
The test weight or hectoliter weight is an important parameter used to classify the quality of the grain. Globally, it is evaluated by using 250, 500 or 1000 ml devices. Despite its importance, there is no standard equipment to assess it in small samples from the research plots. This study aims to test a newly developed microchondrometer (15.30 ml) in the triticale and oats. A second microchondrometer (31.26 ml) was also designed to be tested in oats. The performance of the two microchondrometers, their comparison and relationship with 250 ml commercial chondrometer were analyzed using the t-test and Pearson's correlation coefficient. The results revealed no significant differences between two microchondrometers or their relationship with 250 ml chondrometer by t-test (p> 0.05). Based on two-year evaluations, the correlation between the 250 and 15.30 ml was highly significant (p <0.0001) for triticale (0.9873), and oats (0.9557 for 15.30 ml device and 0.9448 for 31.26 ml device). The correlation between 15.30 and 31.26 ml devices was also highly significant (p <0.0001) for oats (0.9399). These results suggest that in small samples, the 15.30 ml microchondrometer can be used successfully in triticale and oats to assess its test weight.
Key words: Plant breeding, grain density, genotype screening.
INTRODUCTION
The test weight, or hectoliter weight, is an important indicator of grain quality in the milling industry. It is also used to classify the physical quality of cereal grains in international trade, where a test weight over 76 kg hl-1 is considered minimum for high quality wheat (Protic et al., 2007). For commercial purposes, a minimum test weight of 65.0 kg hl-1 is required for triticales (GTA, 2018a) and 52.5 kg hl-1 for oats (GTA, 2018b). Test weight analysis is also conducted in other crops such as millet, pulses, fiber, fodder, oilseed, and green manures (Deivasigamani and Swaminathan, 2018). Besides genetic differences among crop varieties for test weight (Ilker et al., 2009; Iqbal et al., 2016; Mut et al., 2018), it is also affected by environmental factors (Isleib, 2012; Joshi et al., 2018; Silva et al., 2019; Awulachew, 2020).
Manley et al. (2009) describe two types of devices to measure test weight. The first is equipped with a funnel to provide a uniform packaging in a measuring cup of 500 ml (in South Africa and Canada) or 1100 ml (in the USA). The second is a 500 ml chondrometer used in the United Kingdom and Australia or of 1000 ml chondrometer used in Germany and France. For experimental purposes, a small chondrometer (250 ml) has been used in wheat (Stagnari et al., 2008; Durazzo et al., 2015; Botelho et al., 2018), in triticale (Messia et al., 2012; Redaelli et al., 2015; Kuzmanovic et al., 2020) and in oats (Nava et al., 2010; Buerstmayr et al., 2007; Martinez et al., 2010; Da Silva et al., 2015).
The triticale improvement program at the International Wheat and Maize Improvement Center, CIMMYT, Mexico, emphasizes to select genotypes with higher grain density and test weight (Mergoum et al., 2004). A high genetic diversity and stability for grain production and test weight in triticale were observed by Barnett et al. (2006). They believe them to be essential traits for any breeding program to develop cultivars with high yield and test weight, as well as adaptation to a wide range of production environments. Considerable genetic diversity for the test weight in several geographical areas has also been reported by Äekić et al. (2018), who suggested that it is possible to select for specific environments.
In oats, the test weight was positively correlated with the groat percentage and had the highest heritability values among the grain quality characteristics (Buerstmayr et al., 2007). They concluded that selection for better physical appearance of the grains should result in higher test weight, thereby contributing towards the development of oat cultivars that combine higher test weight and earliness. Doehlert and Mcmullen (2008) reported that test weight has a major impact on the monetary value of the oats. They revealed that approximately 78% of the price variation was attributed to the grain density and the remaining to the packaging efficiency, which is the proportion of the container occupied by the grains.
Despite its importance, no specific device has been built to measure the test weight in small samples from studies conducted in greenhouses, plant nutrition, pre-harvest sprouting and crop breeding. Decades ago, Aamodt and Torrie (1934) emphasized the need to determine test weight in small samples of wheat and developed a method by cutting a 25 cm3 graduated cylinder at the 4 cm3 point. Harris and Sibbitt (1941) cut a graduated cylinder at the appropriate height (4 and 16 ml) to determine the test weight. Ghaderi et al. (1971) obtained an excellent correlation (r = 0.982) between the micro-test and the standard test weight. They used a small glass jar (47ml) to assess 59 winter soft wheat cultivars and concluded that the microtest is a reliable predictor.
Similarly, Donelson et al. (2002) used a 100 cm3 graduated glass cylinder to measure the test weight in 20 and 40g of wheat samples. They reported that 40g samples had a higher statistical validity compared to the 20g samples, but the method was severely restricted by wrinkled grains. A few years ago, Stepochkina and Stepochkin (2015) tested 10 lines of common wheat and triticale with a very small cylindrical container (2.86 cm3 in volume). They compared the device with standard 250 ml chondrometer and reported a correlation coefficient of 0.98.
Recently, Okuyama et al. (2020) compared the15.30ml microchondrometer with the 250 ml chondrometer on fifty wheat samples ranging from well-formed grains to severely shriveled and germinated grains. They also reported a highly significant correlation coefficient (r = 0.99) between the two devices. A vast majority of the studies reported in the literature have compared different volumes of graduated cylinders with the standard devices to determine the test weight in wheat. The present study was carried out to confirm the feasibility of using a 15.30 ml microchondrometer in triticale, as well as 15.30 and 31.26 ml in oats to assess their test weight.
MATERIALS AND METHODS
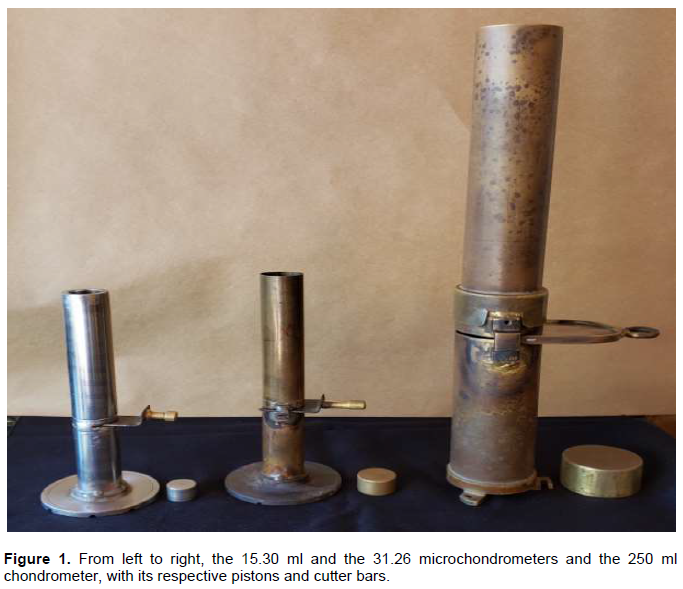
The 15.30 and 31.26 ml microchondrometer were built using the 250ml Dalle Molle® chondrometer as a standard reference (Figure 1). The respective specifications of the 15.30, 31.26 and 250 ml chondrometers are as follows: total height (cm): 18.60, 19,50, 39.00; total weight (g): 639.60, 342,61 and 949.32; external diameter (mm): 28.49, 28,56 and 56.18; cutting bar (g): 16.43, 21,98 and 70.55; piston volume (cm3): 3.59, 7,64 and 61.58, respectively.
Two experiments were conducted to test the efficacy of new microchondrometers to measure the test weight in small samples of triticale (Triticosecale Wittmack) and oats (Avena sativa L.). The research was carried out at the Instituto Agronômico do Paraná (IAPAR), Londrina, Brazil, in 2016 and 2017.
In the first experiment, the efficacy of the 15.30 ml microchondrometer was evaluated using sixty-six triticale samples in the first year and forty-four samples in the second year of the study. The second experiment was conducted to test two microchondrometers (15.30 and 31.26 ml) in thirty-five and nineteen oat samples, in the first and second year, respectively. The grain samples used in the two experiments, approximately one kg each, were obtained from experimental plots and farmers' fields. Some of these samples were forced to sprout in a mist chamber for a period of 24, 30 and 48 h in order to obtain contrasting values of test weight. The test weight was determined by weighing the grains, contained inside the cylinder, on a digital scale (Marte® AS2000; 0.01 g.), and multiplying it by 6.5359, 3.1990, and 0.40, respectively for the 15.30, 31.26 and 250 ml chondrometers.
The first experiment on triticale, consisted of three replications, and compared between 15.30 and 250 ml chondrometers. The second experiment on oats (with tips of grains clipped off) was conducted, in five replications, and compared among 15.30, 31.26 and 250ml chondrometers. All comparisons were analyzed by the Pearson’s correlation coefficient and by the Student t test using Microsoft Excel 2013 software and SAS package (SAS, 2001).
RESULTS
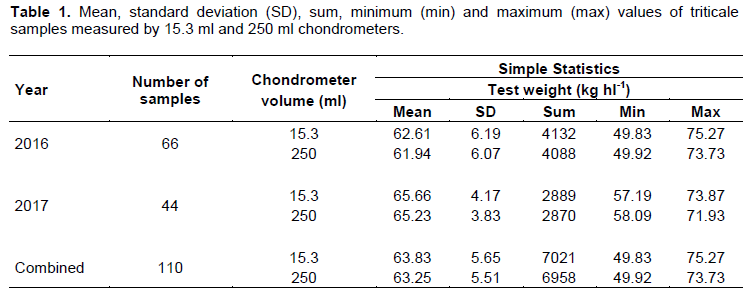
A wide range of the test weight values, over a two-year period, were observed in the triticale grain samples under study. Measured with the 250 ml commercial chondrometer, these values ranged from 49.92 to 73.73 kg hl-1 in the first year, and from 58.09 to 71.93 kg hl-1 in the second year (Table 1). The Student t-test conducted to compare the two chondrometers (250 ml and 15.30 ml) over a two-year period did not show any significant difference (p> 0.05) among their performance (Table 2).

The correlation between test weights measured by the 250 and 15.30 ml chondrometers in triticale was highly significant (p< 0.0001) with values of 0.9907 and 0.9743 for the first and second year, respectively.
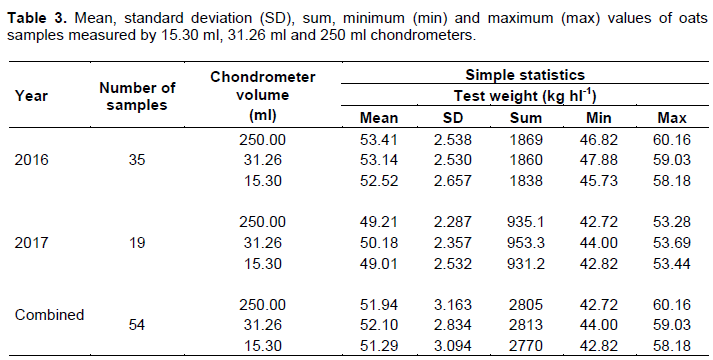
Combining triticale samples from both years, the Student t-test between the two chondrometers (250 and 15.30 ml) did not show any significant difference (p> 0.05) (Table 2). On combined samples, the correlation between the test weight measurements of 250 ml chondrometer and 15.30 ml microchondrometers was highly significant (p <0.0001), with r values of 0.9873. In the experiment on oat samples, the test weight values measured with the commercial 250 ml chondrometer ranged from 46.82 to 60.16 kg hl-1 in the first year and from 42.72 to 53.28 kg hl-1 in the second year (Table 3).
In oats, a comparison among the three chondrometers (250, 15.30 and 31.26 ml) to measure test weights over a two-year period, did not show any significant difference (p> 0.05) among their performance (Table 4). The correlation between test weights measured on the 250 ml chondrometer with 31.26 ml and 15.30 ml microchondrometers in oats were highly significant (p <0.0001), with values of 0.9510, 0.9525 and 0.9076, 0.9181 for the first and the second year of tests, respectively. Furthermore, the correlation between the 31.26 and 15.30 ml microchondrometers was also highly significant (p <0.0001), with r-values of 0.9189 and 0.9203 for the first and second years, respectively.
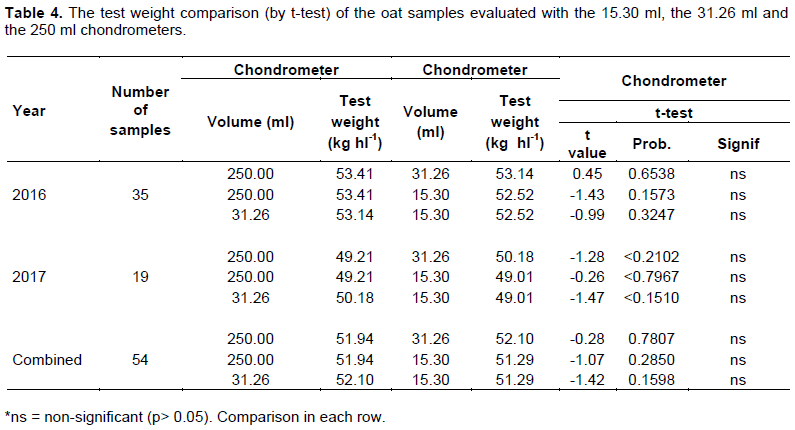
Combining the oat test weight data from two years, the Student t-test among the chondrometers (250 and 15.30 ml), (250 and 31.26 ml) and (31.26 and 15.30 ml) did not show any significant difference (p> 0.05) (Table 4). The correlation values of 250 ml chondrometer with 31.26 and 15.30 ml microchondrometers were highly significant (p <0.0001); with r values of 0.9448, 0.9557, respectively. Furthermore, the correlation between the 31.26 and 15.30 ml microchondrometers was also highly significant (p <0.0001), with r-values of 0.9399.
DISCUSSION
In our earlier study on wheat, it was concluded that 15.30 ml microchondrometer was able to predict the commercial test weight (measured by 250 ml chondrometer) for a wide variety of wheat grain types, forms and densities (Okuyama et al., 2020). Based on this study and considering the similarity between wheat and triticale grains, except for grain density, we decided to further confirm its versatility in triticale as well as in oat grains.
In general, the triticale grains have lower test weight than wheat. The test weight of the samples under study and measured by the commercial 250 ml chondrometer, ranged from 49.92 to 73.73 kg hl-1 in the first year and from 58.09 to 71.93 kg hl-1 in the second year (Table 1). It should be pointed out that 65 kg hl-1 is the minimum test weight value for triticale commercialization in Brazil (Brasil, 1983), and in Australia (GRDC, 2018). Although the triticale samples varied widely, from sprouted kernels to well-formed grains, no significant differences (p> 0.05) in their test weight values were observed when measured on the commercial (250ml) chondrometer or the new prototype (15.30ml) microchondrometer (Table 2). The correlation between the two devices was found to be highly significant (p <0.0001), with r-values of 0.9907 and 0.9743 for the first and second year, respectively. For combined data of two-years, the correlation between them was also highly significant (p <0.0001), with value of 0.9873.
In their study on fifty-nine wheat lines and cultivars, Ghaderi et al. (1971) concluded that the micro-test (evaluated in a 47 ml glass bottle) was a reliable predictor of the test weight (r=0.982). Supporting their results, we also confirm the versatility of the 15.30 ml microchondrometer, to be useful in all experiments producing insufficient grain volume, to determine the test weight by traditional methods. For oats, their irregular size and shape of grains influence their packing in the test weight measuring container (Forsberg and Reeves, 1992). In order to explore the usefulness of the two microchondrometers (31.26 ml and 15.30 ml) to measure the oat test weight correctly, they were compared with the 250 ml chondrometer.
When evaluated with the 250 ml commercial chondrometer, the hectoliter weight for oat samples under study ranged from 46.82 to 60.16 kg hl-1 in the first year and from 42.72 to 53.28 kg hl-1 in the second year (Table 3). For trading purposes, the standard test weight values in oats are as follows: group 1: > 50 kg hl-1; group 2: from 47 to 49 kg hl-1; group 3: from 41 to 46 kg hl-1 and; group 4: <41 kg hl-1 (Brasil, 1975). For international export, a minimum test weight value of 52.5 kg hl-1 is required (GTA, 2018b). The comparison of the 250 ml chondrometer with the 31.26 and 15.30 ml microchondrometers, as well as between the 15.30 with 31.26 ml microchondrometers revealed no significant difference in the test weight values of oat samples over a two-year period of the study (Table 4).
The correlations of the 250 ml chondrometer with 31.26 and 15.30 ml microchondrometers were highly significant (p <0.0001), with values of 0.9510, 0.9525 and 0.9076, 0.9181 for the first and second years, respectively. Similarly, the correlation between the 31.26 and 15.30 ml microchondrometers was also highly significant (p <0.0001), with values of 0.9189 and 0.9203 for the first and second years, respectively.
In a combined analysis for two years, both the 31.26 and 15.30 ml microchondrometers correlated highly (p <0.0001) with the commercial 250 ml chondrometer, with r values of 0.9448, and 0.9557, respectively. Similar relation was observed between 31.26 and 15.30 ml microchondrometers, which was also highly significant (p <0.0001), with r value of 0.9399. Although the correlation values among the devices were slightly lower in oats than those reported in triticale, they were much higher than the values in wheat reported by Aamodt and Torrie (1934). These authors obtained a correlation of 0.834 for 59 samples of winter wheat and concluded that for practical purposes the differences were very small and insignificant. Therefore, we are confident that the 15.30 and 31.26 ml microchondrometers can be used to determine the test weight in oats in a wide range of grain conditions.
The differences in the correlation values obtained between the triticale and oat samples analyzed in this study can be caused by the differences in the size and shape of grains of the two crop species. Yet, the new microchondrometers permit their evaluation successfully under wide range of conditions. We believe its versatility to be very useful in the retention or discarding the genotypes that fail the minimum quality standard demanded by the market. It is worth emphasizing that the 31.26 and 15.30 ml microchondrometers are easier to handle than those manufactured by Taylor (1965). There is no limitation with respect to their utility in severely shrunk kernels, as observed by Donelson et al. (2002) and there is no need to compress or level the samples, as suggested by Stepochkina and Stepochkin (2015).
We reemphasize that the 15.30 and 31.26 microchondrometers were not built with the intention to replace the 250 ml commercial chondrometer, but as an option to assess the test weight in very small samples. We confirm that both of the microchondrometers reported in this study represent valid options for assessing the test weight in the research projects, especially in the evaluation of individual plants and greenhouse experiments, where the sample size is a limiting factor.
CONCLUSION
The highly significant correlation coefficient between the 250 ml chondrometer and the 15.30 ml microchondrometer in triticales and oats, as well as with the 31.26 ml microchondrometer in oats confirms the usefulness of these microchondrometers as an excellent alternative to evaluate the test weight in small samples in these crops. Given the lack of significant differences between the 15.30 ml and the 31.26 ml microchondrometers in oats, it is possible to choose the smaller version, due to the lesser amount of grain needed to evaluate the test weight.
CONFLICT OF INTERESTS
The authors have not declared any conflict of interests.
REFERENCES
|
Aamodt OS, Torrie JH (1934). A simple method for determining the relative weight per bushel of grain from individual wheat plants. Canadian Journal of Research 11:589-593. |
|
|
Awulachew MT (2020). Understanding basics of wheat grain and flour quality. Journal of Health and Environmental Research 6(1):10-26. |
|
|
Barnett RD, Blount AR, Pfahler PL, Bruckner PL, Wesenberg DM, Johnson JW (2006). Environmental stability and heritability estimates for grain yield and test weight in triticale. Journal of Applied Genetics 47(3):207-213 |
|
|
Botelho FM, Faria BMEM, Botelho SCC, Ruffato S, Nogueira RM (2018). Metodologias para determinação de massa específica de grãos. Revista Agrarian 11(41):251-259. |
|
|
Brasil (1983). Ministério da Agricultura, Pecuária e Abastecimento. Portaria nº 53, de 23 de fevereiro de 1983. Estender ao triticale (X Triticosecale) os parâmetros de classificação do trigo-grão e farinha. Diário Oficial [da] República Federativa do Brasil. |
|
|
Brasil (1975). Ministério da Agricultura. Legislação aplicada à agricultura classificação de produtos vegetais. Portaria Ministerial n. 191 de 14 de abril de 1975. |
|
|
Buerstmayr H, Krenn N, Stephan U, Grausgruber H, Zechner E (2007). Agronomic performance and quality of oat (Avena sativa L.) genotypes of worldwide origin produced under Central European growing conditions. Field Crops Research 101(3):343-351. |
|
|
Da Silva JAG, Wohlenberg MD, Arenhardt EG, Oliveira AC, Mazurkievicz G, Müller M, Arenhardt LG, Binelo MO, Arnold G, Pretto R (2015). Adaptability and stability of yield and industrial grain quality with and without fungicide in brazilian oat cultivars. American Journal of Plant Sciences 6:1560-1569. |
|
|
Deivasigamani S, Swaminathan C (2018). Evaluation of Seed Test Weight on Major Field Crops. International Journal of Research Studies in Agricultural Sciences 4(1):8-11. |
|
|
Äekić V, Milivojević J, Branković S (2018). The interaction of genotype and environment on yield and quality components in triticale. Biologica Nyssana 9(1):45-53. |
|
|
Doehlert DC, Mcmullen MS (2008). Oat grain density measurement by sand displacement and analysis of physical components of test weight. Cereal Chemistry 85(5):654-659. |
|
|
Donelson JR, Gaines CS, Andrews LC, Finney PF (2002). Prediction of test weight from a small volume specific gravity measurement. Cereal Chemistry 79(2):227-229. |
|
|
Durazzo A, Casale G, Melini V, Maiani G, Acquistucci R (2015). Evaluation of antioxidant properties in cereals: study of some traditional italian wheats. Foods 4(3):391-399. |
|
|
Forsberg RA, Reeves DL (1992). Breeding oat cultivars for improved grain quality. In: Marshall, HG, Sorrells, ME (Eds.), Oat Science and Technology. Madison,Wi: American Society of Agronomy pp.751-775. |
|
|
Ghaderi A, Everson EH, Yamazaki WT (1971). Test weight in relation to the physical and quality characteristics of soft winter wheat (Triticum aestivum L. em Thell). Crop Science 11(4):515-518. |
|
|
GRDC (2018). Triticale - Section 12 Harvest. GRDC Grownotes. |
|
|
GTA (2018a). Triticale Standards 2018/2019. |
|
|
GTA (2018b). Grain trade Australia. Oats trading standards. 2018/19 Season. |
|
|
Harris RH, Sibbitt LD (1941). An investigation of micro methods in comparison with the stand; method of determining the test weight of hard red spring wheat. Dakota Agricultural Experiment Station Bimonthly Bulletin 3(4):23-27. |
|
|
Ilker E, AltinbaÅŸ M, Tosun M (2009). Selection for test weight and kernel weight in high yielding wheat using a safety-first index. Turkish Journal of Agriculture and Forestry 33(1):37-45. |
|
|
Iqbal M, Moakhar NP, Strenzke K, Haile T, Pozniak C, Hucl P, Spaner, D (2016). Genetic improvement in grain yield and other traits of wheat grown in western Canada. Crop Science 56(2):613-624. |
|
|
Isleib J (2012). Test weight in small grains. Michigan State University Extension. |
|
|
Joshi A, Kumar A, Budhlakoti V, Bhatt N, Prasad B (2018). Analysis of variance and estimation of genetic variability parameters for quality traits in bread wheat (Triticum aestivum L. em. Thell) genotypes. International Journal of Chemical Studies 6(5):369-372. |
|
|
Kuzmanovic' L, Rossini F, Ruggeri R, Pagnotta MA, Ceoloni C (2020). Engineered durum wheat germplasm with multiple alien introgressions: agronomic and quality performance. Agronomy 10(4):1-21. |
|
|
Manley M, Engelbrecht ML, Williams PC, Kidd M (2009). Assessment of variance in the measurement of hectolitre mass of wheat, using equipment from different grain producing and exporting countries. Biosystems Engineering 103(2):176-186. |
|
|
Martinez MF, Arelovich HM, Wehrhahne LN (2010). Grain yield, nutrient content and lipid profile of oat genotypes grown in a semiarid environment. Field Crops Research 116(2):92-100. |
|
|
Mergoum M, Pfeiffer WH, Peña RJ, Ammar K, Rajaram S (2004). Triticale crop improvement: the CIMMYT programme. In: Mergoum M, Macpherson HG (Eds.), Triticale improvement and production. Rome: Food and Agriculture Organization of the United Nations. pp. 11-26. |
|
|
Messia MC, Iafelice G, Marconi E (2012). Effect of parboiling on physical and chemical characteristics and non-enzymatic browning of emmer (Triticum dicoccon Schrank). Journal of Cereal Science 56(2):147-152. |
|
|
Mut Z, Akay H, Köse ÖDE (2018). Grain yield, quality traits and grain yield stability of local oat cultivars. Journal of Soil Science and Plant Nutrition 18(1):269-281. |
|
|
Nava IC, Duarte ITL, Pacheco MT, Federizzi LC (2010). Genetic control of agronomic traits in an oat population of recombinant lines. Crop Breeding and Applied Biotechnology 10(4):305-311. |
|
|
Okuyama LA, Caramori PH, Kohli MM (2020). New microchondrometer to measure hectoliter weight in small samples of wheat. African Journal of Agricultural Research 15(4):524-530. |
|
|
Protic R, Miric M, Protic N, Jovanovic Z, Jovin P (2007). The test weight of several winter wheat genotypes under various sowing dates and nitrogen fertilizer rates. Romanian Agricultural Research 24:43-46. |
|
|
Redaelli R, Scalfati G, Ciccoritti R, Cacciatori P, De Stefanis E, Sgrulletta D (2015). Effects of genetic and agronomic factors on grain composition in oats. Cereal Research Communications 43(1):144-154. |
|
|
Statistical Analysis System (SAS) (2001). Version 8.2.SAS Institute Inc., Cary, NC, USA. |
|
|
Silva RR, Zucareli C, Fonseca CB, Riede CR, Benin G, Gazola D (2019). Timing and growing conditions of nitrogen topdressing influence the grain yield and protein content of four wheat cultivars. Bragantia 78(3):361-370. |
|
|
Stagnari F, Codianni P, Pisante M (2008). Agronomic and kernel quality of ancient wheats grown in central and southern Italy. Cereal Research Communications 36(2):313-326. |
|
|
Stepochkina NI, Stepochkin PI (2015). Use of microchondrometer for determination of grain nature of single plants of triticale and wheat. Dostizheniya nauki i tekhniki APK, 29(11):39-40. |
|
|
Taylor AC (1965). A microchondrometer for determining bushel weight. Australian Journal of Experimental Agriculture and Animal Husbandry 5(17):158-160. |
|
Copyright © 2024 Author(s) retain the copyright of this article.
This article is published under the terms of the Creative Commons Attribution License 4.0


