Full Length Research Paper

ABSTRACT
With increasing global energy demands, the production of biofuels has been gaining economic importance, with the castor oil plant being one option for the production of biofuel. This study was performed on irrigated cultivation of the castor oil plant, variety IAC 2028, from March to October 2011, in Lavras, Minas Gerais, Brazil, with the following aims: a) to characterise and estimate the sub stages and stages of the crop in days after sowing (DAS) and in growing degree days (GDD) and; b) determine a phenological model of development that describes the vegetative and reproductive behavior of the crop cycle. The experiment was conducted under optimal conditions of irrigation and fertilisation. To determine the phenological model, 15 sub stages and 4 stages of the crop were defined and estimated according to the periodic quantification of variables such as the number of leaves, leaf area, soil cover, and periods of floral initiation, anthesis, bean formation, and maturation by raceme order. We concluded that: a) the sub stages were well characterised and estimated, in particular Vo, A2, M2, and M3, which closed stages I, II, III, and IV with nearly 42, 65, 87, and 100% of the thermal power required by the crop during the lifecycle, respectively; b) the phenological model of the sub stages was determined satisfactorily in GDD; and c) the plant and reproductive sub stages were not completely distinguishable, and the maximum soil cover in M1 indicated that greater productivity could occur with a population increase.
Key words: Ricinus communis L., phenological model, phytomass, soil cover fraction, leaf area index.
INTRODUCTION
The castor bean (Ricinus communis L.), is cultivated since the times of the ancient civilizations, the castor bean is a rustic plant, resistant to drought, belonging to the family of Euphorbiaceae, found in many regions of the world, including in semi arid areas where it is commercially cultivated between the parallels 40°N and 40°S. The expansion of its cultivations was mainly due to the capacity of adaptation to different environmental conditions and the many applications of use of its main product, the oil (Paixão et al., 2014). This tropical oilseed crop of relevant economic and social importance, currently, global castor seed annual production is around 1.5 million metric tons with four countries (India, China, Brazil, and Mozambique) accounting for 96% of total production. Although the main producing regions are in the tropics, this crop has been grown commercially on large areas in temperate countries such as the United States and the former USSR (Russia and Ukraine). Castor is still being considered for cultivation in regions that experience cool temperatures (10 to 20°C) that prevail in temperate climates and high elevations during the phase of seed filling (Falasca et al., 2012; Severino et al., 2012). From its seeds is extracted an oil of excellent properties, having wide use as industrial input and several applications. The main product which is obtained from the industrialization of castor is the oil, which has industrial uses for the manufacturing of paints, varnishes, soaps, synthetic fibers, plastics, dyes, aniline and lubricants (Torres et al., 2015). Castor oil is unique among vegetable oil because it is the only commercial source of a hydroxylated fatty acid or ricinoleic acid (Serverino et al., 2012). No other commercial vegetable oil produces such a high level of ricinoleic acid. It appears that the level of ricinoleic acid is not significantly influenced by environment. Serverino et al. (2012) also reported that the high content of ricinoliec acid in castor allows the production of high purity derivatives. Currently, castor oil is also used for energy production and in animal diets (Furtado et al., 2012). Studies by (Pertinari et al., 2012), show that the cultivation of this plant can have operating profits that exceed R$ 1800.00 ha−1 yr−1. Brazil is the third largest producer of castor bean, with a production of 15,800 tons. However, the national productivity of 573 kg ha-1 (harvest 2014/2015), is considered low when compared to crop production potential, (CONAB, 2015). In Brazil, and in particular in the southern region of the state of Minas Gerais, information is lacking regarding the interaction of the castor oil plant with local climatic conditions, water requirements and, in particular, there is a lack of studies on the technical and economic factors affecting its production potential. In this region, the average productivity of 1,310 kg ha-1 is higher than the national average, but is lower than the state average productivity of 1,355 kg ha-1 (Silva et al., 2010). In this context, this study had the following objectives: a) to characterise and estimate the substages and stages of the castor oil plant based on time and temperature using phenological variables; b) to determine a phenological model of development; and c) to describe the vegetative and reproductive behavior of the crop under the climate conditions of the municipality of Lavras, Minas Gerais, Brazil.
MATERIALS AND METHODS
In this study, the variety of castor oil plant examined was IAC 2028. The experiment was conducted in a research area of the campus of the Federal University of Lavras (UFLA), Lavras, Minas Gerais, Brazil (latitude: 21° 14′ S, longitude: 45° 00′ W, and altitude: 918.84 m), between 15 March and 20 October 2011, corresponding to a period of 220 days after sowing (DAS). According to the climate classification proposed by Köppen, the climate of the region is Cwa, with an annual average temperature of 19.4°C, annual average relative humidity of 76.2%, and annual precipitation of 1,530 mm. Climatically, the cultivation period coincides with approximately 27.9% of the annual rainfall of the region, and the period from April to September comprises only 16.7%, because March and October are the months at the end and beginning of the rainy season, respectively. The preparation of soil, classified as an oxisol (Red Hapludox) (Embrapa, 2006), consisted of conventional procedures of ploughing and harrowing. To support crop treatments, fertilisation, irrigation, and chemical, physical, and water content analyses were performed at layers of 0 to 0.20, 0.20 to 0.40, and 0.40 to 0.60 m. The cultivation of the castor oil plant in the pre-set period was conducted in three periods: formation of seedlings, initial establishment of the crop in the field, and differentiation of treatments. The formation of crop seedlings was adopted as a way to ensure the population of plants in the plots and to plan the crop lifecycle outside the rainy season of the region, as previously mentioned. The establishment and standardisation of plants was promoted by irrigation and the natural rainfall occurring at the end of the rainy season. The seedlings were grown in a nursery for the period corresponding to the vegetative sub stages of emergence: the formation of cotyledons at 15 DAS (Ve), and seedlings with two complete leaves ready for planting in the field (Vm) on 21 April (38 DAS). At this point, when the seedlings had reached 0.1 m in high and a stem diameter of 0.005 m, the planting and crop establishment step was initiated.
The seedlings in the Vm substage were planted in holes opened manually in furrows and, planting fertilisation and two cover fertilisations were performed immediately after planting. Weed control was performed manually with a hoe, and diseases and pests were not problematic to the point of requiring recommended chemical control. The Vo sub stage, which began at 86 DAS and was characterised by less than 10% soil cover, represents the end of the initial stage of slow growth (I) according to Allen et al. (1998), and it was followed by the F1 substage from 100 DAS through the initial emergence of the first inflorescences. In the first week, 89 mm of water was applied via irrigation through conventional sprinklers in all experimental units. Following this, different experimental units received different amounts of water via irrigation through dripping, initiating the differentiation of steps between treatments at 104 DAS (26 June 2011).
In this work, distinctions were made between primary, secondary, and tertiary orders of racemes, which were defined as having a maximum of 1, 3, and 6 units, respectively, while the lateral racemes had an indefinite number, following Weiss (1983). These were defined as i) primary racemes: situated in the fork between two of the three most vigorous first adjacent branches of the main stem; ii) secondary racemes: situated just above the primary raceme, between two secondary branches; iii) tertiary racemes: situated just above the secondary racemes, between two tertiary branches; and iv) lateral racemes: situated in the lateral branches of the main stem, just below the primary racemes. After Ve, Vm, and Vo, the remaining 12 sub stages were defined by flowering, anthesis, grain formation, and fruit maturation by primary, secondary, and tertiary orders of racemes: the flowering sub stages, with the initial emergence of the primary (F1), secondary (F2), and tertiary (F3) inflorescences; anthesis sub stages, when more than 50% of examined plants showed emergence of inflorescences (anthesis) in primary (A1), secondary (A2), and tertiary (A3) racemes; the sub stages of maturation, or initial grain filling or equivalent in the primary (G1), secondary (G2), and tertiary (G3) racemes; and maturation substages when, on average, the examined plants showed physiological maturation in more than 70% of the fruits of the primary (M1), secondary (M2), and tertiary (M3) racemes (Figures 1 and 2). The phenological model of the castor oil plant lifecycle, considering the occurrence of the fifteen substages, was sub-divided into stages I, II, III, and IV determined for cultivation according to the criteria and adaptations of Allen et al. (1998) and Rios et al. (2011), as shown in Figure 1. Stage I, initial slow growth, was initiated with sowing, including Ve and Vm, ending in substage Vo. Stage II, accelerated growth, included the substages F1, A1, F2, G1, and A2, finishing with 80% of maximum soil cover. Stage III, production or intermediate, included substages F3, G2, A3, M1, G3, and M2. Consecutively, stage IV initiated with increasing leaf fall, ending in substage M3. For the purpose of this study, the variables for defining the substages and phenological stages were extracted from an experiment where the interaction between the levels of water application and seasons of irrigation suspension were studied. Since phenological knowledge of crop potential with fertilisation and irrigation under optimal conditions is necessary, for the purpose of this work, we adopted the information extracted from the plots with irrigation at 100% of the quantity of water required to elevate the soil unit to the field capacity during the entire crop lifecycle. Thus, 42 plots were separated for sampling the variables and determining fruit ripening. Each plot comprised 4 rows of 4 plants, with the 4 central plants being examined.


A drip irrigation system was used. The irrigation moment was defined by the matric water potential in soil, measured by 4 tensiometers at 0.30 m depth, reaching an average tension of 26 kPa, equivalent to a depletion fraction of 0.6. The water content at what was considered field capacity corresponded to a tension of 6 kPa and to an effective depth of the roots of 0.4 m (Amaral et al., 2005). The irrigation depth and time were calculated according to Cabello (1996), considering the water content obtained from the water retention curve in the soil, a coefficient of distribution uniformity of 95%, and an efficiency of water application through the system of 90%. Periodic evaluations of the characteristics every week or two weeks were performed to determine the phenological substages of the crop, such as the percentage of ripened fruits in the primary, secondary, and tertiary racemes; dry mass of the aboveground part of the castor oil plant, fraction of dry mass from the stem and leaf petioles; total stem dry mass (except leaf blades and roots), included inflorescences, fruits, and racemes; dry mass of the leaf blade; specific leaf area; and total area per plant. In each evaluation, these variables were obtained by an average of three plants chosen randomly from the plots. The specific leaf area was determined by the ratio between the total leaf area and the dry mass of leaves. The dry mass of the aboveground part of the plant was determined by weighing after drying in a forced air oven, at 65°C until obtaining constant weight, and fruit maturation was estimated by raceme order according to Figure 2 (Fanan et al., 2009). In each plot, all of the leaves on 1 of the 4 studied plants were marked with red string once they emerged. Phenological characteristics were also determined, including the number of leaves per plant, percentage of complete ‘adult’ leaves (those previously marked by the red string), and number of complete ‘new’ leaves (recently emerged leaves that had not yet been marked by red string); number of plants with emerged inflorescences; and the presence of primary, secondary, and tertiary racemes. The number of total leaves per plant was the sum of the number of adult leaves and new leaves. The total leaf area per plant was estimated by a photographic method, using a prototype of a new invention attached to the photographic camera, used to measure the unit leaf area obtained directly from destructive samples of leaves extracted from the plant. In field evaluations, the prototype showed identical results to those obtained from a Li-Cor 3000 standard scanner. This measure was obtained from photos processed in the freeware program ImageJ®. The leaf area index (LAI) was calculated as the ratio between the total leaf area and the exposed leaf area occupied by the plant. The soil cover fraction of the crop, a function of the canopy average diameter (D) and spacing (Sf, distance between plants within rows (Sf) × distance between rows (Sp)), was estimated according to Rios et al. (2011), considering the shape as initially a circular area (D ≤ Sp), then rectangular (Sp < D ≤ Sf), and then 100% soil cover (D > Sf). The growing degree days (GDD) accumulated in each substage were calculated by the residual method considering the maximum and minimum air temperatures (°C) of the nth day after sowing (DAS) and basal temperature of the crop (10°C).
RESULTS AND DISCUSSION
The Ve and Vm substages began at 15 and 38 DAS. Primary, secondary, and tertiary inflorescences, corresponding to the beginning of sub stages F1, F2, and F3, appeared on average at 100, 124, and 159 DAS, respectively. Primary and secondary inflorescences had 100% emergence at 124 and 159 DAS. For cultivation under normal conditions there is a difference of 10 days between sowing and emergence; therefore, the timing of initial primary, secondary, and tertiary flowering and productive sub stages differed, respectively, by 20, 29, 44 and 30 days from the values of 70, 85, 105, and 180 days after emergence found by Savy Filho et al. (2007). This lifecycle elongation and phenological sub stage elongation likely occurred because of the temperatures and climate conditions of the cultivation period of this study. The substages Vo, F1, A1, A2, and A3 corresponded to, on average, 10% of maximum soil cover (Vo), initial primary raceme emergence and soil cover of 25% (F1), and more than 50% of primary (A1), secondary (A2), and tertiary (A3) raceme anthesis at 86, 100, 120, 149, and 165 DAS, respectively. We also observed that, on average, primary, secondary, and tertiary maturation began at 141, 163, and 192 DAS, respectively, characterising sub stages G1, G2, and G3, respectively, and reached the maximum grain filling, with more than 70% maturation, at 169, 196, and 220 DAS, respectively (Figure 3). Therefore, there were intervals of 28, 33, and 28 days from the beginning to the end of maturation (or a ‘period of grain formation of the fruits’ of 30 days, on average) and of 69, 72, and 61 days from the emergence of primary, secondary, and tertiary inflorescences, respectively (or ‘period of raceme production’ being 70 days for primary and secondary racemes and 60 days for tertiary racemes, on average). On average, the intervals between flowering and primary, secondary, and tertiary maturation were similar to the 75, 73, and 73 days, respectively, obtained between the beginning of flowering, at 70, 85, and 105 days after emergence, respectively, and the point of harvesting this cultivar at 145, 158, and 178 days after emergence, respectively, found by Savy Filho et al. (2007) and Fanan et al. (2009). The percentage of maturation exceeded 70% for primary, secondary, and tertiary racemes in the sub stages M1, M2, and M3, respectively, at 165, 196, and 220 DAS, respectively.

During the lifecycle (Figure 4), the number of young leaves, adult leaves, and total leaves, on average, fit a cubic curve, and for adult and total leaves, a slow increase was observed until 86 DAS in stage I (Vo), followed by a sharp increase in stage II until 149 DAS (A2). In stage III at 196 DAS (M2), the numbers of adult and total leaves reached their maximum values at the end of the substage M1 (177 DAS), stabilising in this stage. Subsequently, in the final IV stage, from the M2 substage, we observed a strong decrease in the number of adult leaves and total number of leaves until M3 at the end of the lifecycle (220 DAS). It should be noted that, besides the similar behaviour observed between the adult leaf and total leaf curves, there was a progressive reduction in the difference between their values, of approximately 43, 16, 7, 5 and 0%, in the respective sub stages A1, A2, M1, M2, and M3. This indicated that the initial substages had elevated apical meristematic activity developing young leaves and, for the final substages of the crop, a reduction of that activity, with almost no difference in stage IV, in substages M2 and M3 (Figure 4). The average soil cover fractions in substages Vo, F1, A1, A2, M1, M2, and M3 were, respectively, 10, 25, 45, 70, 84, 82, and 65%, and the maximum soil cover of 85% was at 180 DAS, in the M1 substage. This indicates that, to reach 100% soil cover, an increase in productivity is possible with an increase in the population of plants of up to 17% or a reduction of plant spacing to 1.0 × 0.75 cm. The average specific leaf area can be used to evaluate the photosynthetic efficiency of leaves, deduce their contribution to plant growth, and determine the leaf development for photo assimilates during the sub stages (Magalhães, 1986). According to Benincasa (2003), this initially more elevated index (178 cm2 g-1) indicates thinner leaves, with low dry mass and leaf area. This was verified during the initial sub stages of the castor oil plant until sub stage A1 (Figure 5), and stabilised from there until M3 at the end of the lifecycle (average 142 cm2 g-1), with a slight fall after sub stage M2 (average 133 cm2 g-1), possibly associated with leaf senescence or the emergence and/or permanence of thicker leaves with low leaf expansion and with nutrient redistribution. This stabilisation of specific leaf area between A1 and M2 may be explained by the increase in the number of leaves and/or the expansion of leaf area, reflecting a higher photosynthetic capacity. The LAI expresses the photosynthetic capacity of the crop, varying, among other factors, with plant density, which affects both the maximum LAI reached by the crop, and the time elapsed from emergence until growth stabilisation and, consequently, the absorption of incident solar radiation. Kotz (2012) obtained a maximum LAI of less than 3 from the castor oil plant ‘IAC 2028’ at harvesting, close to that obtained in a soya crop (Heiffig et al., 2006). According to Beltrão et al. (2007), the LAI of the castor oil plant crop under non-irrigated conditions varies between 2 and 4. In the first sub stages, the leaf area is small and, as a consequence, the LAI is low, causing large losses in radiation usage, with more light directly reaching exposed soil (Andriolo, 1999; Heiffig, 2002). With the development of the crop and, consequently, of leaf area, the interception of solar radiation reaches a maximum, but still without shading problems for the lower leaves. From this point onwards, when self-shading starts to occur, the lower leaves are in deficit in terms of photosynthesis, and the increase in dry matter and leaf area tends to stabilise.


In stage I, approximately 40% through the lifecycle, but near the beginning of sub stage F1 (at 100 DAS, stage II; Figure 6), growth was very slow, with, on average, approximately 5 leaves per plant, aboveground dry mass of 25 g plant-1, soil cover fraction of 10%, LAI of 0.1, and specific leaf area of 157 cm2 g-1. This initial logarithmic or exponential trend in growth, according to Beltrão et al. (2005), may be associated with the adaptation of seedlings to the field environment, to climate conditions of cultivation outside the recommended season, and morph physiological characteristics, specifically directed in this stage to root establishment. However, it should be emphasized that, in those conditions, considering among other factors, the spacing used and the critical period of prevention of interference from invasive plants, it is possible that castor oil plants could be grown with other annual crops of high economic value and an earlier lifecycle, such as corn, beans, sunflowers, or cucurbits. In stage II, the linear stage, we observed a sharp vegetative growth of the crop until close to the end of that stage in sub stage A2, and the beginning of stage III, at 149 DAS. In stage III, growth occurred with decreasing yields until the end of sub stage M1, at 177 DAS, stabilising until reaching estimated maximum values of 38 leaves per plant, SLA of 1.9, leaf dry mass of 125 g plant-1, and maximum stem dry mass of 300 g plant-1 (MSC), with the end of that stage in sub stage M2, at 196 DAS, when the beginning of the end of stage IV occurred, with a strong decrease in growth, until the end of the lifecycle in sub stage M3, at 220 DAS (Figure 6).

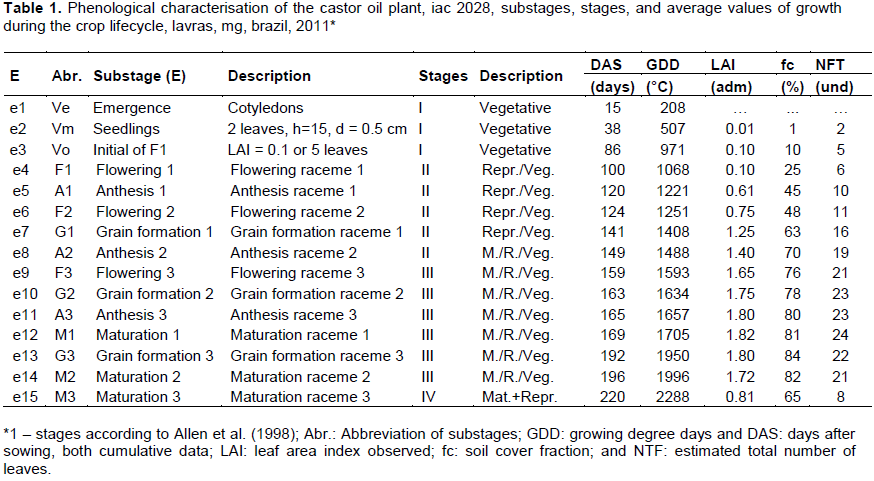
From the beginning to the end of stage IV, there were declines from 38 to 30 leaves per plant; from 1.9 to 0.8 LAI; from 125 to 57 g plant-1 leaf dry mass; and from 300 to 160 g plant-1 stem dry mass. However, at the end of stage IV, the maximum values were reached for total aboveground non-leaf dry matter (810 g plant-1) and total aboveground mass (834 g plant-1; Figure 6). It is worth mentioning the underestimation of estimated total leaves compared to observed total leaves, which probably occurred due to the counting process in the field, with small complete leaves not counted and eventually hidden inside the canopy of the plant. Stages I, II, III, and IV had durations of 86, 63, 47, and 24 days, respectively, corresponding to 39%, 29%, 21%, and 11% of the crop lifecycle, respectively. The first 2 stages were longer, similar to what was reported by Rios et al. (2011). However, these results are unlike those described by Allen et al. (1998) of a lifecycle of 180 days with the last 2 stages of greater duration (III and IV), with percentages in stages I, II, III, and IV of 14, 22, 36, and 28%, respectively. It is worth mentioning that the vegetative growth and reproductive sub stages of those stages were not completely distinguishable, since both continued to occur simultaneously and indefinitely, depending on water availability, soil fertility, favourable weather conditions, and control of pests and diseases. Table 1 summarises the sub stages and stages of the crop, the respective average values of LAI, soil cover, and total leaves per plant previously discussed, in DAS or in GDD accumulated during the lifecycle. Stages I, II, III, and IV had thermal durations of 971, 518, 508, and 291 GDD, respectively (2288 GDD in total), corresponding to 42, 23, 22, and 13% of the lifecycle, respectively.
Taking into account the thermal energy required by the sub stages and stages obtained from Table 1, these thermal requirements may be better described and visualised by a 2-axis graph called a phenological model. In this model, the proportions are specific for each crop or variety, functioning as a ‘fingerprint’, except for the occurrence of deviations from the experimental data (Figure 7). In the phenological model, the axes are the growth axis (X) and total development of the crop (Y) according to the gold ratio (X/Y = f » 1.618), with the measure of the X axis corresponding to the thermal time of the crop lifecycle (2288 GDD, with scale X:2288 GDD), and the measure of the Y axis corresponding to the sum of ‘n steps’ equally weighted (n/N) by the total number (N = 15) of sub stages of the crop (Ve, Vm, ...), and each horizontal interval between steps corresponding to the duration of the sub stages, which also compose the stages I, II, III and IV. Therefore, in order to obtain the total thermal energy from the end of stage I in sub stage Vo, for example, it is enough to measure the X axis and xo in Vo, and deduce the measures Y and yo in Vo by the proportions X/Y = f and n/N = yo/Y, with n and N the numbers, respectively, of sub stages until I(n) and of the crop lifecycle (N). It is worth mentioning the closeness of the sub stages A1 and F2; F3, G2, and A3; and G3 and M2 (Figure 7), which could have been grouped to simplify the phenological model, resulting, in this case, in twelve sub stages, as described by Moshkin as cited by Beltrão (2002) and Silva et al. (2008).

CONCLUSIONS
1) The sub stages were well characterised and estimated, in particular the primary flowering, secondary anthesis, and secondary and tertiary maturation, which finalised the respective stages I, II, III, and IV, with approximately 42, 65, 87, and 100%, respectively, of the thermal energy required during the crop lifecycle.
2) The phenological model, a function of the required thermal energy, number of sub stages, golden ratio, and other criteria, was determined satisfactorily to describe and quantify the sub stages.
3) The crop lifecycle and stages showed longer periods than those described in the literature; however, in the initial stage, cultivation with other crops is possible, considering the spacing used and the critical period for preventing invasive plants. The vegetative and reproductive sub stages occurred simultaneously and indefinitely under favourable conditions, and the maximum soil cover fraction occurred in primary maturation, indicating the potential for an increase in productivity with an increase in the population.
CONFLICT OF INTERESTS
The authors have not declared any conflict of interests.
REFERENCES
|
Andriolo JL (1999). Physiology of protected crops. Santa Maria: UFSM. 142 p. |
|
|
Allen RG, Pereira LS, Raes D, Smith M (1998). Crop evapotranspiration: guidelines for computing crop water requirements. Rome: FAO. 297 p. (FAO. Irrigation and Drainage Paper, 56). |
|
|
Amaral JA B, Silva, MT, Beltrao MS (2005). Agricultural Zoning castor crop in Northeast Brazil 2005-2006. State of Bahia. Campina Grande: Embrapa Cotton. 8 w. (Technical Bulletin 256). |
|
|
Beltrão NEM (2002). Growth and development of castor bean (Ricinus communis L.). Campina Grande. Embrapa CNPA (Technical Notice, 146). |
|
|
Beltrão NEM, Azevedo MP, Lima RLS, Queiroz WN, Queiroz WC (2007). Ecophysiology. In: Azevedo DMP, Beltrao OR. (Ed.) The agribusiness of castor in Brazil. 2. ed. rev. and ampl. Campina Grande: Embrapa Cotton / Brasilia: Embrapa Information Technol. pp. 45-72. |
|
|
Beltrão NEM, Gondim TMS, Pereira JR, LS Severino Cardoso GD (2005). Estimation of primary productivity and partition assimilated into the culture of castor the Brazilian semiarid. Rev. Bra. Ole. Fibrosas, Campina Grande 9(1/3):925-930. |
|
|
Benincasa MMP (2003). Plant Growth Analysis: Understanding. FUNEP. Jaboticabal, Brazil 41 p. |
|
|
Cabello FP (1996). High frequency localized irrigation systems (RLAF) drip, micro spray, exudation. 3. ed. Madrid: Oxford University Press 513 p. |
|
|
Conab (2015). Technical Bulletin Monitoring the Brazilian grain harvest, v. 2 - Safra 2014/15, Brasilia 12:1-134. |
|
|
EMBRAPA (Brazilian Agricultural Research Corporation), National Center for Soil Research (2006). Brazilian System of Soil Classification. 2. ed. Rio de janeiro Brazil 306 p. |
|
|
Falasca SL, Ulberich AC, Ulberich E (2012). Developing an agro-climatic zoning model to determine potential production areas for castor bean (Ricinus communis L.). Ind. Crop Prod. 40:185-191. |
|
|
Fanan S, Medina PF, Camargo MBP, Galbieri R (2009). description of agronomic characteristics and evaluation of harvest in productivityof castor bean cultivar IAC 2028 Bragantia 68(2):415-422. |
|
|
Furtado RN, Carneiro MSS, Cândido MJD, Gomes FHT, Pereira ES, Pompeu RCFF, Sombra WA (2012). Diets Containing Nutritional Value Pie Castor Subjected to Alternative Methods of Detoxification For Sheep. Arq. Bra. Med. Vet. Zootec. 64(1):155-162. |
|
|
Heiffig LS, Câmara, GMS, Marques LA, Pedroso DB, Piedade SMS (2006). Closed canopy and leaf area index of soybean in different space arrangements. Bragantia, Campinas, Brasil 65(2):285-295. |
|
|
Kotz TE (2012). Growth and yield of castor bean IAC 2028 in the off-season due to plant population in reduced spacing. Dissertation (Masters in Agronomy) State -University Paulista "Julio de Mesquita Filho. Faculty of Agricultural Sciences, Botucatu, Brazil 60 p. |
|
|
Magalhães ACN (1986). Quantitative analysis of growth. In: Ferri, M. G. Fisiologia vegetal. São Paulo: EDUSP. 1:331-350 . |
|
|
Paixão FJR, Azevedo CAV OR Beltrao, Santos DB, Wanderley JAC (2013). Seed and castor oil with water deficit and nitrogen. Rev. Educ. Agric. Superior Bras. 28(1):51-55. |
|
|
Pertinari RA, Soratto RP, Souza-Schlick GD, Zanotto MD, Bergamasco SMPP (2012). Production and Profitability Cost Cultivar Mammon in different plants Arrangements. Pesqui. Agric. Trop. 42(2):143-149. |
|
|
Rios GFA, Carvalho LG, Magina FC, Neto PC, Silva BM, Fraga AC (2011). Water consumption and crop coefficient of castor bean in the microregion of Lavras, MG, Brazil. Rev. Bras. Eng. Agric. Ambient. Campina Grande Bras. 15(12):1275-1282. |
|
|
Savy Filho A, Amorim EP, Ramos NP, Martins ALM, Cavichioli JC (2007). IAC-2028: new castor bean cultivar. Pes. Agro. Bras. Bras. Brasil 42(3):449-452. |
|
|
Severino LS, Auld DL, Baldanzi M, Cândido MJD, Chen G, Crosby W, Tan D, He X, Lakshmamma P, Lavanya C, Machado OLT, Mielke T, Milani M, Miller TD, Morris JB, Morse SA, Navas AAA, Soares DJ, Sofiatti V, Wang ML, Zanotto MD, Zieler H (2012). A review on the challenges for increased production of castor. Agron. J. 104:853-880. |
|
|
Silva GH, Esperanicini MST, Bueno OC (2010). economic and energy efficiency of castor production systems in the State of Minas Gerais. Energia na Agricultura. Botucatu: UNESP. 25:1-25. |
|
|
Silva DE, Aires RF, Casagrande JRJG (2008). castor sowing dates in Rio Grande do Sul Pelotas:. Embrapa Temperate Climate. Bull. Res. Dev. 76:1-20. |
|
|
Severino LS, Auld DL, Baldanzi M, Cândido MJD, Chen G, Crosby W, Tan D, He X, Lakshmamma P, Lavanya C, Machado OLT, Mielke T, Milani M, Miller TD, Morris JB, Morse SA, Navas AAA, Soares DJ, Sofiatti V, Wang ML, Zanotto MD, Zieler H (2012). A review on the challenges for increased production of castor. Agron. J. 104:853-880. |
|
|
Torres FE, Teodoro PE, Gomes AC, Hernandes FB, Fernandes RL, Ribeiro LP (2015). Adaptability, agronomic performance and genetic divergence of castor genotypes grown in the Cerrado Pantanal ecotone. Rev. Ciênc. Agrárias Belém 58(1):43-45. |
|
|
Weiss EA (1983). Oilseed crops. New York: Longman 660 p. |
|
Copyright © 2024 Author(s) retain the copyright of this article.
This article is published under the terms of the Creative Commons Attribution License 4.0


