ABSTRACT
A field experiment was conducted to study the genetic variability and association of characters among yield and yield-related traits in castor accessions at Melkassa, central rift valley of Ethiopia during the off season of the 2013/2014. A total of 48 castor accessions were evaluated by using randomized complete block design with three replications. Analysis of variance revealed that there was highly significant difference among the accessions for most of the characters studied. For all traits, phenotypic coefficient of variation was highly higher than genotypic coefficient of variation; this indicates that there was environmental influence on these traits. Those characters which brought high heritability and genetic advance including the moderate one indicate that these characters could be improved through selection easily. Seed yield had positive and significant phenotypic and genotypic association with number of capsules per plant (NCP), number of seeds per plant (SP), number of primary branches per plant (PB), number of secondary branches per plant (SB), length of inter node (LIN), and number of inflorescence per plant (NIP). Oil content (OC) had positive and significant genotypic correlation with seed yield.
Key words: Ethiopia, castor (Ricinus communis L.), correlation, genetic variability, oil content.
Castor (Ricinus communis L.) belongs to the family of Euphorbiaceae and genus Ricinus. It is a diploid plant with chromosome number of 2n=20 (Goodarzi et al., 2012) adapted from lowlands to highlands. It is indigenous to Eastern Africa probably Ethiopia (Anjani, 2012). The plant tolerates moisture stress but not saline or poorly drained soils and requires 600 to 700 mm of rainfall or supplemental irrigation during the growing season (Weiss, 2000). Castor oil is non-edible and has been used almost entirely for pharmaceutical and industrial applications. Castor is a valuable oilseed crop that provides almost the entire world’s supply of hydroxy fatty acids. It is used in varnish, paints, detergent, pharmaceuticals, and synthetic polymers industries. Its oil does not freeze even at high altitudes and it is one the best lubricants for jet engines (Hafiz et al., 2012). Knowledge of genetic and phenotypic diversity in a germplasm is important for the genetic improvement of crop plants. The objective of any breeding program is to develop desirable genotypes with high yield potential and better quality.
Selection is an integral part of breeding program by which genotypes with high productivity in a given environment are selected (Blessing et al., 2012). However, selection for high yield is made difficult by the complex nature of this trait. The polygenic inheritance of yield components makes selection more difficult (Singh et al., 2011). Most of the time, traits are correlated and knowledge of the relationships among various quantitative and qualitative traits is an essential aid to the choice of appropriate parameters to be used as selection indices (Abimiku et al., 2012). The breeding strategy to derive high yielding cultivar depends upon the nature and magnitude of variation for different yield components, the assessment of genetic parameters like phenotypic coefficient of variation, genotypic coefficient of variation, heritability and genetic advance is a pre-requisite for making effective selection.
There exists quite abundant castor germplasm available in Ethiopia (Abebe et al., 1992). However, the country has not benefited from the available plant genetic wealth as a result of poor research and development. Nevertheless, there exists breeding and agronomy research in a limited scale (Getinet et al., 2011). However there has never been scientifically planned study on the variability of castor germplasm. Therefore, Considering the importance of genetic variability as a basic breeding tool for improvement, this study was conducted to evaluate the genetic variability and selection of suitable diverse parents for yield and related traits in future breeding programme.
Description of the study area
Forty eight accessions of castor were planted at the experimental farm of Melkassa Research Center, situated in Central Rift Valley of Oromiya region, Ethiopia during the off season under irrigation. Melkasa is located at 8° 24’N, 39° 12’E, 1550 masl in the hot to warm sub-moist rift valley in the central part of the country and receives an average annual rainfall of 680 mm. Plot size was four rows spaced at 80 cm apart, 60 cm between plants and 6 m long. The design of the experiment was randomized complete block design (RCBD) with three replications. The experimental plots were plowed twice and harrowed once and ridges were made at 80 cm using tractor. Seeds were planted at two seeds per hill and thinned to a single plant after growth. No fertilizer or pesticide was applied. All plots received the required irrigation every 7 days until maturity. Data was collected based on an average of five randomly selected plants and plot basis. Five representative plants per plot were randomly selected from the central rows excluding the two border rows and tagged for observations.
Statistical analysis
Analysis of variance
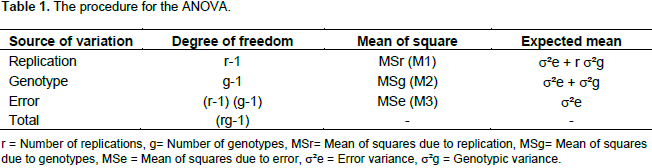
The plot mean values were subjected to statistical analysis according to the procedure of randomized complete block design for each trait as shown on Table 2 (Gomez and Gomez, 1984). Data were subjected to Analysis of Variance (ANOVA) using GLM procedure in SAS statistical software (SAS, 2002) (Table 1).
Estimation of genetic parameters
The phenotypic and genotypic coefficients of variation were estimated according to the method suggested by Burton and de Vane (1953) as follows:
Environmental variance (s2e) = MSE (mean square)
Genotypic variance (s²g) = MSg – Mse / r
Phenotypic variance (s²p) = s²g+s²e
PCV (%) = ÖPhenotypic variance / Population mean for the trait × 100
GCV (%) = ÖGenotypic variance of genotypes / Population mean for the trait × 100
Broad-Sense heritability
Broad sense heritability h2 (bs) expressed as the percentage of the ratio of the genotypic variance (g s2) to the phenotypic variance (sp) and was estimated on genotype mean basis as described by Allard (1960) as:
h2(bs) = (gs2) / (s2p) × 100
where h2 (bs) = heritability in board sense, s2p = phenotypic variance, and sg = genotypic variance.
Genetic advance under selection (GA)
Genetic advance is the improvement over the base population that can potentially be made from selection for a given character (Falconer, 1981). Expected genetic advance (GA) is calculated as:
GA = (k) (бp) (h2bs)
where GA = expected genetic advance; K = constant based on selection intensity (2.06), бp = phenotypic standard deviation, and h2 = heritability in broad sense. Genetic advance as a percent of mean (GAM) which is used to compare the extent of predicted genetic advance of different traits under selection, was computed using the following formula:
GA (%) = Genetic advance / Population mean for the trait × 100
Association of traits
Correlation coefficient (r): Phenotypic and genotypic correlation coefficients were estimated using the standard procedure as suggested by Miller et al. (1958) from corresponding variance and covariance components as:
Phenotypic correlation = rp (xy) = Covp (xy) / ÖVp (x) × ÖVp (Y)
Genotypic correlation= rg (xy) = Covg (xy) / ÖVg (x) ×Ö Vg (Y)
where COVp (xy) and COVg (xy) are phenotypic and genotypic
covariance between x and y traits, while VP (x) and Vg (x) represent variances of X trait and Vp (Y) and Vg (Y) denote variances of Y trait at phenotypic and genotypic level, respectively.
Mean, range and analysis of variance
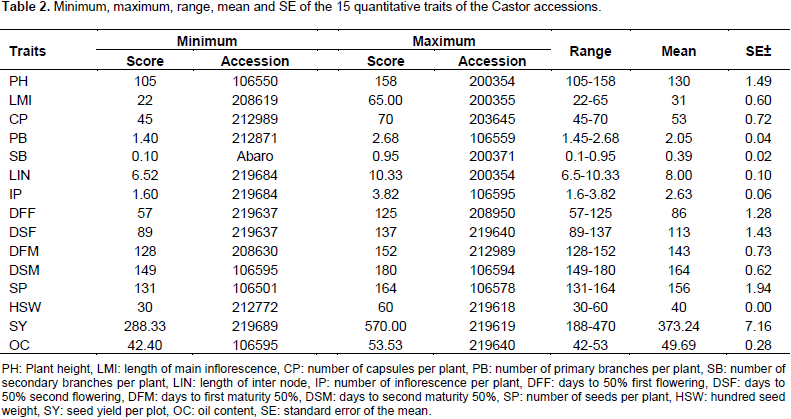
The highest values for oil content (53.53) were obtained from accession 219640 and the lowest (42.4) for accession 106595. Accession 106595 showed the minimum value (149) for days to second maturity and accession 106594 revealed maximum values (180) (Table 2). This was supported by the study of Patel et al. (2010) with the range of oil content 42.50 to 54.86 and 110.00 to 183.33 days to maturity. The variability for agronomic traits observed in this study is sufficient to develop early, short and high yielding variety of castor containing high oil in its seed.
Analysis of variance (ANOVA)
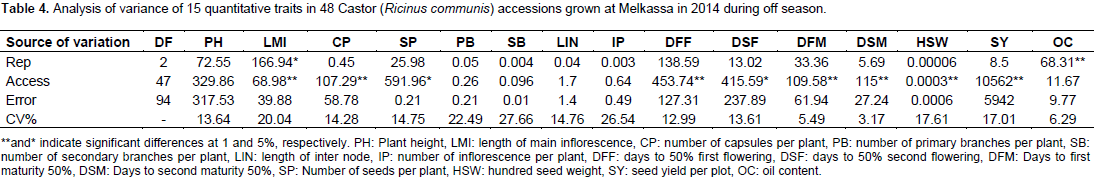
The results of the analysis of variance of 15 quantitative traits indicated that, the mean square due to accession were highly significant (p<0.01) for traits length of main inflorescence, number of capsules per plant, days to first flowering, days to first maturity, days to second maturity, hundred seed weight and plot seed weight (Table 3) indicating sufficient genetic variability for these traits. Days to second flower and number of seeds per plant were significant at (p<0.05). The mean square was non- significant for all other traits.
Estimates of genetic parameters
Estimates of variance components
Environmental and phenotypic variances were highest for plot seed weight followed by plant height and days to flowering indicating that these traits are more influenced by environment. The lowest environmental and phenotypic variances were recorded for number of capsules per plant, number of seeds per plant, number of primary branches per plant, number of secondary branches per plant and length of main inflorescence. The magnitude of phenotypic variation was highest as it is a product of environmental and genetic variability. The genetic variance was highest only for first and second days to flowering next to plot seed weight (Table 4).
Estimates of phenotypic and genotypic coefficient of variation
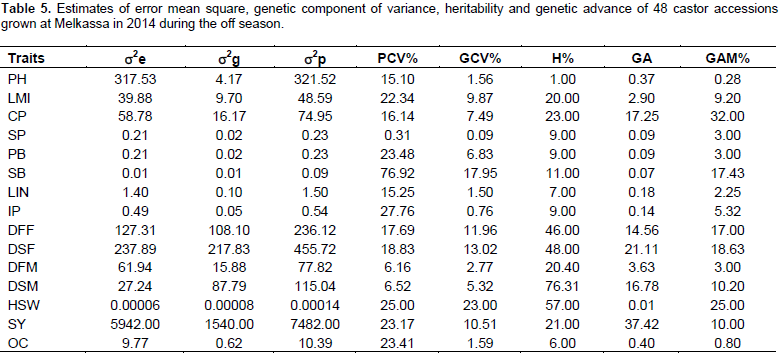
There is little difference between genotypic coefficient of variation and phenotypic coefficient of variation for 100-seed weight and days to second maturity 50%, this implies that the environmental effect was small for the expression of this trait. However, for all the other traits, phenotypic coefficient of variation was greater than genotypic coefficient of variation. This indicated the presence of environmental influence on these traits. Halilu et al. (2013) reported similar PCV (16.14) and nearly similar results GCV (8.5) for number of capsules per plant (Table 4).
Estimates of heritability in a broad sense and genetic advance
Moderate heritability coupled with moderate GA were observed for days to 50% first flowering and moderate heritability with high GA for days to 50% second flowering indicating that these traits are mainly controlled by additive type of genes and that direct selection for these traits could be effective. However, moderate heritability coupled with low GA was observed for 100-seed weight (Table 4). Thus, this trait is controlled by non-additive genes (dominance and epistasis). Low heritability with low GA observed for most of the traits indicates environmental control on the expression of these traits and their improvement could be achieved through heterosis breeding. Obviously, the length of internodes in non-dwarf castor genotypes is highly influenced by soil fertility and availability of moisture. Similarly, oil content is influenced by soil fertility, moisture and temperature (Weiss, 2000). Therefore, the low heritability of internode length and oil content is not surprising. In this study, the heritability was 23% for number of capsules per plant. In a similar study by Halilu et al. (2013) consisting of 30 genotypes, heritability was 32% for number of capsules per plant. The heritability value for number of secondary branches in this study was 11% as compared to 32% in Halilu et al. (2013). This could be probably due to the differences in materials studied (30 in his and 48 in the present study). In addition, the present study was carried out under off season that may have limited expression of the traits fully.
Association of agronomic traits
Seed yield is the result of many traits and is the complex trait. Breeders always look for genetic variation among traits to select desirable types. In this study, yield related traits were investigated for their relationship with yield as well as among themselves using genotypic and phenotypic correlation analysis.
Phenotypic correlation
Phenotypic correlation indicated that seed yield
was highly positively and significantly correlated with number of seeds per plant (r=0.413), number of primary branches per plant (r=0.488), number of secondary branches per plant (r=0.376) and length of inter node (r=0.279), and weakly positively correlated with number of inflorescence per plant (r=0.180) and number of capsules per plant (r=0.318) (Table 5). Hence, more importance should be given to these traits at the time of selection to improve seed yield. In castor, late maturing genotypes had longer main inflorescence, more capsules and seeds per plant and consequently higher yield (MARC, 2011, 2012). This was supported by the positive and highly significantly correlation of plant height with length of main inflorescence (r=0.295), number of capsules per plant (r=0.230), number of primary branches per plant (r=0.357) and number of secondary branches per plant (r=0.122) and positively non-significant correlation with seed yield (r=0.105), oil content (r=0.060) and number of inflorescence per plant (r=0.194) (Table 5).
The positive correlation of number of seeds per plant and seed yield is very clear and as yield is a sum of number of seeds. Similarly, the correlation of number of primary branches with secondary branches is also obvious. The negative correlation of number of seeds per plant with flowering and maturity dates shows that earlier genotypes had lower seed number.Number of inflorescence per plant had positive significant correlation with seed yield (r=0.180) and strongly negative correlation with oil content and days to second flowering, respectively. However, it was negatively non-significantly correlated with the rest of the traits. When castor genotypes are taller and branchy they would have more number of inflorescences and capsules as well as number of seeds per plant and consequently higher seed yield. However, the seeds that are born on the main inflorescence have higher oil content than seeds born on the secondary branches. Similarly, Getinet et al. (2013) reported that the seeds born on the main inflorescence of the variety Hiruy had higher oil content than seeds born on secondary branches. Therefore maximizing the length of main raceme and number of capsules on main raceme is the primary target for increasing oil content per plant. The correlation among flowering and maturity traits was strong and positive. The correlation among flowering and maturity traits with seed yield was strong and negative indicating that early genotypes are low yielders. This is because most early castor genotypes are susceptible to leaf and root diseases while late genotypes mostly had escape/tolerance mechanism.
Genotypic correlation
The positive association of length of main inflorescence with length of inter node and plant height indicates that taller plants had longer inflorescence. However, the plant height can be reduced using dwarfing genes without affecting the nature of inflorescence. Number of capsules per plant exhibited a positive and highly significant correlation with number of seeds per plant (r=0.669), number of secondary branches per plant (r=0.430), number of inflorescence per plant (r=0.372), length of inter node (r=0.540), oil content (r=0.370), seed yield (r=0.304) and number of primary branches per plant (r=0.350) (Table 6). The positive association between seed yield and number of capsules per plant (0.304) was in agreement with the study of Patel et al. (2010). The positive correlation of capsules per plant with number of branches and inflorescences shows that as castor genotypes have more branches it also bears more capsules and seeds. Number of seeds per plant had a positive and highly significant correlation with number of primary branches per plant (r=0.495), number of secondary branches (r=0.370), and length of internode (0.471).
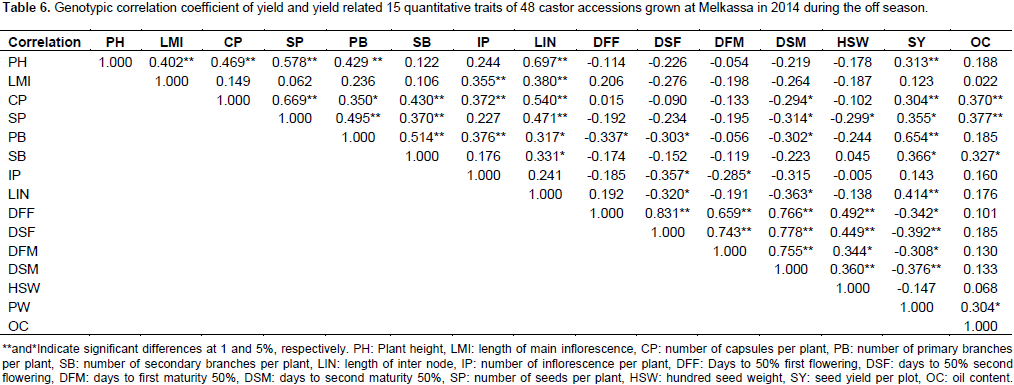
The positive correlation of primary branches with seed yield and secondary branches as well as inflorescence is straight forward. If a castor plants have more branches they are likely to bear more branches, capsules and seeds and consequently higher seed yield. Number of secondary branches per plant had positive and significant correlation with length of inter node (r=0.331), seed yield (r=0.366) and oil content (r=0.327). The positive correlation of number of secondary branches with length of inter node shows that taller plants would likely have more number of branches than shorter plants. While the positive correlation of number of secondary branches with seed yield indicates that as castor plants bear more number of secondary branches they would likely have more seeds and hence higher seed yield. Number of inflorescence per plant had negative and significant correlation with days to 50% second flowering (r=-0.357) and days to first maturity (r=-0.285) indicating that early genotypes have lower number of inflorescence. The negative correlation between length of inter node with days to mature indicates that earlier plants are shorter in height as long internode is associated with tall
The range and mean of agronomic traits obtained in this study indicated that there is sufficient variability in castor germplasm. The range of oil content observed 42.4 to 53.53 with a mean of 42.53% is quite high as compared to the level in other oil seeds such as noug, linseed and sunflower. The analysis of variance also revealed that there is sufficient variability among the 48 accessions. Oil content was negatively correlated with number of capsules and seeds per plant at the genotypic level. This is because as there are more seeds and capsules per plant there is higher competition or partition of photosynthetic product resulting in less oil content. Correlation analysis confirmed that the number of primary branch per plant was the key contributors of seed yield.
The authors have not declared any conflict of interests.
REFERENCES
|
Abebe D, Dawit T, Getahun M, Debritu B (1992). Ethiopia's Oilseed Genetic Resources, in Oilseed Research and Development in Ethiopia, Proceedings of the first National Oilseed Workshop, 3-5 December 1991 Addis Abeba Ethiopia.
|
|
|
|
Abimiku OE, Azagaku ED, Ndor E (2012). Genetic variability and correlation studies in some quantitative characters in castor (Ricinus cummunis. L) Accessions. Asian J. Agric. Sci. 4(6):368-372.
|
|
|
|
|
Allard RW (1960). Some parameters of population variability and their implication in plant breeding. In: A.G. Norman. Advances in Agronomy, Academic Press, New York. pp. 281-325.
|
|
|
|
|
Anjani K (2012). Castor genetic resources: A primary gene pool for exploitation. J. Ind. Crops Prod. 35:1-14.
Crossref
|
|
|
|
|
Blessing CA, Michael IU, Benedict CO (2012). Genetic variability and interrelationship among some Nigerian pumpkin Accessions (Cucurbita spp.) Int. J. Plant Breed. 6(1):34-41.
|
|
|
|
|
Burton GW, de vane EH (1953). Estimating heritability in tall fescue (Festuca arundinacea) from replicated clonal material. Agron. J. 45:481-487.
Crossref
|
|
|
|
|
Falconer DS (1981). Introduction to Quantitative Genetics. 2nd ed. Longman Inc., New York P 350.
|
|
|
|
|
Getinet A, Abel M, Dejene A (2013). Effect of plant and row spacing on the yield and oil contents of castor (Ricinus communis L.) in the Central Rift Valley. Ethiopia, Ethiop. J. Agric. Sci. 24:155-162.
|
|
|
|
|
Getinet A, Bemneet M, Daniel B, Zewdnesh D (2011). Registration of Castor (Racinnus communis L.) Variety Abaro. Ethiop. J. Agric. Sci. 21(1-2):139-140.
|
|
|
|
|
Goodarzi F, Darvishzadeh R, Hassani A, Hassanzaeh A (2012). Study on genetic variation in Iranian castor bean (Ricinus communis L.) accessions using multivariate statistical techniques. J. Med. Plants Res. 6(7):1160-1167.
Crossref
|
|
|
|
|
Gomez KA, Gomez AA (1984). Stastical procedure for agricultural research.2nd ed. John Wily and Sons, Inc. USA. P 680.
|
|
|
|
|
Hafiz MA, Ghulam S, Muhammad A (2012). Genetic variability and interdependence of morphological traits in castorbean (Ricinus communis L) mutants. Songklanakarin J. Sci. Technol. 34(3):279-286.
|
|
|
|
|
Halilu AD, Aba DA, Ogunwole JO (2013). Genetic variability, genetic gain and relationships of yield and yield components in castor (Ricinus communis L.).Department of Plant Science, Institute for Agricultural Resarch, Ahmadu Bello University, Samaru 7(5):181-186.
|
|
|
|
|
Miller PA, Williams C, Robinson HF, Comstock RE (1958). Estimates of Genotypic and environmental variances and co-variances in upland cotton and their Implications in selection. Agron. J. 50:126-131.
Crossref
|
|
|
|
|
Patel JR, Saiyed, MP, Patel CG, Bhatt RK, Bhatt JP (2010). Genetic variability and correlation studies in castor (Ricinus communis L.). Int. J. Agric. Sci. 6(1):129-131.
|
|
|
|
|
Statistical Analysis System (SAS) (2002). SAS/STAT guide for personal computers, version 9.0 editions. SAS Institute Inc., Cary, NC, USA.
|
|
|
|
|
Singh MA, Tomar C, Mishra N, Srivastava SBL (2011).Genetic parameters and character association studies in Indian mustard. J. Oilseed Brassica 2(1):35-38.
|
|
|
|
|
Weiss LA (2000). Oil seed Crops. 2nd Ed., Blackwell Science Ltd., Oxford, England P 70.
|
|