ABSTRACT
Irrigation water pricing has been considered as a tool to enhance water conservation in irrigated agriculture. We have evaluated the effects of water pricing on water management practices in Awash Basin Authority (ABA). The water charge has been collected over years with the aim to generate money for the Awash Basin Authority to cover operational expenses. Both the authority and water users see the charges paid as the contribution than as water demand management tool. Widespread irrigation inefficiency and low performances are more due to low level of irrigator’s knowledge to manage water, poor water conveyance and distribution systems, public ownership over large and medium-scale irrigation schemes, and inability to measure and control water. Increasing water price under such service conditions will only add burden to farmers and unlikely to be feasible. Despite these poor water delivery services, users are willing to pay relatively more than they currently pay which could increase the income of the basin authority. Improvement in irrigation water management requires strengthening of irrigation research and extension services, building the capacity of irrigators, and improving irrigation system operation and maintenance services.
Key words: Irrigation, water pricing, irrigation performance, willingness to pay.
In developing countries like Ethiopia, agricultural sector is the dominant food supplier to the nation and sources of livelihood for more than 85% of the population. Even if the country is known for its abundant water resources potential, this dominant economic sector depends entirely on rainfall. Moreover, 90% of the annual renewable surface water resource is shared with other neighboring countries. With low industrial development and only 16% of the population living in urban areas, agriculture can be considered as the dominate consumer of water. On the other hand, as a result of poor agricultural water management practices, inefficiency in water use is common. According to the Growth and Transformation Plan of the country, agricultural land equipped with small-scale irrigation will expand from 0.85 million ha during the base period (2010/2011) to 1.85 million ha at the end of the planning period (2014/2015). Irrigation development is increasingly considered as one of the strategic pillar for ensuring food security and alleviating poverty.
With increasing population and development needs in agriculture, industry, urbanization and ecosystem services as well as the trans-boundary nature of the country’s water resources, the demand for water will increase. Efficient allocation and use of water becomes imperative. Nevertheless, operation and management of the existing water infrastructures such as irrigation systems is dominated by traditional practices and not well supported by scientific knowledge and tools to enhance efficiencies. These practices are characterized by poor overall performances and inefficient water uses (Awulachew and Mekonen, 2011). The major concerns emanating from such deficiencies in irrigation management are over-irrigation and related poor drainage, rise in groundwater levels, water-logging, salinity and alkalinity development in irrigated areas of the country (Wagnew, 2004; Michael and Awulachew, 2007; Zelalem, 2010; Girma and Fantaw, 2005).
Undesirable consequences of irrigation have the potential to degrade soil fertility, reduce land and water productivity and leading to significant social and economic losses to individuals, households, local communities and country in general (Hussain and Hanjira, 2004; World Bank, 2006). Owing to its flat topography and water availability, Awash River Basin (ABA) is intensively developed for irrigation since late 1950s. The country’s limited large-scale irrigation projects are found in this basin. Increasing development of salinity in lower Awash Valley due to mismanagement of irrigation water represents a serious threat to sustainability of irrigation schemes (Ayenew, 2007).
Several researchers advocate water pricing as policy and economic instrument that enhance efficient use of water (Abu-Madi, 2009; Perry, 2001; Speelman et al., 2009; Dinar and Mody, 2004; Ortega et al., 2004). However, efficient allocation of water through water pricing requires getting the right pricing which in turn is sensitive to social, physical, institutional and political settings (Johansson, 2000).
Awash River Basin is the only basin in Ethiopia where irrigation water pricing is practiced. Awash Basin Authority, which was legally established in 1998 as Awash Bain River Basin Administration Agency has been responsible for integrated management of the waters of the basin. It is reestablished and named as ABA in 2000. Any significant water diversion from the river for irrigation purpose requires the approval of the authority. The ABA collects water charges on volumetric basis from all legal water users who are developing greater than 2 ha of land. The payment is categorized into water charge (3 Birr
[1] per 1000 m
3 of water), operational service payment (84.10 Birr) per hectare of land served per year. The charge rate for irrigation water was set in 1994 by the then Ethiopian Water Resources Development Authority and never modified since then. Charging water use is legalized with the Ethiopian water management proclamation number 115/2005. As stated in the same proclamation, charge for water use is to be determined by the council of ministers. The country has established river basin councils and authorities for all 12 major river basins with the proclamation number 534/2007. This proclamation also stipulates the legality of charging users for water.
The impacts of water pricing on water demand and overall performance of irrigation practice in the Awash Basin has not been assessed. Hence, the aim of this paper is to evaluate the effects of water and service charges on scheme-level irrigation performances and users’ willingness to pay for irrigation water.
[1] Birr is Ethiopian currency (1Birr = 0.05139 USD)
Description of the basin
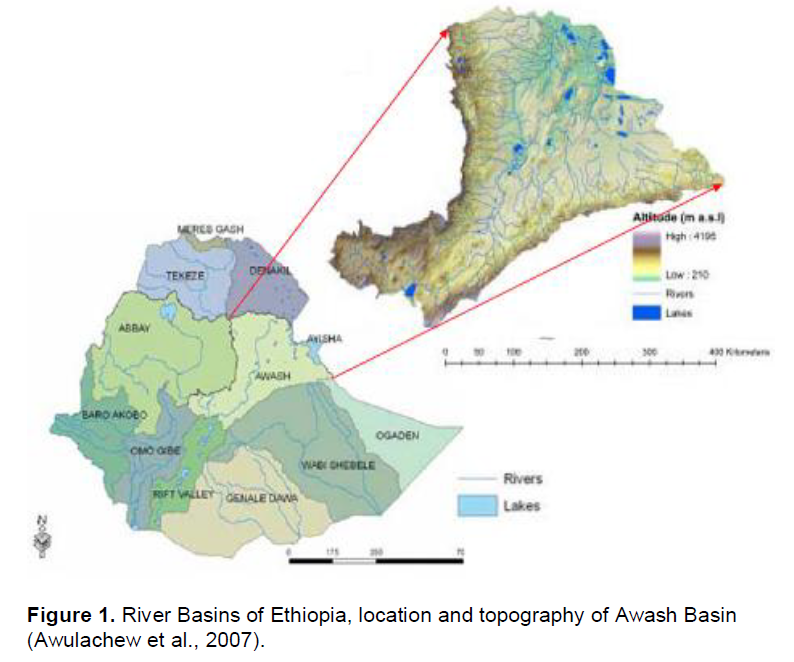
Awash River basin is one of the major 12 river basins in the country. It is part of the Central Rift Valley in Ethiopia ranging from 8.5°N to 12°N and covering an area of about 112,696 km2. The basin covers the central and northern part of the rift valley and is bounded to the west by Blue Nile Basin, to the southeast by Rift valley Lakes Basin and to the south by Wabi Shebele Basin (Figure 1). It originates from Central West part of Ethiopia, flowing 1200 Km long, and provides a number of development opportunities to the country. It is the most intensively utilized river basins in the country. Awash River originates and remains entirely in the country. The river basin has a lowest elevation of 210 m and a highest elevation of 4195 m. The total mean annual flow of the river is estimated to be 4900 million cubic meters per year. Modern irrigation in Ethiopia has started in the Awash Basin during the late 1950s with the objective of producing industrial crops (Awulachew et al., 2007). The irrigation potential of the basin is estimated to be 134,121 ha.
Data used and methods of collection
Primary data
The primary data were generated using structured questionnaires and interviews. About 29 schemes were systematically selected from legally registered irrigation water users. Generally, about 20 small-scale (command area less than 200 ha), 5 medium-scale (200 to 3000 ha) and 4 large-scale (greater than 3000 ha) irrigation schemes were included in the assessment.
The willingness to pay for irrigation, water was assessed using structured questionnaires. The interview was done using two different “bidding games”. The bidding processes ascertained the respondents maximum WTP for a 1000 m3 of irrigation water which is costing only 3 Birr over years. Getting water without price was given as a starting bid and the maximum bid was set 10 Birr per 1000 m3. Then the respondents were allowed to select the final price they would like to pay from 0 to 10 Birr for improved irrigation water supply.
A total of 31 irrigation water users out of 66 legally registered users were interviewed to collect information relevant to willingness to pay for irrigation water. The first round survey and related field observations and data collection were done from March to June 2011 and the second round from September to November 2012.
Secondary data
Scheme specific data such as area cultivated, amount of water diverted to each scheme each year, water fees, service charges, operation and maintenance fees collected for five consecutive production years (2005/2006-2009/2010) were collected from Awash Basin Authority. Climate data such as maximum and mean minimum temperature, relative humidity, wind speed and daily sunshine hours were obtained from nearby meteorological stations viz. Melka Worer, Metehara, Nura Era and Wonji. These data were used to estimate crop and irrigation water requirements using CROPWAT version 8.0.
Market prices of irrigated crops were obtained from the Ethiopian central statistical authority official website (http://www.csa.gov.et), annual reports of the Upper Awash agro-industry, sugar estates and their out growers.
Measurements of performance indicators
Irrigation performance indictors considered in this study are mainly: 1) output indicators such as land and water productivity, 2) water management indicators like: relative water supply, relative irrigation supply, and irrigation efficiency. The description of these indicators and methods of their measurement are given in the following sections.
Land productivity
Land productivity denotes the ratio of farm output, that is, crop yield or its monetary value to cultivated (irrigated) area. Land productivity was calculated for all sampled irrigation schemes over 5 successive production years. It is expressed in terms of harvested crop yield per unit of irrigated area (tons/ha).
Water productivity (WP)
Water productivity can be expressed in terms of physical water productivity, that is, the ratio of agricultural output to the amount of water consumed. Whereas economic water productivity means the value derived per unit of water used (Vazifedoust et al., 2008; Ali and Talukder, 2008; Molden et al., 2010). WP was measured in terms of harvested crop yield per unit of water diverted or supplied (kg/m3)
Water management indicators
Under this category, indicators relevant to measure and compare amount of water demanded and applied were used. These indicators are described as follow:
1. Relative water supply (RWS): The ratio of the total volume of water applied (irrigation plus effective rainfall) to the volume of water required to be applied during the period. Here, the later is only crop water demand.
2. Relative irrigation supply (RIS): The ratio of total volume of irrigation water delivered to the farm to the volume of irrigation water demanded (net irrigation requirement).
These two indicators have been used most often to provide a general sense of whether there is an adequate amount of water or whether the amount of irrigation water supplied is excessive (Molden, et al., 1998; Clemmens and Molden, 2007).
3. Irrigation efficiency (Ei): This is the inverse of relative irrigation water supply as given by Molden et al. (1998) and Jensen (2007).
Econometric models
Logit model was used to identify determinants of willingness to pay for irrigation water. When using the logit model, the dependent variable assumes only two values which show the occurrence and non-occurrence of events (YES or NO). In the first instance, the following factors were identified with the expectation that they affect willingness to pay of water users: educational level, household size, land size, off-farm income, access to credit, irrigation experience, slope of land, and distance to market. The main objective of the logit model is to model the relationship between these factors and the probability of household’s willingness to pay for a randomly offered bid price. In this setting, the dependent variable is dichotomous and assumes 1 if the household is willing to pay the specified price level for the use of irrigation water and 0 otherwise. The binary choice model which is used to determine the farmer’s average willingness to pay for irrigation water and the determinants of willingness to pay of irrigation users can be given as:

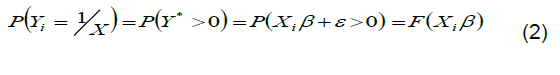
Where Y* is the response variable, Xi is a vector of explanatory variables, β is a vector of parameters to be estimated, and ε is the error term. However, the response variable Y* is unobservable. The assumption is that an individual chooses to pay if the utility difference exceeds a certain threshold level, which can be set to zero. As a result, if Yi = 1 (paying for water) if Y* > 0 and Yi = 0 (not paying for water) otherwise. Therefore, the probability that a household is willing to pay the specified bid level for irrigation water is given by:
Where, F is the cumulative distribution function. This is structural model for estimating the probability and it can be estimated either using a probit or logit model, depending on the assumption on the distribution of the error term (Green, 2003).
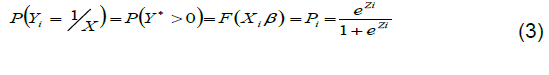
To estimate water users willingness to pay (WTP) for irrigation water, probit model was employed (Haneman et al., 1991). The probit model estimation of the average WTP only considers the bid values with no consideration of other factors that influence household decision on willingness to pay. Therefore, by choosing the logistic cumulative distribution function in Equation (2) for the logit model, the probability that the household is willing to pay for irrigation water is given by:
Where Zi is a linear function of n- explanatory variables (X) and can be stated as
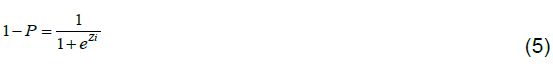
If P is the probability that the household is willing to pay for the use of irrigation water, then 1-P, the probability of not willing to pay, is given by:
However, this expression can be written as
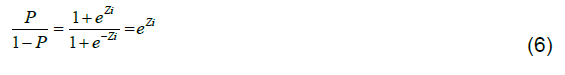
Where P/(1-P) is the odds ratio or the ratio of the probability that a household is willing to pay for irrigation water supply to the probability that a household is not. Taking the natural logarithm of Equation 6, the log of the odds ratio, which is known as logit model is given by:
In which β0 is an intercept which indicates the log-odds in favor of paying for the use of irrigation water when the coefficients of all included explanatory variable are assumed to be zero. But, β1, β2, β3 and …βk are slope parameters to be estimated in the model. The slope tells how the log-odds in favor of paying for the use of irrigation water change as each independent variable changes. Equation 8 was used to identify factors affecting water user’s willingness to pay for irrigation water.
Assuming that the probability of irrigator’s willing to pay for irrigation water supply is a linear function of bid value; the following probit model is specified to determine the average WTP of irrigation users:
By dividing the intercept (?0) by the coefficient associated with the bid value (?1) of Equation 9, the average willingness to pay for irrigation water can be determined.
On-farm irrigation performance
Land development and water use
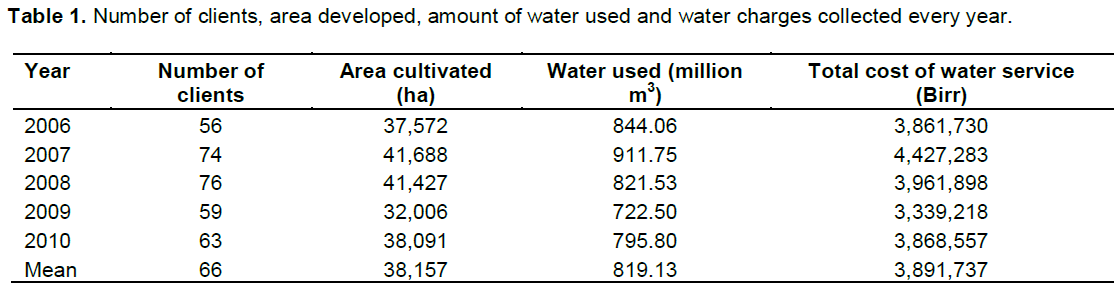
The total amount of water diverted annually by registered water users as measured by the basin authority is given in Table 1. Mean annual water used to develop 38,157 ha of irrigated area is about 819.13 million cubic meters. This is about 16.7% of estimated annual flow of the Awash River. In return for use of this amount of water, the authority collected on average 3.9 million Birr per year which is about 197,465 US$. This amount does not include maintenance charge which is variable based on area served and maintenance needs. For instance the maintenance charge was about 145 and 433 Birr/ha in 2006 and 2010, respectively. However, maintenance services provided by the authority are most often limited to removal of silt from the main systems. The basin authority lacks information system for collection, management and processing of hydrological and land resources of the basin for effective planning and sustainable utilization of land and water.
Irrigation efficiency and water pricing
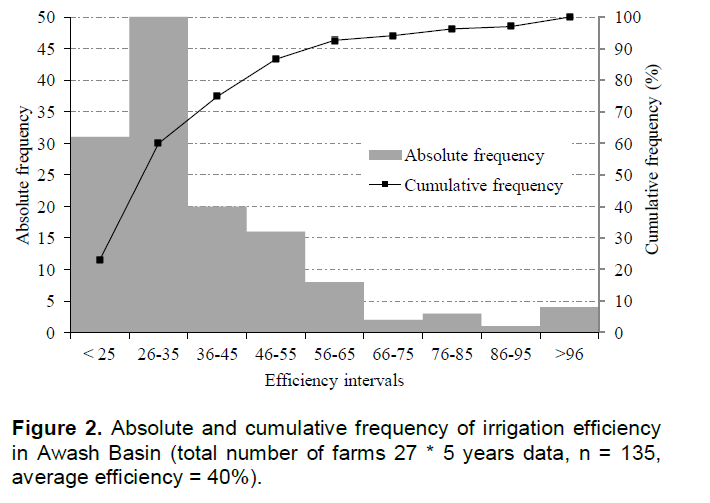
Figure 2 shows the irrigation efficiencies of 27 farms operated over 5 years. The efficiencies varied from 10% to more than 95%. However, 60% of the total samples considered (n = 135) operate with an irrigation efficiency of less than 35%. Whereas 75% of the total samples considered could achieve only an efficiency value of less than 45%. Higher efficiencies greater than 55% were obtained only by 14% of the total samples. The overall average irrigation efficiency is about 40%. Negative consequences of such inefficiency are widespread in middle and lower regions of the basin. Over-irrigation together with absence of proper drainage system in most of irrigation schemes in the basin has been causing rise in groundwater table, water-logging and salinity (Girma and Fantaw, 2005; Zelalem, 2010). These problems are increasingly threatening the sustainability of irrigation development in the basin (Dagnachew and Ayenew, 2006; Ayenew, 2007).
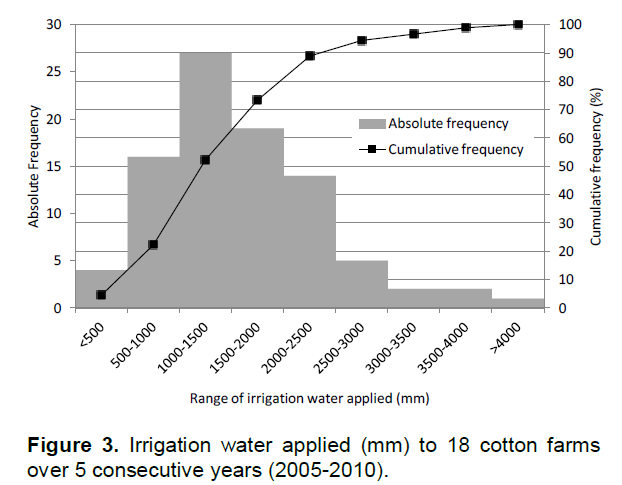
The extents of water applied to 18 cotton farms over 5 consecutive years are presented in Figure 3. Irrigation water depth applied is highly variable ranging between 228 and 4223 mm per season. Mean seasonal crop water requirement for cotton varied between 760 and 870 mm. In comparison to the water demand, about 89% of sample cotton farms and 72% of sugar cane farms are over-irrigating their farms. Surface irrigation methods such as furrow, boarder and basin irrigation are widely practiced in the basin. These water application methods together with low level of irrigator’s knowledge are contributing to inefficient irrigation. The fact that most of the irrigators do not keep records of their production costs and revenue, they do not feel the income reduction effects of the low water charge.
Observed effects of over-irrigation and lack of proper drainage in the basin are wide-ranging. As a result of groundwater rise, Beseka Lake which is highly saline lake found in the middle of the basin is increasingly expanding occupying many settlement areas and agricultural lands (Tamiru et al., 2006; Ayenew, 2007).
In principle, pricing irrigation water is expected to enhance water conservation by reducing demand (Dinar and Mody, 2004; Rogers et al., 2002; Molle and Berkoff, 2007). However, getting the right price that encourages irrigators to conserve water by remaining in irrigation business is a challenge (Johansson, 2000). Moreover, several researchers report the low price elasticity of irrigation water demand (Salman and Al-Karablieh, 2004; Doppler et al., 2002; Ruijis et al., 2008; Yang et al., 2003). Berbel and Gomez-Limon (2000) indicated that water pricing as a single instrument for controlling water use is not an appropriate means to significantly reduce agricultural water consumption. This is because consumption is not reduced until prices reach such a level that they negatively affect farm income and agricultural employment. A rational farmer may respond in different ways to falling net income resulting from higher water pricing which according to Molle et al. (2008) include: (a) saving water by improving on-farm water management practices, (b) adopting improved irrigation technology, (c) shifting cropping patterns to less water demanding crops, (d) renting out land, or discontinuing agriculture in the case of a tenant, (e) other secondary responses (illegal water use, bribery, and tampering of structures). Most of these measures are targeting more to the reduction of water demand and not enhancing production which in turn lead to decreasing income. Salman and Al-Karablieh (2004) found in the highland areas of Jordan that water prices up to US$ 0.35/m3 reduce farmers’ income without any effect on the production structure, but prices higher than US$ 0.35 reduce the cultivated area and drive most agricultural production alternatives into unprofitable situations. Speelman et al. (2009) also reported that further increases in water prices beyond a certain level have not only limited additional effect on the efficient use of water because the higher prices do not only decreases water use but also reduce the profit of the farmers. At higher water pricing rate some farmers which are not profitable anymore may quit from farming activities which leads to water saving at sectoral level (Speelman et al., 2009) but leads to reduced agricultural production which in turn affects negatively the livelihoods of rural community.
The pricing level practiced in Awash River Basin (0.00015 US$/m3) is low compared to 0.33 US$/m3 Palestine (Abu-Amadi, 2009), 0.024 US$/m3 in Jordan (Doppler et al., 2002), 0.02 US$/m3 in Morocco (Dinar and Mody, 2004). Comparison of farms operating under water pricing and non-pricing system in the basin indicated that there is no significant difference in their overall performance including irrigation efficiency (Kibrom, 2012). This leads to the conclusion that the current pricing mechanism as a financial incentive is not adequate to encourage irrigators to conserve water and also invest in water saving irrigation technologies.
On the other hand, it is difficult to relate inefficiencies observed in the basin with low level of pricing. Because, excess application of water than the crop demand is attributed to the “more water input – more yields” perception of local irrigators, lack of knowledge about soil – water – plant relationships and uncertainty of getting water for the next irrigation and associated risk aversion tendency of farmers. Moreover, poor water delivery, distribution and application systems are contributing to water losses and hence inefficiencies. Most of all, the pricing scheme and mechanism of collecting charges are focusing more on fund raising for the authority than encouraging efficient water management and covering service costs. Proclamation number 129/1998 legalizes the basin authority to collect water charges to cover its budget requirements. In some instances, group of farmers are using common off-take structures. The amount of water measured at these control points is divided by the number of served farms to determine the water charge. Under such condition where sometimes involved farms are equally charged for water, there is no incentive to conserve water. Although the principle of volumetric water pricing system is adapted, inability to accurately measure the quantity of water provided to or received by each irrigator remains a crucial problem.
Output performances
Productivity (tons/ha)
Productivity performance of irrigated crops can be measured using indicators such as yield or monetary value of the total produce per unit of area. Most often the land productivity is measured in terms of yield per units of land used. The values of land productivity in terms of yield per hectare for cotton, sugarcane and onion over consecutive five years (2006-2010) are given in Table 2. The values varied not only from year to year but also between farms within the year.
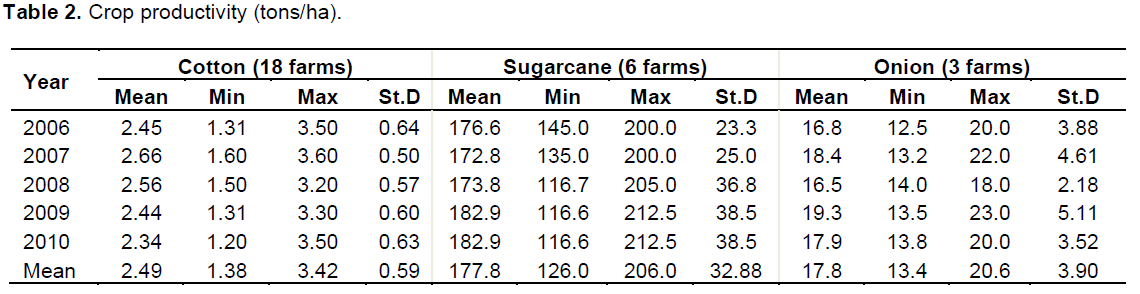
The five years consecutive observation of cotton productivity in eighteen farms in the Awash Basin showed results that varied from 1.2 to 3.6 tons/ha. Under optimum irrigation practices at Melka Werer research center in the same Basin, the productivity of cotton was reported to be 3.5 tons/ha (Tilahun, 2010) which is close to the maximum production obtained from eighteen farms over five years. The mean productivity across the years ranges from 2.34 to 2.66 tons/ha. Pereira et al. (2009) reported an average productivity of about 3.7 tons/ha for cotton in central Asia under full irrigation.
The productivity of sugarcane as measured in six farms over five years ranged from a minimum of 116.6 tons/ha to a maximum of 212.5 tons/ha. The standard deviation (St.D) varied from 23.3 to 38.5 tons/ha. This productivity gap represents huge potential that could be tapped through improvement of management practices. FAO (2012) considers 120 tons/ha of fresh cane yield as a good yield worldwide. The productivity of onion ranged from 12.5 to 23.0 tons/ha and the average is about 18 tons/ha. Compared to the production under research condition at Meka Werer in the same Basin which is about 35 tons/ha (Tilahun, 2010), the production obtained from three farms over five years is low. Kumar et al. (2007) reported that an average productivity of onion in Punjab areas of India under full irrigation was about 32 tons/ha which is by far higher than this result.
Water productivity (WP)
The basic idea behind relating the amount of crop yield produced to the amount of water used is that the water consumed by transpiration is in exchange for the assimilation of carbon dioxide (through plant stomata) leading to the production of biomass (that is, the total volume of vegetative matter produced) of which usually only a part is harvested as yield (Perry et al., 2009). However, it is difficult most often to make separation between water used for transpiration and evaporation. As a result total amount of water applied to the filed during the production period was considered to measure WP (Ali and Talukder, 2008).
The mean water productivity of crops considered is presented in Table 3. The values of WP ranged from 0.03 to 0.52 kg/m3 for cotton, 4.4 to 13.5 kg/m3 for sugarcane and 1.0 to 1.8 kg/m3 for onion. Evidently, inefficiencies discussed in the previous sections have negative influences on WP. In areas like Awash Bain, where water scarcity is not yet an issue, WP has got less attention. Irrigators are less interested in high WP value unless the resulting crop yield is increased.
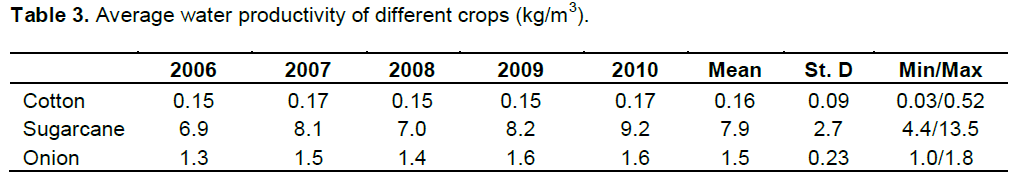
Zwart and Bastiaansse (2004), after reviewing more than 16 published sources from different countries, have found that the water productivity of cotton varies between 0.10 and 0.37 kg/m3. The results found in Awash River Basin shows maximum water productivity value of about 0.52 kg/m3 which is greater than literature value. Regassa et al. (2007) found that the water productivity of cotton and sugarcane in India is 1.70 and 5.95 kg/m3 under conventional irrigation, respectively. The authors provided evidences of enhanced water productivity by adoption of water saving irrigation technologies. Compared to the water productivity range of 3 to 10 kg/m3 given by Molden et al. (2010) for onion, the values found here are low.
Under current condition wherein water scarcity is not a problem, concerns about WP is related to mitigation of undesirable consequences of over-irrigation such as water-logging, salinity and yield reduction. The WP in the basin could be enhanced by improvement of the irrigation management practices which are currently inefficient as described in the previous sections.
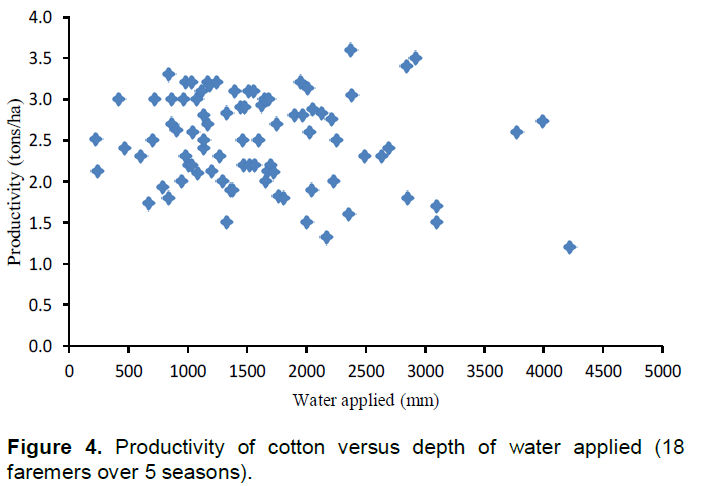
Figure 4 shows the relationship between amounts of water applied and cotton yield per unit of land cultivated. The common trend of crop-water-production function depicts that the crop yield will increase with increasing water application up to a certain optimum level which results a maximum crop yield beyond which additional water application results in decreasing productivity. However, the results found here show decreasing trend indicating excess application portion of crop-water-production function.
The results show that there are significant productivity differences between irrigators who applied more or less same amounts of water. This might be attributed to differences in management practices including timing of water application and other inputs such as fertilizers. This variation in water use efficiency suggests that there is significant scope for inefficient farms to improve their practices to use water and other inputs more productively.
Irrigation water supply performances
Water supply performances were evaluated using three performance indicators, that is, relative irrigation supply, relative water supply and water delivery ratio. The results are presented in Tables 4 and 5.
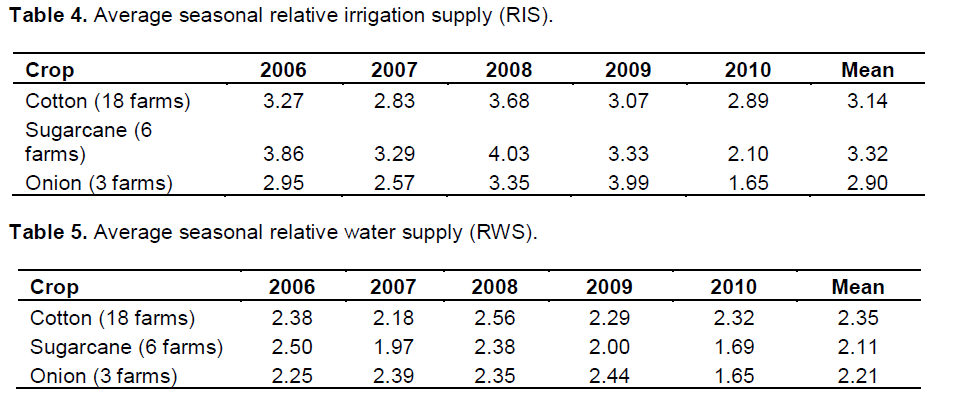
The results show that the values of all indicators considered are greater than unity implying that water supplied to the farms were in excess of the requirements. The average relative irrigation supply (RIS) was greater than 3 under cotton and sugarcane farms. This indicator compares specially the amount of irrigation water diverted to the fields with the amount of irrigation water actually required.
The relative water supply (RWS) on the other hand relates the total volume of water applied (irrigation plus effective rainfall) to the volume of water required by the crops. The values of RWS range from 2.18 to 2.38 for cotton, from 1.69 to 2.50 for sugarcane and from 1.65 to 2.39 for onion. Results of RIS and RWS under this section validate the finds of oversupply of water discussed under irrigation efficiency.
Performance of charge collection
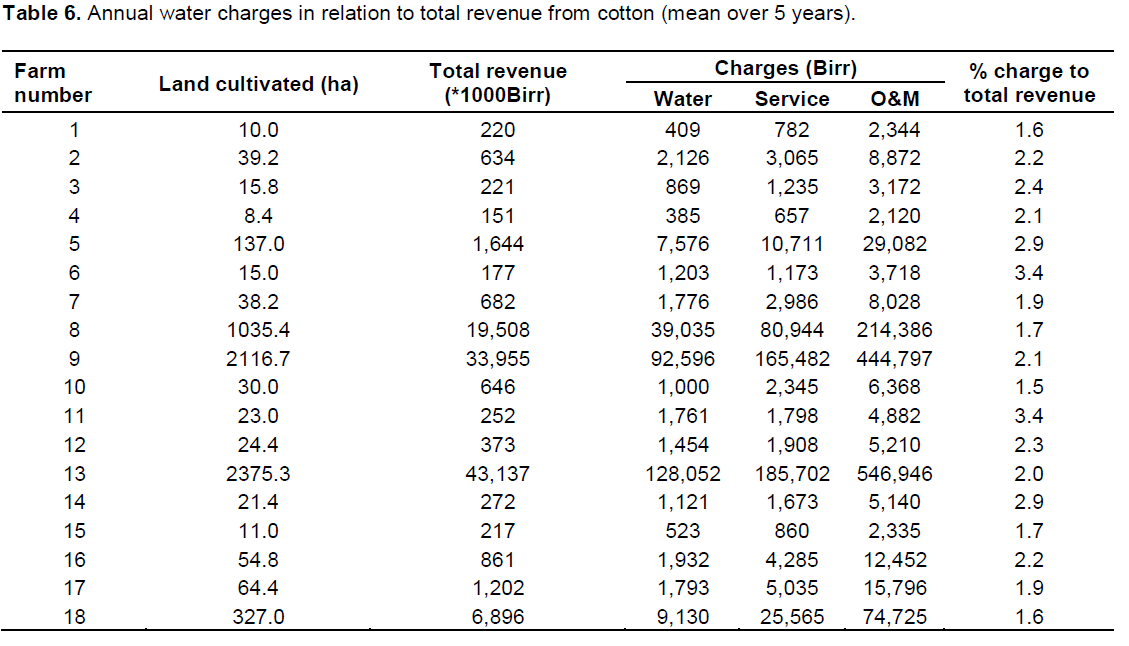
Mean annual collected charges by ABA in relation to area developed and annual farms revenues are presented in Table 6. The water charge collected from farms ranges from 1.5 to 3.4% of the total farm revenue which is comparatively very low.
The largest proportion of payment is due to service charges and O&M. These cost categories are not related to amount of water used. Rather they are dependent on area cultivated and hence cannot encourage irrigators to use water efficiently. As argued by Speelman et al. (2009), the effect of irrigation charges on agricultural water use efficiency might be insignificant if irrigation water costs represent too small a proportion of the total production costs. However, as the total costs of production inputs are not considered here, it is difficult to judge the value of water in relation to total revenue.
Results of econometric models
Determinants of WTP
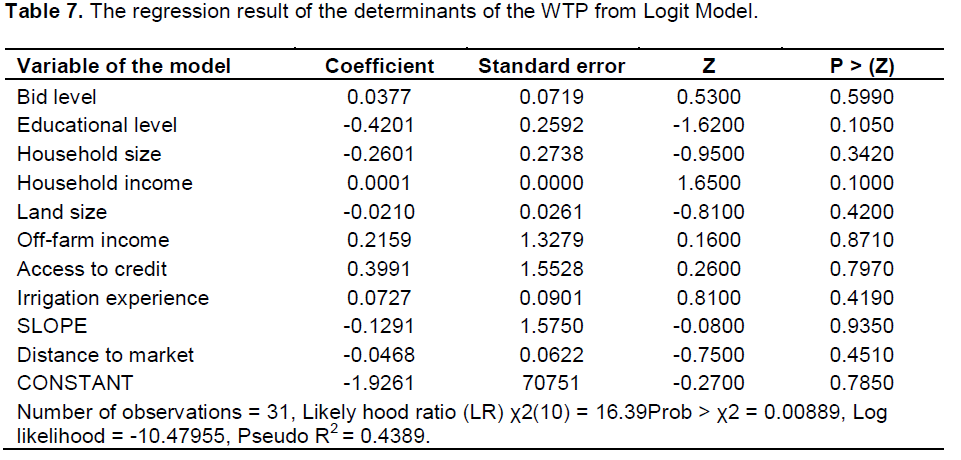
The results of the logit model, to identify factors affecting water user’s willingness to pay for irrigation water are presented in Table 7. As it can be seen from the coefficient column, some factors such as educational level, household size, land size, land slop and distance to market are negatively related to WTP. Whereas factors like bid level, household income, off-farm income, access to credit, experience of irrigation are positively related to WTP.
Relatively educated respondents had the fear of increased price if they identify themselves willing to pay. Speelman et al. (2008) found that education has got insignificant impact on efficiency of water which they attributed to low average education level in their samples. Family size is also negatively related to willingness to pay off a household.
A household with access to credit and off-farm activities is willing to pay for irrigation water than those households with no access. Irrigators with longer irrigation experiences are also more willing to pay than those relatively short periods of experience.
The land size is also negatively related to WTP. This is because, as the size of the land increases so does the total annual water charges and this decreases the willingness to pay off a household for irrigation water supply.
However, all the regressors have a significant impact on the willingness to pay of farmers for irrigation water supply, as the LR statistic is 16.39, whose p value is about 0.00889, which is very small.
However, a more meaningful interpretation of logit model is in terms of odds ratio, which are obtained by taking the antilog of the various slope coefficients. Thus, if the antilog of the off-farm income coefficient of 0.2159 is considered, then the result will be 1.2410. This suggests that farmers who are participating in off-farm activities are more than 1 times likely to pay for irrigation water than those who have no access to off-farm activities.
Average WTP for irrigation water
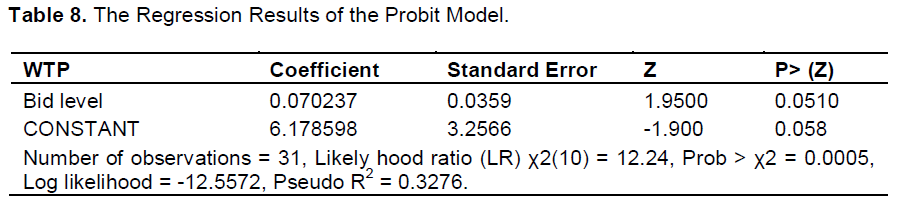
The average willingness to pay of irrigation users using the probit model is determined as: Average WTP = b0/b1 where ?0 is a constant term and ?1 is the coefficient of the bid level. The results of the model are presented in Table 8.
The result from the probit model shows that the average willingness to pay off a farm household for irrigation service is 88 Birr per hectare of land served per year. This is about 11% more than the current level of pricing, that is, 78.11 Birr. The average willingness to pay of irrigation users for irrigation water is found to be 3.50 Birr per 1000 m3 instead of the current charge which is 3 Birr.
The current irrigation water pricing system in Awash Basin has got no influence on the performance of irrigation practices. The water charge adapted by the basin authority is fixed in 1994 by the then Ethiopian Water Resources Development Authority. Although, irrigation development is proceeding quite intensively and the need for proper management of the river basin becomes imperative, the price level has never changed since then. It is apparently low compared to the pricing levels practiced in many countries (Easter and Liu, 2005). According to Ethiopian Water Resources Management Regulations (115/2005), Council of Ministers is responsible to determine water charges. Nevertheless, charge for irrigation water has not been legally determined.
Moreover, the current collection of water and service charges in the basin has been serving more, the purposes of fund raising to enable the basin authority exist than providing improved water services. Given insignificant contribution of the collected water and service charges to water management, water users are willing to pay 17 and 11% more water and service charges respectively compared to the current prices. Even with the additional money, the users are willing to pay for the current poor level of services they are getting which is low; this extra amount could be used to improve the water delivery services.
It is quite clear that increasing the water charge to the level of WTP found in this study would increase the income of the basin authority but reduces that of the farmer’s income without much impact on water management practices. So far, water scarcity is not felt as a problem in the basin. As a result, the basin authority and irrigators have not been worried about water allocation and efficiency in water use. However, the fact that Awash River basin is the most intensively developed basin in the country, the importance of its sustainable use and management should not be overlooked. Over-irrigation coupled with lack of proper drainage system in the basin is adversely affecting agricultural production and the environment (Zelalem, 2010; Ayenew, 2007; Dagnachew and Ayenew, 2006; Tamiru et al., 2006; Wondimagegne and Abere, 2012).
Large-scale irrigation schemes which are the dominant users of the basin’s water are operated by public agencies and funded from public resources. Hence, the change in operational procedures followed by these agencies can effectively be made through government polices than a simple rise in water charge. These schemes divert several hundred million cubic meters of water every year. Hence, there is huge water saving positional in these schemes which could be tapped through improvement of irrigation management. Pricing water will have only limited influence on public agency operated schemes as the money is paid from the public pocket.
Given the existing low level of farmer’s knowledge about irrigation, widespread poverty and food insecurity, lack of capacity to afford improved technologies, government ownership over large-scale irrigation schemes, it is unlikely that increased pricing will translate into water management improvement. Introduction of increased pricing policies without improving water provision and other input services would add burden to small-scale farmers and will not be feasible.
The pricing system in the basin has been serving two purposes. First, generating revenue for the basin authority to exist and operate. Second, covering maintenance costs of primary canals which most often are limited to removal of silt. So, neither irrigators nor the authority considers water pricing as a measure of water demand management. The basin authority needs to build its capacity to be able to monitor the water resources of the basin, ensure efficient allocation and management of the basin’s water. Most of all, implementation of volumetric water pricing system requires capacity to measure the amount of water used by individual farms and improvement of water delivery and distribution systems to minimize losses. This requires high investment and operational capacities.
The author(s) have not declared any conflict of interest.
This study was conducted with the financial support of Ministry of Water, Irrigation and Energy. The authors would like to extend sincerely thanks to Arba Minch University for logistic supports grated during field work and Awash Basin Authority for provision of information required for the study.
REFERENCES
Abu-Madi MO (2009). Farm-level perspectives regarding irrigation water pricing in Turkarm District, Palestine. Agric. Water Manage. 96:1344-1350.
CrossRef |
|
|
Ali MH, Talukder MSU (2008). Increasing water productivity in crop production-A synthesis. Agric. Water Manage. 95:1201-1213.
CrossRef |
|
|
|
Awulachew SB, Mekonen A (2011). Performance of irrigation: An assessment at different scales in Ethiopia. Exper. Agric. 47(Sl):57-69. |
|
|
|
Awulachew SA, Aster DY, Makonnen L, Willibald L, Mekonnen A, Tena A (2007). Water resources and irrigation development in Ethiopia. IWMI Working Sri Lanka Colombo. P. 123. |
|
|
Ayenew T (2007). Water management problems in the Ethiopian rift: Challenges for development. J. Afr. Earth Sci. 48:222–236.
CrossRef |
|
|
Berbel J, Gomez-Limon JA (2000). The impact of water-pricing policy in Spain: an analysis of three irrigated areas. Agric. Water Manage 43:219-238.
CrossRef |
|
|
Clemmens AJ, Molden DJ (2007). Water uses and productivity of irrigation systems. Irrigat. Sci. 25:247–261.
CrossRef |
|
|
Dagnachew L, Ayenew T (2006). Effect of improper water and land resource utilization on the central Main Ethiopian Rift lakes. Quaternary International. 148:8–18
CrossRef |
|
|
|
Dinar A, Mody J (2004). Irrigation water management policies: Allocation and pricing principles and implementation experience. Nat. Resou. Forum. 28:112-122. |
|
|
Doppler W, Salman AZ, Al-Karablieh EK, Wolff H-P (2002). The impact of water pricing strategies on the allocation of irrigation water: the case of the Jordan Valley. Agric. Water Manage. 55:171-182.
CrossRef |
|
|
|
Easter KW, Liu Y (2005). Cost recovery and water pricing for irrigation and drainage projects. Agriculture and Rural Development Discussion the World Bank P. 26. |
|
|
|
FAO (2012). Crop yield response to water. FAO Irrigation and Drainage P. 66. Rome, Italy. |
|
|
|
Girma T, Fantaw A (2005). The nature and properties of salt affected soils in Middle Awash. |
|
|
|
Green (2003). Econometric Analysis. 5th edition, New York University. |
|
|
Haneman M, Loomisand J, Kanninen B (1991). Statistical efficiency of double bounded dichotomous choice valuation. Am. J. Agric. Econ. 73:1255-1263.
CrossRef |
|
|
Hussain I, Hanjira MA (2004). Irrigation and poverty alleviation: Review of the empirical evidence. Irrigat. Drain. 53:1-15.
CrossRef |
|
|
Jensen ME (2007). Beyond irrigation efficiency. Irrigat. Sci. 25:233-245.
CrossRef |
|
|
|
Johansson RC (2000). Pricing irrigation water. A literature survey. Policy research working World Bank P. 2449. |
|
|
|
Kibrom M (2012). Performance Evaluation of Amibara irrigation project with and without water pricing: The case of Middle Awash River Basin of Ethiopia. MSc Thesis, Arba Minch University, Ethiopia. |
|
|
|
Kumar S, Imtiyaz M, Kumar A, Singh R (2007). Response of onion (Allium cepa L.) to different levels of irrigation. Agric. ater Manage. 89:161-166. |
|
|
|
Michael M, Awulachew SB (2007). Irrigation practice in Ethiopia. Characterization of selected irrigation schemes. International Water Management Institute, Working P. 124. Sri Lanka, Colombo. |
|
|
Molden D, Oweis T, Steduto P, Bindraban S, Hanjra MA, Kijne J (2010). Improving agricultural water productivity: between optimism and caution. Agric. Water Manage. 97:528-535.
CrossRef |
|
|
|
Molden D, Sakthivadivel R, Perry CJ, de Fraiture C (1998). Indicators for Comparing Performance of Irrigated Agricultural Systems. IWMI Research Report, Colombo Sri Lanka P. 20. |
|
|
|
Molle F, Venot JP, Hassan Y (2008). Irrigation in the Jordan Valley: Are water pricing policies overly optimistic. Agric. ater Manage. 95:427-438. |
|
|
|
Molle F, Berkoff J (2007). Water Pricing in Irrigation: Mapping the Debate in the Light of Experience, in: Molle, F., Berkoff (eds), Irrigation water pricing. CAB International, pp. 21-93. |
|
|
Ortega JF, de Juan JA, Tarjuelo JM (2004). Evaluation of the water cost effect on water resource management: Application to typical crops in a semiarid region. Agric. Water Manage. 66:125–144.
CrossRef |
|
|
Pereira LS, Paredes P, Cholpankulov ED, Inchenkova OP, Teodoro PR (2009). Irrigation scheduling strategies for cotton to cope with water scarcity in the Fergana Valley, Central Asia. Agric. Water Manage. 96:723-735.
CrossRef |
|
|
Perry C (2001). Water at any price? Issues and options in charging for irrigation water. Irrigat. Drain. 50:1-7.
CrossRef |
|
|
Perry C, Steduto P, Allen RG, Burt CM (2009). Increasing productivity in irrigated agriculture: Agronomic constraints and hydrological realities. Agric. Water Manage. 96:1517-1524.
CrossRef |
|
|
Salman AZ, Al-Karablieh E (2004). Measuring the willingness of farmers to pay for groundwater in the highland areas of Jordan. Agric. Water Manage. 68:61-76.
CrossRef |
|
|
|
Speelman S, Buysse J, Farolfi S, Frija A, D'Haese M, D'Haese, L (2009). Estimating the impacts of water pricing on smallholder irrigators in North West Province, South Africa. Agric. ater Manage. 96:1560-1566. |
|
|
Speelman S, D'Haese M, Buysse J, D'Haese L (2008). A measure for the efficiency of water use and its determinants, a case study of small-scale irrigation schemes in North-West Province, South Afr. Agric. Syst. 98:31–39.
CrossRef |
|
|
Tamiru A. Tenalem A, Seifu K (2006). Hydrogeochemical and lake level changes in the Ethiopian Rift. J. Hydrol. 316 (1-4):290-300.
CrossRef |
|
|
|
Wondimagegne C, Abere M (2012). Selected physical and chemical characteristics of soils of middle Awash irrigated farm lands, Ethiopia. Ethiop. J. Agric. Sci. 22:127-142. |
|
|
|
Zelalem A (2010). Assessment of water-logging problem and determination of drainage parameters for the design of drainage system at Wonji Sugar Estate. MSc thesis. Arba Minch University, Ethiopia. |
|
|
Zwart SJ, Bastiaansse WGM (2004). Review of measured crop water productivity values for irrigated wheat, rice, cotton and maize. Agric. Water Manage. 69:115-133.
CrossRef |