The aim of this study was to compare the agronomic performance of RR soybean genotypes with conventional soybean genotypes derived from two-way crosses and evaluate through path analysis the influence of important traits for culture on the grain yield (GY) in the Northwestern of São Paulo, Brazil. It was used the randomized block design with three replications. Among the analyzed RR genotypes, three genotypes has high GY, with average values over 4575.5 kg ha-1, while among the conventional, ten genotypes, and the check Conquista showed superiority for GY, with average values over 3511.4 Kg ha-1. In general, the most productive RR soybean genotypes showed higher values when compared with conventional genotypes with higher yield. However, conventional soybean showed a higher number of superior genotypes with similar behavior when compared to the RR soybean. For the group of RR soybean genotypes, all agronomic traits, except one hundred seed weight (HSW), correlated positively with GY. For the group of conventional soybean genotypes, there was no significant correlation between GY and all agronomic traits analyzed. The genotypic correlation and path analysis indicate the plant height at flowering (PHF) and plant height at maturity (PHM) as the most favorable and direct effect on GY.
Soybean (Glycine max (L.) Merrill] is considered one of the most important crops in Brazil due to be the most widely grown in different regions, moving significantly the economy and generating jobs and rents. Brazilian soybean production in crop year 2015/16 was 95.43 millions of tons of grain, consolidating the country as the second largest producer of the world. In São Paulo state,in the crop year 2015/2016, the area cultivated with soybean was 857,600 hectares, with an average productivity of grains of 3316 kg ha-1 and production of 2.84 millions of tons of grains (Conab, 2016). It is noteworthy that the high level of soybean production has great contribution of breeding with the development of transgenic cultivars.
The area sown with Roundup Ready (RR) cultivars in Brazil reached 93.5% of the total area, corresponding to 29.4 million hectares (Céleres, 2015). According to Lima et al. (2008) and Matsuo et al. (2009), the adoption of RR cultivars is based on the ease of management of areas infested with weeds, allowing the efficient check of weeds in post-emergence stage.
Since the implementation of RR soybeans in commercial crops, there have been some questions about the efficiency of production of these cultivars when compared to conventional cultivars. In the literature, some of the studies already carried out, comparing both, have demonstrated differences in agronomic performance (Fonseca et al., 2013; Lima et al., 2008; Lima et al., 2015). The soybean agronomic performance is greatly influenced by the interaction genotype x environment, which makes difficult the identification of adapted and stable genotypes for the different growing regions (Batista et al., 2015; Branquinho et al., 2014). So, to recommend new cultivars, regional studies aimed at minimizing the environmental effects of developing cultivars are always needed (Azevedo et al., 2015; Gomez et al., 2014).
In soybeans, as in other crops, grain yield is a complex character, as it is the result of the expression and association of several factors that act indirectly and interact with each other. Knowledge of associations between traits, estimated by genetic correlations, is of great importance in plant breeding because it provides information that helps the breeder in the selection process (Malik et al., 2007; Nogueira et al., 2012). For low-heritability and/or difficult-to-assess traits, the indirect selection can be adopted, by using another trait that has high heritability and/or is easy to assess, provided that this another trait is highly correlated with that which is of difficult direct selection (Almeida et al., 2010).
The breakdown of the correlation coefficients in direct and indirect effects of agronomic traits, which act on the grain yield by path analysis, is of great importance because it allows a more precise identification of the key traits that determine productivity (Akram et al., 2011; Alcântara Neto et al., 2011).
In order to supply the demand of soybean genotypes with high productivity of grains, and specific to the northwestern region of São Paulo, the soybean breeding program of the FCAV/UNESP –Jaboticabal/SP - Brasil, it is focused in the conduction of final competition tests for the identification of genotypes with optimal agronomic performance.
Given the dearth of information and research that contrast the agronomic performance of RR soybeans with conventional soybeans, comparative studies between genotypes of both groups become important. Therefore, the aim of this study was to compare the agronomic performance of RR soybean genotypes with Conventional soybean genotypes deriving from two-way crosses and evaluate through path analysis the influence of important traits for the culture on the grain yield in the Northwestern of São Paulo, Brazil.
Two experiments were conducted in the agricultural year 2014/15 in the Teaching, Research and Extension Farm (FEPE) of the São Paulo State University "Julio de Mesquit a Filho" UNESP- FCAV- Jaboticabal Campus, latitude 21° 15' 22" S and longitude 48° 18' 58" W, with an approximate altitude of 595 m. The soil of the experimental area is classified as eutrophic Red Latosol (Oxisol) (Santos et al., 2013), with gently rolling relief. The climate has hot and humid summers and dry winters with average annual temperature of 22.2°C and average annual rainfall of 1,451 mm (Vianna et al., 2013). Sowing was mechanically held on November 18, 2014, for the two experiments.
The experiments were conducted in randomized blocks experimental design (RBD), experiment I (27 RR genotypes and two checks) and experiment II (23 conventional genotypes and two checks) with three replications. Each experimental plot consisted of four rows of 5 m long, spaced 0.5 m between rows. The two central rows were considered as useful area, despising 0.5 m from each end, totaling 4 m².
Prior to sowing, there was plowing and harrowing of the soil. The fertilization was performed according to the requirements of the culture, after previous soil analysis, by applying 350 kg ha-1 of the formula 00-20-20. Seeds were inoculated with inoculant Gelfix 5 (Rhizobium). The experimental plots were maintained throughout the crop cycle, with strict check of pests, diseases and weeds, as recommended for the soybean crop. All the above mentioned cultivation traits were made in accordance with the recommendations of Embrapa Soja (Embrapa, 2013).
The genotypes used were developed from two-way crosses between carriers of the RR gene and the conventional. The RR generators were cultivars of commercial soybeans and the conventional generators were soybean lines with good agronomic performance for traits related to grain production, belonging to the genetic breeding program of the Paulista State University - UNESP / FCAV - Jaboticabal-SP, namely: C4 (M 8336 RR x JAB.00-01-21/4M1D), C5 (M 7578 RR x JAB.00-05-5/4A2D), C6 (M 7908 RR x JAB.00-05-5/4A2D), C7 (M 8221 RR x JAB.00-05-5/4A2D), C8 (M 7211 RR x JAB.00-05-1/5C3B), C9 (M 7639 RR x JAB.00-05-1/5C3B), C10 (M 8211 RR x JAB.00-05-1/5C3B), C11 (M 8336 RR x JAB.00-05-1/5C3B), C12 (M 8360 RR x JAB.00-05-1/5C3B), C13 (M 7211 RR x JAB.00-05-8/2D3C), C14 (M 7636 RR x JAB.00-05-8/2D3C), C15 (M 7908 RR x JAB.00-05-8/2D3C), C16 (M 8336 RR x JAB.00-05-8/2D3C), C17 (M 8230 RR x JAB.00-06-2/3I3D), C18 (M 8236 RR x JAB.00-06-2/3I3D) and C20 (M 8360 RR x JAB.00-02-3/6A4D).
The progenies of these crosses were conducted by the pedigree method until the F5 generation, where they were separated into two groups: the first containing the RR genotypes and the second, the conventional genotypes. The characterization and identification of RR genotypes was performed in the laboratory and they were detected by PCR (polymerase chain reaction) technique, which distinguishes soybean genotypes by the presence of molecular markers, derived from specific sequences of the transgenic DNA, which is amplified. The RR genotypes were identified by using specific primers that pair in the sequence Forward 5’TGATGTGATATCTCCACTGACG 3’ and Reverse 5’TGTATCCCTTGAGCCATGTTGT 3’, which codes the region EPSPS (Marcelino et al., 2007).
Thus, the present study evaluated F6 generation genotypes, in two separate experiments, after the process of selection of superior genotypes of each identified group. The first experiment was composed of 27 soybean genotypes carriers of RR gene and two checks (BMX Forca RR and BRS Valiosa RR). The second experiment was composed of 23 conventional genotypes and two conventional cultivars as checks (CD-216 and Conquista).
Genotypes were assessed as they reached the ideal phenological stages for their assessments. The following agronomic traits were evaluated: number of days to maturity (NDM), in days; plant height at flowering (PHF) in cm; plant height at maturity (PHM) in cm; insertion height of the first pod (HFP) in cm; lodging (Lg,), visual notes, where 1 indicates all upright plants and 5 all lodged plants; agronomic value (AV), visual notes, where 1 indicates plants with undesirable agronomic traits and 5 plants with optimal agronomic traits; one hundred seed weight (HSW), in grams; grain yield (GY), in kg ha-1 corrected to 13% moisture.
For data transformation when necessary, authors used the Box and Cox (1964) methodology. Data from each experiment (I and II) were submitted to analysis of variance using the GLM procedure of SAS ® 9.3 software (2011). Then, they were submitted to averages cluster analysis (Scott-Knott, at 5% level probability), phenotypic correlations, genotypic correlation and path analysis, using the computer software Genes (Cruz, 2013). Path analysis was obtained according to the method proposed by Wright (1921). The GY was chosen as the main variable, that is, the consequences of the correlations in direct and indirect effects of the other traits were estimated on the GY. Before the path analysis, a diagnosis of multicollinearity was performed (Montgomery and Peck, 1981), in order to identify potential problems in the analysis.
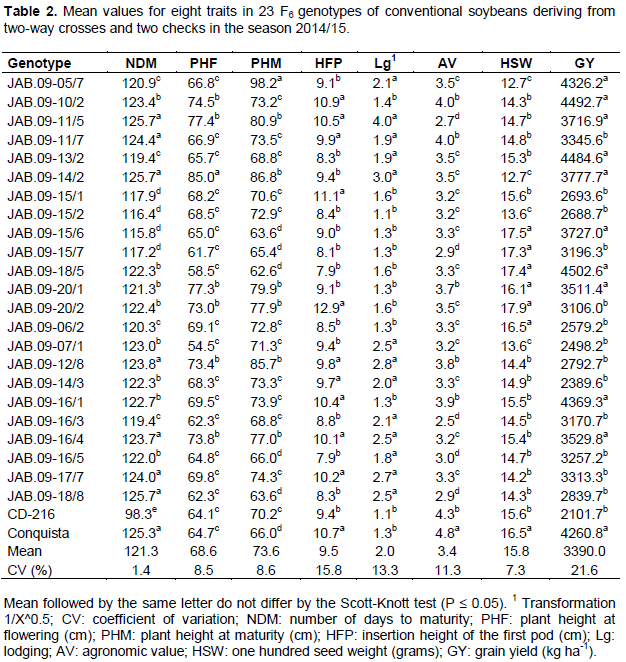
The analysis of variance enabled verifying significant differences by the F test at 1% probability, between RR genotypes for all traits. The coefficients of variation ranged from 2.6% (NDM) to 19.3% (GY) (Table 1), and were within suitable values. Conventional genotypes also showed significant differences at 1% probability for all traits, except for the GY trait (5% significance probability). The coefficients of variation ranged from 1.4% (NDM) to 21.6% (GY) (Table 2), also considered suitable, due to the nature of the traits. Among the analyzed traits, GY had the highest coefficient of variation. This can be explained by the fact of being a quantitative character controlled by many genes and that tends to be highly influenced by the environment (Costa et al., 2008).
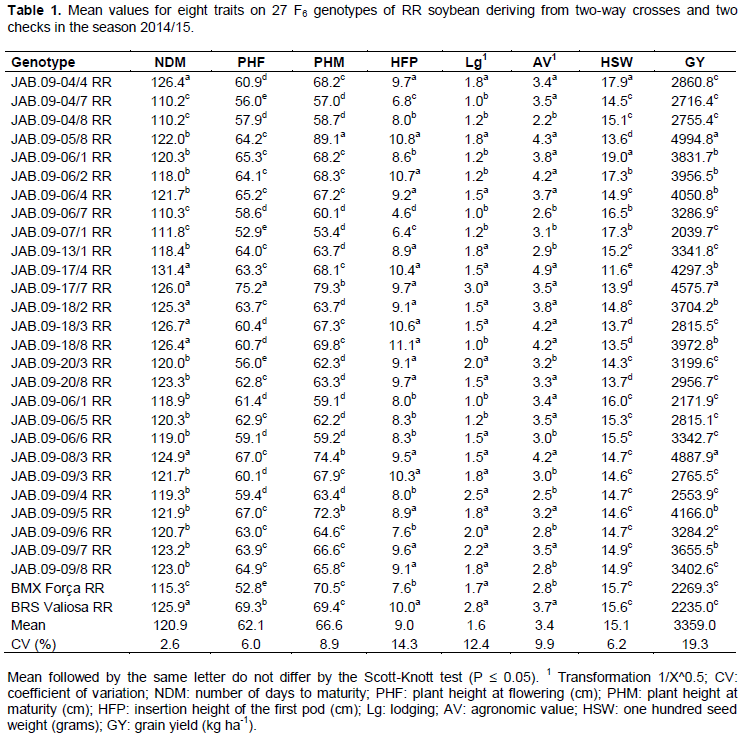

For the group of RR genotypes, as well as for conventional genotypes, results were significant by Scott-Knott test at 5% probability for all traits. For GY traits, there were average values from 2039.7 to 4994.8 kg ha-1 for the RR genotype (Table 1). Genotypes JAB.09-05/8, JAB.09-17/7 and JAB.09-08/3 stood out for GY, with average values over 4575.5 kg ha-1. In addition to these, statistically superior to the others, 14 other genotypes had higher GY than the national average of 2870 kg ha-1 (Conab, 2016). For conventional genotypes, the GY traitr showed average values between 2101.7 and 4502.6 kg ha-1 (Table 2). Ten genotypes, as well as the check Conquista, presented superiority to the trait, with average values over 3511.4 Kg ha-1. In general, the best RR genotypes showed GY superior to checks, while the best conventional genotypes were statistically equal to the check conquista.
Despite the conventional genotypes had presented higher number of statistically superior genotypes, from the overall average of the experiments (3359.0 kg ha-1 RR genotypes and 3390.0 kg ha-1 conventional genotypes), it can be seen that the presence of favorable alleles for the GY trait is more important to achieve high productivities than the presence or absence of the RR gene.
Lima et al. (2015), when comparing conventional soybean cultivars with essentially derived RR cultivars, observed no differences among them, because the conventional cultivar SOY M-6101, had 31.9% higher yield compared with the essentially derived M-SOY 7211 RR, whereas the essentially derived cultivar BRS Valuable RR had yield 28.5% higher than the conventional cultivar BRS/MG46 Conquista. Fonseca et al. (2013) concluded that for PHM, HFP and GY, the RR genotypes had higher values than the conventional genotypes, whereas Lima et al. (2008) did not identify difference for productive performance between conventional and RR soybean lines.
The best RR genotypes (Table 1) for the trait NDM were JAB.09-04/7 RR, JAB.09-04/8 RR, JAB.09-06/7 RR, JAB.09-07/1 RR and the cultivar BMX Forca RR, with cycle between 110.2 and 115.3 days, consequently, classified in maturity group from 5.4 and 5.9, respectively, according to Alliprandini et al. (2009), being characterized as early genotypes (Rocha et al., 2012). Despite these genotypes have presented the best values for NDM, they did not show satisfactory values for GY, and the best values for GY were presented by the late cycle genotypes. For conventional genotypes, the cycle ranged from 98.0 (CD-216) to 125.7 days (JAB.09-11/5, JAB.09-14/2 e JAB.09-18/8), being classified in maturity group from 4.2 and 6.9, respectively, according to Alliprandini et al. (2009), highlighting the JAB.09-15/6 genotype, which in addition to reduced NDM, presented satisfactory results for GY and the other traits.
In general, RR genotypes showed more precociousness when compared with conventional genotypes. The precocity is considered a desirable feature especially for cultivation in sugarcane renewal areas or to meet off-season areas in regions where the second crop is traditional. It is noteworthy that the NDM may vary according to the growing region because it is influenced by latitude, due to the sensitivity of soybean to the photoperiod (Rocha et al., 2012).
The RR genotypes with lower NDM also had the lowest values for PHF and PHM, whereas conventional genotypes with higher values for NDM also showed superiority for PHF and PHM. According to Dallastra et al. (2014), genotypes with reduced NDM (more precocious) may also have reduced PHF and PHM due to reduction in vegetative and reproductive stages of plant.
For the PHF trait, the JAB.09-17/7 genotype RR was higher than others (Table 1). Then, other 14 RR genotypes had intermediate values for PHF, ranging from 62.8 (JAB.09-20/8) to 67.0 cm (JAB.09-08/3 and JAB.09-09/5). For conventional genotypes (Table 2), JAB.09-14/2 was superior to all others for the PHF trait. Then, other six genotypes showed intermediate values for PHF, ranging from 73.0 (JAB.09-20/2) to 77.4 cm (JAB.09-11/5).
For PHM, values ranged from 53.4 (JAB.09-07/1 RR) to 89.1 cm (JAB.09-05/8 RR) for RR genotypes (Table 1). As for conventional genotypes (Table 2), values ranged from 63.6 (JAB.09-15/6 and JAB.09-18/8) to 98.2 cm (JAB.09-05/7). In general, RR genotypes with higher PHM had higher values of GY. According to Amorim et al. (2011), it must be considered a minimum PHM of 50 cm for soybean, whereas Carvalho et al. (2010) claim that plants with PHM higher than 100 cm tend to lodging and hinder the efficiency of harvesters at harvest. Thus, both the RR and the conventional genotypes had satisfactory values for PHF and PHM, being close or equal to the recommended value for the trait.
For the trait HFP, RR genotypes (Table 1) showed average values ranging from 4.6 (JAB.09-06/7 RR) to 11.1 cm (JAB.09-18/8 RR), while conventional genotypes (Table 2) showed HFP between 7.9 (JAB.09-18/5 and JAB.09-16/5) and 12.9 cm (JAB.09-20/2). Almeida et al. (2011) point out that the selection of plants with HFP less than 10 cm and PHM greater than 80 cm may cause losses in mechanical harvesting, whereas Rocha et al. (2012) state that the satisfactory HFP is around 15.0 cm, although most modern harvesters can make good harvest with plants showing first pods at 10.0 cm. Therefore, the RR genotypes with better values for GY also showed satisfactory values for HFP, whereas for conventional genotypes, the most productive showed high variation for this trait.
For the trait Lodging, 9 RR genotypes (Table 1) and 12 conventional genotypes (Table 2) showed the best values for the trait, with notes ranging from 1.0 to 1.2 and 1.1 to 1.6, respectively. Conventional genotypes showed higher values for lodging compared with the RR genotypes. This can be explained by the fact that conventional genotypes have shown higher PHM, because according to Carvalho et al. (2010), plants with high PHM values tend to lodging with ease. In the present study, this fact was confirmed, because genotypes with greater PHF and PHM values also showed high lodging, indicating relationship between these traits. The trait lodging should always be taken into consideration during the process of selection of superior genotypes, as plants with reduced lodging can minimize losses during the mechanical harvesting process.
Regarding trait AV, the best RR genotypes (Table 1) showed mean values ranging between 3.4 and 4.9, and the genotypes with higher GY were included in this range. However, conventional genotypes (Table 2) with higher GY did not necessarily present a high AV. Thus, the GY was not affected directly by the AV due to this being measured taking into account a set of visual traits of interest of the plant, such as: architecture, pod dehiscence, plant vigor and health, among others. It can also be seen that for both RR and for conventional genotypes, there was a positive relationship between AV, PHF, PHM and GY. Therefore, genotypes with these characteristics tend to have better performance, confirming the results obtained by Ferreira Junior et al. (2015).
For the trait HSW, RR genotypes (Table 1) showed mean values of 11.6 (JAB.09-17/4 RR) and 19.0 grams (JAB.09-06/1 RR), whereas the conventional genotypes (Table 2) had mean values of 12.7 (JAB.09-05/7 and JAB.09-14/2) and 17.9 g (JAB.09-20/2). RR genotypes with superiority for GY had lower average values for HSW. According to Dallastra et al. (2014), this may be due to the fact that more productive plants tend to produce smaller seeds due to the greater amount of seeds produced per plant.
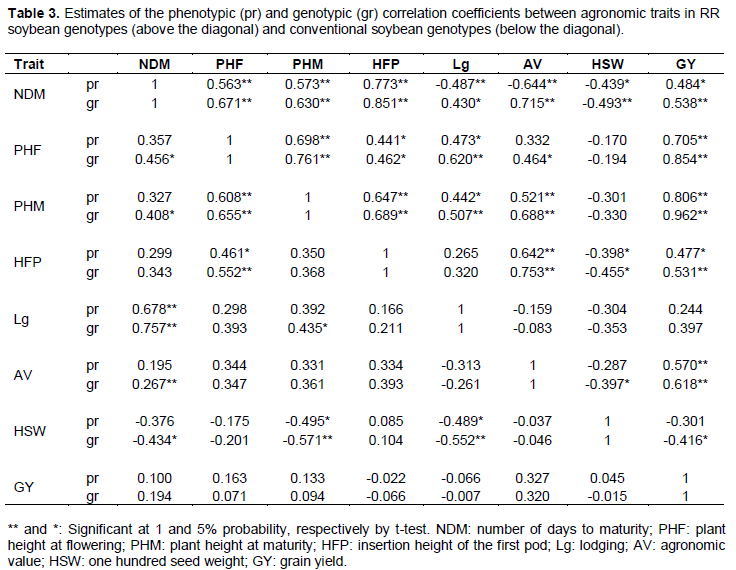
Estimates of phenotypic and genotypic correlation coefficients for the two groups of genotypes are shown in (Table 3). In the study of correlations, three aspects should be considered: the direction, the significance and the magnitude.
Positive correlations indicate the tendency of a variable increase when the other increases, negative correlations indicate a tendency of a variable increase while the other decreases (Nogueira et al., 2012). Positive correlations show possible occurrence of pleiotropism, in which the same gene affects the expression of more than one trait (Falconer, 1987).
In general, the genotypic correlations showed higher values than their corresponding phenotypic correlations. When genotypic correlations are higher than their corresponding phenotypic correlations, this indicates that the phenotype is hardly influenced by the environment, that is, the associations found mainly occur due to genetic causes (Almeida et al., 2010; Nogueira et al., 2012).
For the group of soybean RR genotypes, all agronomic traits, except HSW, were positively correlated with GY, both for phenotypic and for genotypic coefficient (Table 3). These results agree with those obtained by Akram et al. (2011) and Haghi et al. (2012), which found negative and no significant correlation between HSW and GY.
Positive, significant (p<0.01) and high magnitude genotypic correlations were observed between the trait GY and the traits NDM (0.538), PHF (0.854), PHM (0.962), HFP (0.531) and AV (0.618) (Table 3), indicating that the selection of plants in later cycle, combined with greater height at flowering and maturity, high first pod insertion and high agronomic value index will result in more productive plants, according to the results of Malik et al. (2007) and Akram et al. (2011).
Positive genotypic correlation was observed (p <0.01) between the trait NDM and the traits PHF (0.671), PHM (0.530), HFP (0.851) and AV (0.715) (Table 3). These results corroborate those obtained by Nogueira et al. (2012). However, they differ from the results obtained by Almeida et al. (2010).
Genotypic correlations were positive (p <0.01) between PHM and the traits PHF (0.761), HFP (0.689), Lg (0.507) and AV (0.688) (Table 3), revealing that the selection of tall plants simultaneously promotes the selection of plants with the other related traits with high values. Haghi et al. (2012) found, for the trait PHM, positive correlation with HFP (0.750), which can be attributed to a larger vegetative growth of plants.
For conventional genotypes there was no significant correlation in the phenotypic and genotypic coefficient between GY and all analyzed agronomic traits (Table 3). These results agree with those obtained by Ramteke et al. (2010) and Haghi et al. (2012), who observed for GY negative and non-significant correlation with the traits PHM, HFP and HSW. In this case, the selection should be applied directly to the GY, because no other trait is efficient to be adopted as criteria of indirect selection. For this group of genotypes, positive and high magnitude genotype correlation (p<0.01) were observed between PHF and PHM (0.655) and HFP (0.552).
Considering the two groups of soybean genotypes (RR and Conventional), the trait HSW correlated negatively with all other characteristics, except HFP for conventional genotypes (Table 3). Similar results were obtained by Ramteke et al. (2010). Diverging from the results obtained in this study, Almeida et al. (2010) observed a positive and significant correlation between the trait HSW (p<0.05) and the traits HFP, NDM and GY.
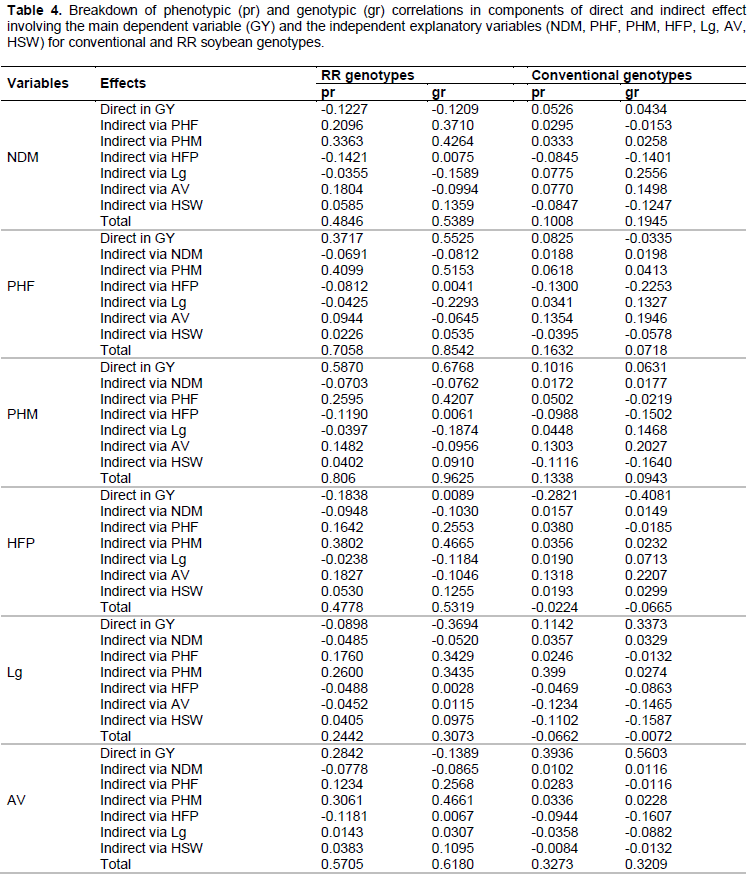
The information obtained from the correlation coefficients can be detailed through path analysis, which has proven useful in providing additional information that describes the relationships of cause and effect between the dependent variable (principal) and the independent variables (explanatories). For the path analysis, weak and moderate multicollinearity was observed, indicating that the ratio between the largest and smallest eigenvalues of matrix of correlations were near and below 100 and therefore do not affect the result of the analysis (Table 4).
In both genotype groups, the genotypic direct effects outweighed the phenotypic direct effects (Table 4), agreeing with the estimates of correlations (Table 3). Thus, the genotypic direct effects are intrinsically more useful than the phenotypic effects to decide selection strategies. Therefore, in this case, the genotypic correlations explain the true association between the traits analyzed and GY.
Among the RR genotypes, the traits that most influenced the GY were PHF, PHM and AV, as they showed the highest values of favorable genotypic direct effects (Table 4). Thus, the traits PHF and PHM can be considered as key traits in breeding soybean to increase the yield, as they exert great contribution to the determination of GY. According to Akram et al. (2011), Leite et al. (2016) and Malik et al. (2007), the PHM can be used as criteria of indirect selection for GY due to the fact that it was the most important trait to determine the GY. While Alcantara Neto et al. (2011) observed negative direct effect of PHM on GY.
The traits NDM, PHF, HFP and AV had the highest positive indirect effects via the PHM on the GY in the genotypic coefficient for the RR genotypes (Table 4). These indirect effects have high contribution in the correlations of these variables with GY because the direct effects were negative and/or lower than genotypic correlations, except for PHF, agreeing with the results obtained by Malik et al. (2007).
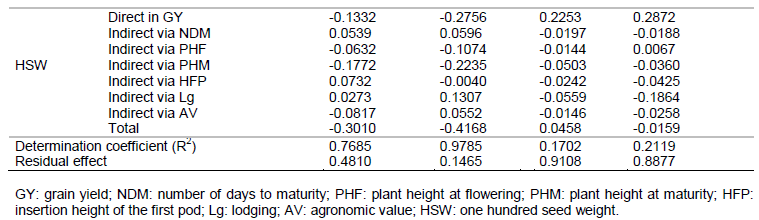
The direct and indirect genotypic effects of HSW on GY were negative and of low magnitude for the RR genotypes (Table 4), showing that it is a variable with little cause and effect relationship on GY. The trait Lg had a negative genotypic direct effect on GY, indicating a favorable condition, because the most productive genotypes showed no lodging problems. The positive genotypic correlation between Lg and GY was due to the indirect effects of Lg on GY via PHF and PHM.
In the group of conventional soybean genotypes, for the phenotypic and genotypic coefficient, all traits, except AV and HSW, had no relevant direct and indirect effects on GY (Table 4). Similar results were obtained by Haghi et al. (2012), who observed, for most traits, negative and low magnitude indirect and direct effects on GY. The trait AV had a greater influence on GY followed by HSW because these traits had a favorable positive direct effect on GY in the genotypic coefficient. As for the traits NDM, PHF, PHM, HFP and Lg, the direct and indirect effects on GY were of low magnitude.
As for the studied genotypes, there was influence on the magnitude of phenotypic and genotypic correlations between GY and most agronomic traits. The traits PHF and PHM had a favorable direct effect and can be used for indirect selection for GY in soybean.