Soybean (Glycine max (L.)) is one of the most cultivated crops in the world. In Brazil, the cultivated area is 32,092.9 ha, with a productivity of 2,998 kg ha-1 and 96,228 tons produced in 2014-2015 (CONAB, 2015). Among the Brazilian states, Piauí stands out for the growing expansion of soybean in the Cerrado area (Alcântara et al., 2012). The planted area, productivity and production are 673,700 ha, 2,722 kg ha-1 and 1,833.8 tons, respectively (CONAB, 2015). The Cerrado in the State of Piauí presents Central Brazil Tropical climate which is hot with average above 18°C every month, semi humid with 4 to 5 dry months (EMBRAPA, 2015). It is located in the MATOPIBA region (encompassing the States of Maranhão, Tocantins, Piauí and Bahia) and it stands out in the Brazilian scenario due to its flat topography, deep soils and favorable weather for the cultivation of major crops of grain and fiber (Borghi et al., 2014), which allowed agricultural expansion in this region.
Soybean yield depends on the sowing season, since plant development and production are related to the climatic elements and the different soybean maturity groups (Chen and Wiatrak, 2010; Kapoor et al., 2010). In this sense, it is necessary to determine the best time for planting, so that climatic conditions are favorable for the development of soybean and for a higher production of grains (Alcântara et al., 2012). In the Piauí Cerrado, sowing is traditionally between November 15 and December 15 (Cruz et al., 2010a). Therefore, the objective of this study was to evaluate the effect of sowing time on the yield components of soybean cultivars of different maturity groups produced in Serra do Pirajá, Cerrado microclimate. Since soybean is a crop that depends intrinsically on climatic conditions, sowing time plays a key role in its development and final productivity.
Location of the experiment and soil analysis
The experiment was conducted in the crop year 2014-2015 at São João Farm, in Currais, State of Piauí (9° 1’ 59’’ S, 44° 41’ 18’’ W, and 590 m). Climatic data regarding air temperature, relative humidity (%) and rainfall (mm) were collected daily at the farm’s Portable Automatic Weather Station during the study period. The estimated average values that each cultivar received of these elements in different sowing dates, both in the vegetative and reproductive stage, were calculated with Excel® 2010. The chemical properties of the soil were analyzed and fertilization was done according to soil analysis. The concentrations obtained were OM = 12.6 g dm-3; pH CaCl2 = 4.3, P = 8.4 ppm, S = 9.4 ppm, K = 1.2 mmolc dm-3, Ca = 9.7 mmolc dm-3, Mg = 2.3 mmolc dm-3, Al = 3.0 mmolc dm-3, H + Al = 35.4 mmolc dm-3, SB = 13.2, CEC = 48.6 mmolc dm-3, V = 27.1%, m = 6.2%, Cu = 1.6 ppm, Fe = 210.1 ppm, Mn = 2.5 ppm, Zn = 0.4 ppm, total sand = 630 g kg-1, silt = 60 g kg-1 and clay= 310 g kg-1.\
Adopted statistic
The experiment was a split plot randomized complete block with four replications. Each plot consisted of 25 m rows 0.5 m apart, and the subplots were 10 rows per cultivar. Seeds were inoculated and treated as follows: 4 doses of inoculant 5 × 10⁹ CFU mL ha-1 + 140 mL ha-1 Standak Top®.
Sowing season and soybean cultivars
Sowing was done weekly from the onset of rainfall and there were six seasons (S): 11/22, 11/29, 12/06, 12/13, 12/20 and 12/27/2014.
The soybean cultivars studied were C1, with a cycle of 110 to 115 days and maturity group 8.6; and C2 with a 100 days cycle and maturity group 8.2. The sowing was manual, 25 seeds m-1 and excess seedlings which were later thinned to 14 plants m-1 for C1 and 16 plants m-1 for C2, with a resultant final population of 300,000 and 330,000 plants ha-1, respectively. The harvest was done manually when the plants reached the phenological stage R9. Pods were collected, stored in plastic bags and taken to the Laboratory of Plant Science of the Piauí Federal University (UFPI), where threshing was done.
Rated characters
Yield components were the following variables: pod length (PL); number of grains per pod (NGPO); number of grains per plant (NGPL); number of pods per plant (NPP); stem dry mass (SDM) and pod dry mass (PDM); mass of one thousand grains (MTG) and productivity (PROD) (Brasil, 2009; Alcântara et al., 2012; Souza et al., 2013). After obtaining data, the Shapiro Wilk test was performed, and next, the analysis of variance was run using the R statistical software. Data corresponding to pod numbers were transformed using the 1/x formula. Next, the significant interaction between season and cultivars was checked at p ≤ 0.05, afterward, a statistical breakdown of treatments was performed and whenever significant, the comparison between mean values was made by Tukey’s test at 5% probability.
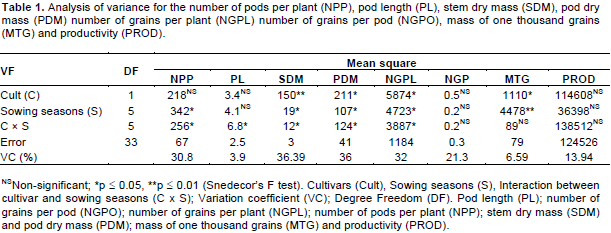
The results of the analysis of variance evidenced significant interaction cultivar (C) × sowing season (S) for number of pods per plant, pod length, stem dry mass, pod dry mass and number of grains per plant (Table 1), indicating that climatic elements and maturity group interfered with the development of plants (Chen and Wiatrak, 2010).
The combined effect of C × S was compared to the recommendations of the cultivar with higher average performance of NPP, PL, SDM, PDM and NGPL and the best sowing season, represented by E3 (Table 2).
Unfolding of the interaction C × S
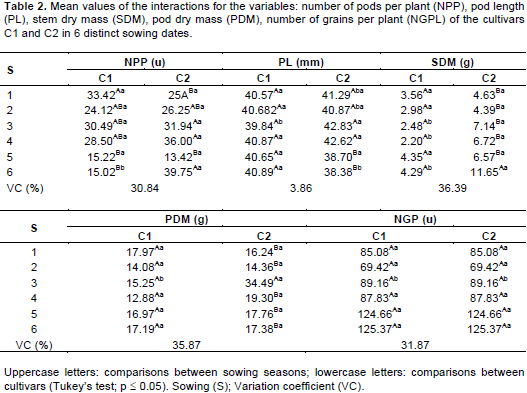
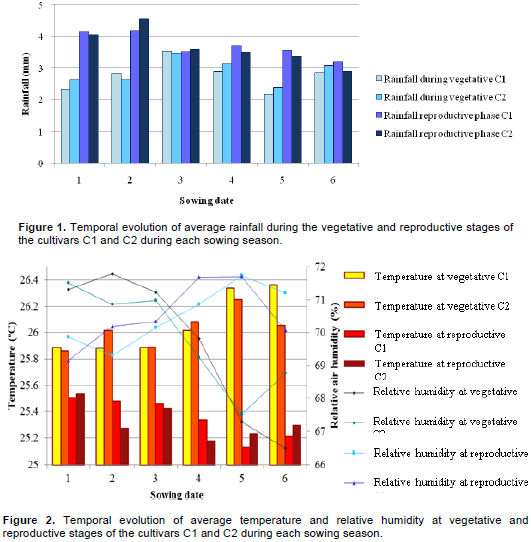
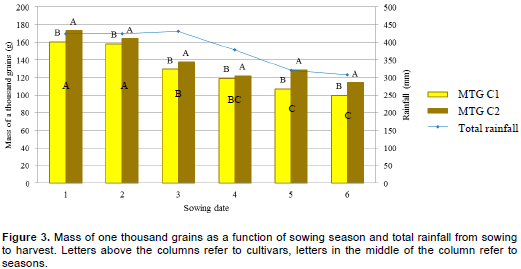
The highest mean number of pods per plant was found in sowing time 1 with C1, while for C2 the highest values were observed in sowing times 3, 4 and 6 (Table 2). This was probably because rainfall was better distributed during the vegetative stage in sowing times 3, 4 and 6 (Figure 1). Regarding S1 with C1, these discrepant results could be explained with respect to the cultivar’s maturity group because even though it was subjected to water stress, it may have been favored by the rainy season at the defining moments of this variable. Thus, rainfall may have promoted the high number of pods for plants at this date, since the high availability of water increase yield components. Likewise, stress conditions will cause a negative influence on the biological yield of soybeans, by damaging the final production of the plants (Siahbidi et al., 2013). The other climatic elements did not affect the studied variables, since temperatures in the range 20 to 30°C and adequate humidity are critical to the growth and development of soybean (Alcântara et al., 2012; Taiz and Zeiger, 2013; Battisti and Sentelhas, 2014) (Figures 1 and 2).

Sowing season 6 was a conflicting point, which generated good results in C2 (Table 2). It occurred due to the adequate rainfall during the vegetative stage, causing higher NPP. Although rainfall was less significant than in other dates, there is a possibility that C2 took greater advantages because its maturity group is greater than C1, enabling it to make better use of the water. The difference in duration of the phenological stages between cultivars (maturity group) is a major factor in determining yield components, suffering direct influence on genetic and environmental factors (Chen and Wiatrak, 2010).
In pod length, sowing dates 3 and 4 brought higher averages for C2, matching with NPP, while sowing seasons 5 and 6 had lower PL values. However, sowing season did not have effect on C1 (Table 2). These differences probably occurred due to sowing date to have greater influence on the results than the maturity group (Cruz et al., 2011a). Stem dry matter in S6 had a higher average for C2 (Table 2) than other sowing dates. The plants of that date were larger than the result of well-distributed rainfall during the growth period (Figure 1). This fact is justified because water participates in the physiological processes of the plant, such as cell expansion, favoring stem growth and increasing the dry mass of the plant. Thus, sowing time and maturation cycle affect crop development (Cruz et al., 2010b; Taiz and Zeiger, 2013).
For pod dry mass, S3 had higher values for C2 while other seasons had lower values, the same was observed for C1 (Table 2). This is explained by the balance in water availability, both at vegetative and reproductive stages (Figure 1) since the accumulation of PDM occurs until the beginning of the R6 stage, and thereafter remains unchanged. If the availability of water for the plant is adequate throughout the cycle, the plant will have higher dry mass. Thus, small temporal differences of sowing time and maturity group contributed to this variation on average (Kurihara et al., 2013). For the number of grains per plant, the highest averages were observed in sowing seasons 3, 4 and 6 in C2 (Table 2), similar results for number of pods, because if the plant has a high NPP, it will probably also have a greater NGPL. This can be explained because the yield components (NPP, NGPL) are positive and related with the overall productivity, and reducing these components will cause reduction in grain yield (Kobraei et al., 2011). Concerning the cultivars, there were significant differences in NPP for S6, where C2 presented higher mean value than C1 (Table 2). Conflicting results were observed in PL, which produced the highest mean for C2 and the lowest for C1 at the same sowing date. However, the results in S3 were the opposite. For SDM, C2 also achieved higher yield than C1, in sowing seasons 3, 4, and 6. C2 also had higher values than C1 in PDM and NGPL at S3. Although both cultivars are early-maturing varieties, the difference of a few days in the sowing date caused different results in yield components. This may have occurred because of different effects of climatic elements on each maturity group (Figures 1 and 2). This difference of days between the two cultivars favored more the maturity group 8.6 than the 8.2, because of rainfall and temperature, since soybean production is largely dependent on these elements (Kirnak et al., 2008; Bellaloui et al., 2011; Khan et al., 2011).
In general, S3 had higher mean values for most variables evaluated for both cultivars studied. As for the cultivars, C2 was statistically superior to C1 in every variable analyzed. However, differences between both seasons and cultivars were found, which supports the hypothesis of the influence of sowing date, due to changes in climatic elements and the length of the crop cycle (Chen and Wiatrak, 2010; Hu and Wiatrak, 2012). Furthermore, climatic elements and the cycle of each cultivar are related to physiological processes of the plants. In this experiment, water was a limiting factor in the production of photosynthates and their translocation in the phloem, restricting better results in yield components (Taiz and Zeiger, 2013).
Source of variation of the mass of one thousand grains (MTG) and productivity (PROD) for the factors cultivars (C) and sowing seasons (S)
The mass of one thousand grains showed no significant interaction between sowing date and cultivars; however, there was statistical difference for the factors separately (Table 1). Hence, ages 1 and 2 had the highest mean value for the mass of a thousand grains, while the lowest MTG values were obtained in sowing seasons 5 and 6 (Figure 3). Regarding cultivars, C2 had a higher mean value in agreement with the other results (NPP, PL, SDM, PDM and NGPL) (Table 2).

The amount of rainfall decreased in the later sowing dates (Figure 1), meaning that the amount of water available in dates 3, 4, 5 and 6 was much lower than that in the first two sowing seasons. The resulting decrease in MTG probably occurred because the plants need greater water accumulation in stages R1 to R7, and yield components are highly affected by periods of water stress, as they are the key elements to raise productivity in the field (Alcântara et al., 2012; Siahbidi et al., 2013). For productivity, there was no difference between sowing dates and cultivars (Figure 4), meaning that all sowing dates and cultivars produce good results in productivity, that is, sowing may be done from late November to late December, based on the data of the 2014-2015 crop year for these cultivars.
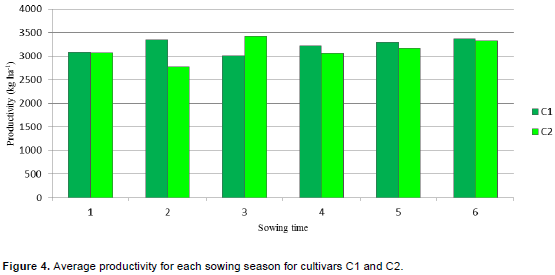
Although sowing seasons 1 and 2 exhibited significantly different mean values for the mass of one thousand grains, the productivity was not different, that is, the results were similar between sowing dates 3, 4, 5 and 6, even with lower MTG values. The greater productivity of sowing dates 3, 4, 5 and 6 is the result of a greater number of grains per plant, despite the lower MTG value. Interaction effects were verified for the variables NPP, PL, SDM, PDM and NGPL, but not for MTG and PROD (Table 1). This was probably due to the uneven rainfall during the crop cycle in sowing dates, as seen in Figure 1, with a greater accumulation of rainfall in the first three weeks from R1. However, the later sowing seasons benefited from rainfall in the vegetative stage, favoring an increase in dry matter production and contributing with productivity. If the rainfall events had continued well distributed until the end of March, an interaction between MTG and PROD in seasons 3, 4, 5 and 6 could have occurred, because this is the period where weather conditions are best for soybean plants and their development favors a high grain yield (Meotti et al., 2012). Nonetheless, to verify this, further experiments are required to evaluate the results with irrigation if the rains ceased before grain filling.