Plant growth is one of the most sensitive physiological processes to water deficiency. The objective of this study was to evaluate different levels of water replacement combined in two periods of the bean cycle, cv. IAC Alvorada, with respect to the biometric parameters. The study was carried out for two years (2010 and 2011) in a Red Latosol, distroferric, of clay texture, in Botucatu, SP. The experimental design was a randomized block in factorial 4×4, with four replications. The treatments consisted of four water replacement levels of 40, 60, 80 and 100% of ETc, applied in two phases in crop cycle, with phase I - beginning after emergence to flowering, and phase II from flowering to physiological grain maturity. The treatment with 100% ETc consisted of increasing the soil water content at field capacity, with a deficit in percentage for the other treatments. The variables evaluated were: Leaf area index, number of nodes, and plant height. Reducing the water applied in the vegetative or reproductive phases significantly affected leaf area index and plant height. Plant height was the most sensitive component to water deficit. It was concluded that different combinations of irrigation regimes provided different responses in the development parameters of common bean.
Brazil is the largest producer and consumer of common bean Phaseolus vulgaris L., and the main producers belong to the states of Paraná, Minas Gerais, Mato Grosso, Sao Paulo, Goiás and Bahia, which account for more than 67% of national production. Conab (2014) show that 2.832 million tons year-1 were produced in the 2012/2013 harvest in a cultivated area of 3.111 million hectares, which implies an average productivity of 910 kg ha-1, considered low. However, productivity up to 3 t ha-1 can be achieved at irrigated crops and high technological levels (Lopes, 2011). Of the total of 3111.0 ha planted in the 2012/2013 harvest, 558.3 ha were irrigated, accounting for 28.8% of production (Conab, 2014).
Winter cultivation enables five times higher yields than conventional seasons. Silveira et al. (2001) reported that spray-irrigated beans are economically viable, with rates of return higher than 70%. Water deficit reduces the size of leaves and branches (Taiz and Zieger, 2009). In the vegetative phase (from V2 to V4), it reduces the size and plant development with indirect effect on grain yield. Water stress from pre-flowering to flowering shortens ripening period and prolongs the bean cycle (Oliveira and Kluthcouski, 2009). At flowering, it may reduce plant height and the number of seeds per pod (Silva and Ribeiro, 2009). During the pod formation (R7), water deficit causes ovules abortion, producing empty pods, and in the pod filling stage (R8), it causes abortion of young pods and production of empty pods.
The withholding irrigation on grain filling phases reduces grain yield, and the number of grains per pod (Miorini et al., 2011). At physiological maturity (R9), it reduces the grain mass (Oliveira and Kluthcouski, 2009). The reproductive phase is the phase of higher water demand and the most sensitive to water deficit.
Guimarães et al. (2011) found yields of 863 and 2084 kg ha-1 for growing conditions with and without water deficit, respectively, for two years, with a 58.6% yield reduction due to water deficit. For proper irrigation management, two intrinsic aspects should be considered. The first is the natural conditions of water supplier due to the high cost of capture and distribution. The second is based on crop response to the water applied. In addition to compromising the production costs, excessive irrigation is also harmful because it reduces crop yield. On the other hand, insufficient irrigation exposes the crop to water stress conditions, reducing its productive potential.
Bean irrigation allows significant productivity gains, while high water deficit or excess water due to rainfall at harvest time causes losses (Aguiar et al., 2008).
This study aimed to evaluate different levels of water replacement combined in two periods of bean cv. IAC Alvorada cycle, in winter cultivation, in the first and second year of direct seeding.
The experiment was carried out in two consecutive years (2010 and 2011), in direct seeding system during winter (April-September), in an experimental area of Lageado Farm, Botucatu, center west region of São Paulo (22º51 'south latitude, 48º26' west longitude) and altitude of 786 m.
According to Cepagri (2010), the climate is classified as Cwa by Koeppen classification, characterized as warm temperate mesothermal, with rains in summer and dry in winter.
The soil of the area is classified as Red Latosol (LVdf), distroferric, and of clay texture (Embrapa, 2006). The chemical and physical characteristics were evaluated for four months prior to the beginning of the experiment in the field, obtaining twenty-four trenches. Soil samples were collected in layers from 0 to 10, and 10 to 20 cm deep.
The chemical analyses of soil were performed as described by Raji et al. (2001), and the physical analyses were carried out according to Embrapa (2009). The area was fallow, on braquiaria residue, and corn planting was carried out before the experiment in order to raise the straw content and organic matter of the soil.
The chemical characteristics of the soil at 0-0 to 0.2 m depth prior to the experiment were: pH 4.7 in CaCl2; 21.0 g/dm3 organic matter; 4.7 mg/dm3 Presin; 1.7; 13; 7; 30; and 1 mmolc/dm3 K, Ca, Mg, H + Al, and Al, respectively, and 41.5% base saturation (V%), 0.16; 11.55; 38.5; 13.85; 1.15 mg/dm3 B, Cu, Fe, Mn and Zinc, respectively. In the second year prior to the experiments, the same layer of 0-0 to 0.2 m exhibited pH 4.85 in CaCl2; 24.0 g/dm3 organic matter; 24 mg/dm3 Presin; 1.9; 29; 14; 40 and 1 mmolc/dm3 K, Ca, Mg, H + Al, and Al, respectively, and 51% base saturation (V%); 0.28; 11.9; 43.5; 16.5; 1.2 mg/dm3 B, Cu, Fe, Mn and Zinc, respectively. The soil presented clay texture, according to the particle size analysis (423.1, 444.7, and 132.1 g kg-1 sand, silt and clay, respectively).
In the first and the second growing seasons, the bulk density varied from 1.35 to 1.38 g cm-3 and 1.39 to 1.41 g cm-3 for the layers of 0 to 15 cm and 15 to 30 cm depth, respectively. Liming was performed before sowing in order to raise the base saturation (V%) to 70%, adequate to the bean crop. Lime was manually distributed on the soil surface.
Direct sowing of cv. IAC Alvorada was held on 04/09/2010 and 05/10/2011, respectively, with 0.45 cm spacing between lines, and 13 seeds per meter to obtain a final density of 200000 to 240000 plants ha-1. A seeder exact model air JM 2980 PD Jumil was used, following the ground contour.
Fertilization was based on the soil chemical composition, in which 321 and 145 kg ha-1 of fertilizer was added at concentrations of 8-28-16 + zinc, and 70 kg of N applied in coverage and divided into two applications, for an expected productivity from 2.5 to 3.5 t. Cultural and phytosanitary treatments were performed according to the recommended for bean crop, when necessary.
The experimental design was a randomized complete block design with four replications in a factorial 4 × 4. The factors used were 4 levels of water replacement, 100, 80, 60 and 40% of crop evapotranspiration (ETc) applied in two phases during the cycle (vegetative - I, reproductive -II). Similar levels were applied in both phase I and phase II.
The treatments consisted of water replacement combinations in two application times. Each plot had 7.2 m2, and 4 m x 1.8 m, consisting of four bean lines, with three lateral irrigation lines each. Spacing between blocks was 2 m, and 1.5 m between plots. To evaluate the experiment, external lines in each plot were considered as surround, plus one meter by adding the two ends of each plot.
The differentiation between treatments and the drip irrigation began the ninth day after sowing. Previously different irrigation treatments were carried out, using the irrigation sprinkler system.
The side lines, composed of dripper hose with wall thickness of 625 µm, and 20 cm spaced emitters, with a flow rate of 7.5 L/h/m at a pressure of 100 kPa, were distributed at a spacing of 0.45 m between the bean lines, forming a continuous wet track in the floor area.
Soil water storage capacity was 18.9 mm for an effective soil depth of 30 cm. Under the experimental conditions, a period of 1.15 h was required to reach the irrigation field capacity, with 90% efficiency and effective depth of bean roots of 0.3 m, for the treatment with 100% ETc in both stages studied.
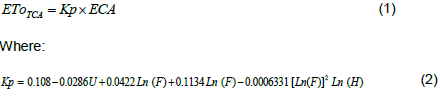
Water management was based on the reference evapotranspiration (ETo) from the evaporation of a Class A tank, located at 150 m away from the experimental site. Data were collected daily and corrected by the correction coefficient (Kp) as reported by Allen et al. (1998), Equations 1 and 2.

F = Distance from the border area (10 m); U -= wind speed at 2 m height (km d-1); RH = daily relative humidity (%) Kc values were 0.4, 1.15 and 0.35 for initial, middle and end, respectively, with a maximum crop height of 0.4 m, according to Allen et al. (1998).
The treatment T16 was kept as reference without water restriction, both in the initial phase (phase - I) as the final phase (phase - II). For the other treatments, water restriction was performed in one of the phases (I and II) after germination. Phase I began in the V2 stage (22 DAE) to flowering (40 DAE), with an average period of 18 days. Phase II began in flowering to physiological grain maturity (40-60 DAE), with an average period of 20 days.
In the field, irrigation was controlled as a function of time by the flow emitters of each plot (ratio between the discharge portion and plot area). Irrigation was performed daily, and a register for each treatment was installed, and a timer measured the daily irrigation time for the reference plot (100%). Then, the time corresponding to the 80 60 and 40% ETc relative to the phases I and II was determined.
At flowering, three plants were sampled at random from the working area of each plot, in order to estimate the effect of water deficit on plant height characteristics (AP), number of nodes on the main stem (NN), and leaf area index (LAI).
Subsequently, the (NN) in the main stem was estimated, after the removal of plants in the field. Leaf area (cm2) was estimated by weighing method (Benincasa, 2003).
The results were subjected to analysis of variance by the F test, and the means of treatments were compared by Tukey test (p ≤ 0.05).
The minimum and maximum air temperature during the phenological cycle of the bean for the years 2010 and 2011 are shown in Figure 1. In the first cycle, in 2010, the minimum temperature was not less than 15°C in both phases I and II. In general, the values are within the range recommended by Silva and Ribeiro (2009), for the bean crop, who found ideal values of minimum, mean and maximum air temperature of 12, 21 and 29°C, respectively. In the second cycle, in 2011, mean values of minimum temperatures below 15°C were observed. In the vegetative phase, the crop was for about 20 days with minimum temperature close to 11°C. These temperature variations occurred during flowering and grain filling phases, interfering with the crop cycle.
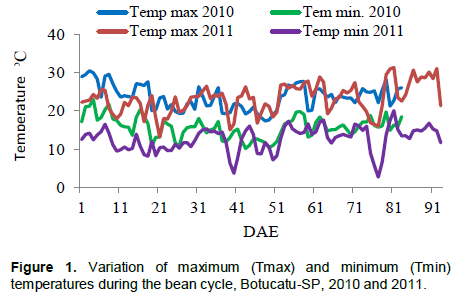
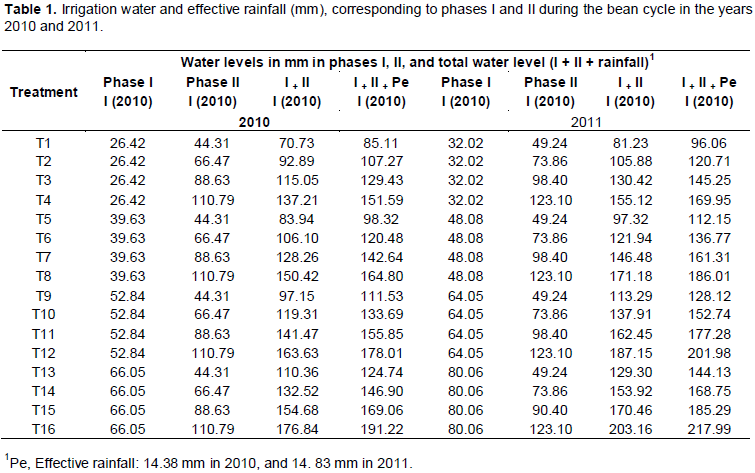
Table 1 show the water applied per treatment for the first and second years (2010 and 2011). For the treatment 16, with 100% ETc, the total water applied was 191.22 mm in 2010 and 218 mm in phases I and II, in 2011. It has been found that water applied in Phase I and II was higher in the agricultural year of 2011 when compared to 2010. The effective rainfall during Phases I and II corresponded to 5.26 and 9.12 mm for the year 2010, totaling 14.38 mm. In 2011, in the second experiment, in Phases I and II, the effective rainfall was 5.19 and 9.64 mm, respectively, totaling 14.83 mm. Rainfall in the first experiment took place during the vegetative and late flowering phase. In contrast, in the second experiment, the rainfall concentrated mainly in the vegetative phase, on the third trifoliate, and at the end of the grain filling in the reproductive stage.
In the first year, the bean harvest occurred in July, while the one corresponding to the second year occurred in September. The cumulative number of day-degrees for each treatment is shown in Table 2 for the first and second years (2010 and 2011), respectively.
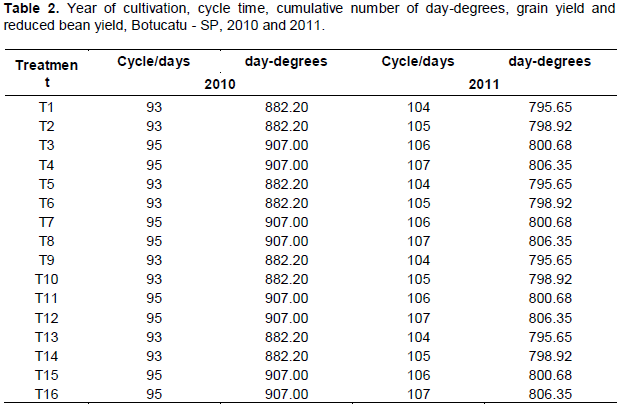
In the experiment in 2010, the cycle lasted 93 days for the treatments subjected to water replacement of 40 and 60% of ETc in Phase II, regardless of Phase I. In the Experiment 2, there was an increase in the number of days, ranging from 104 to 107 days, due to the low air temperature and accumulation of day-degrees during the bean development in the year 2011.
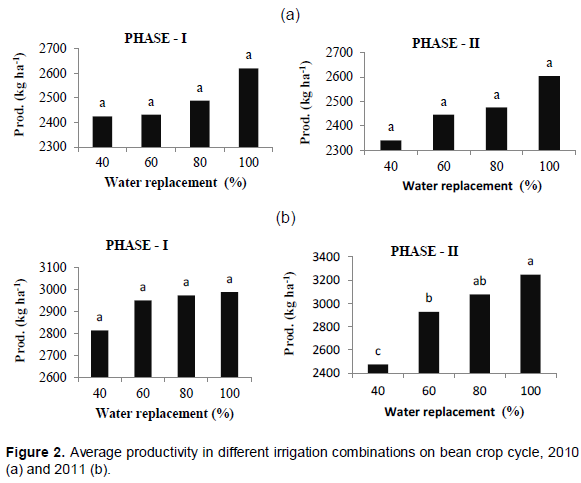
In the second experiment, the combinations of water deficit in Phases I and II reflected in seed yield, which was not observed in the first experiment. In general, it was found that lower water levels in Phase II, combined with Phase I, reflected in lower seed yield when compared to the treatment without water restriction in all phases (Figure 2). Cunha et al. (2015) verified an average production of dry beans was 1339.15 kg ha-1, with a water consumption of 215 L for plant.
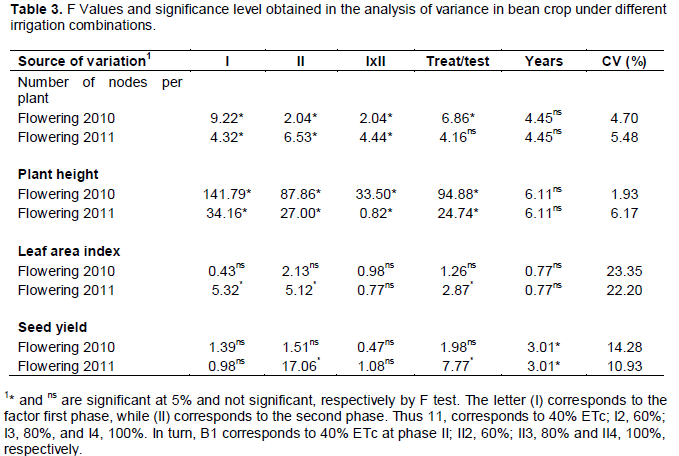
Table 3 summarizes the analysis of variance for the number of nodes, plant height, leaf area index, and yield for the first and second experiments. The interaction treatments x irrigation 40, 60, 80 and 100% of ETc presented significance for the number of nodes and plant height in the first and second years, but it was not significant for leaf area index and yield, where the collection was carried out during flowering.
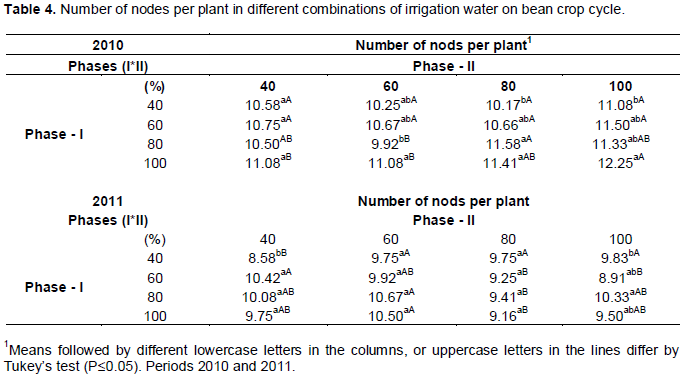
The results indicated that the water deficit observed during Phases I and II decreased the number of nodes per plant (N) (Table 4), compared to the treatment without water restriction in all phases of the bean cycle.
In the first cycle, the lowest NN values were obtained with the largest reductions in water applied in Phases I and II, which was also observed in the second year. These values are similar to those obtained by Moraes et al. (2010) in a study conducted in a greenhouse in Alegre, ES, with and without water deficit applied in the pre-flowering stages and formation of floral buds, with NN values of 12.85 and 14.84, respectively. Aguiar et al. (2008) in a study with and without water stress, found a small reduction of NN per plant, ranging from 1.8 to 5.3%, except for the lineage LP 99-79.
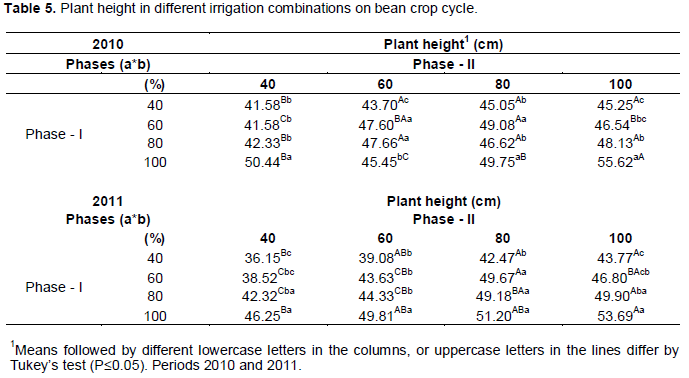
The results presented in Table 5 indicated that water deficit during Phases I and II led to a reduction in plant height. The water reduction in Phases I and II resulted in the lowest plant height when compared to the treatment without water restriction in all phases. Moraes et al. (2010) investigated water deficit interrupted for 15 days during both the pre-flowering and formation of flower buds phases, and did not find differences on plant height under water deficit or not, obtaining values of 100.71 and 105.08 cm respectively, in a study conducted in the greenhouse. Aguiar et al. (2008) in a study performed with and without water stress found that the common bean genotypes of the carioca group showed an increase in plant height under water stress conditions. This result may be a result of shading the plants when subjected to these conditions.

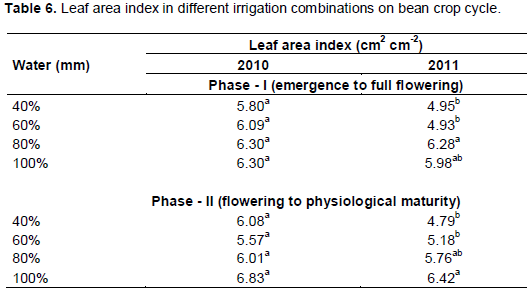
The leaf area index (LAI) of IAC Alvorada subjected to water deficit in Phases I and II, in the first and second experiments, was influenced by the water applied, resulting in lower means when compared to the treatment without water deficit (Table 6). Aguiar et al. (2008) studied common beans, and found significant lower leaf area index for the carioca group when the genotypes were subjected to water stress. Sousa and Lima (2010) evaluated the effect of water deficit in the LAI characteristic of common bean, and found values of 0.88, 0.72, 0.35, 0.32 and 0.69 m2m-2 with deficit irrigation in vegetative phases, pre-flowering full flowering, grain filling and ripening, respectively.
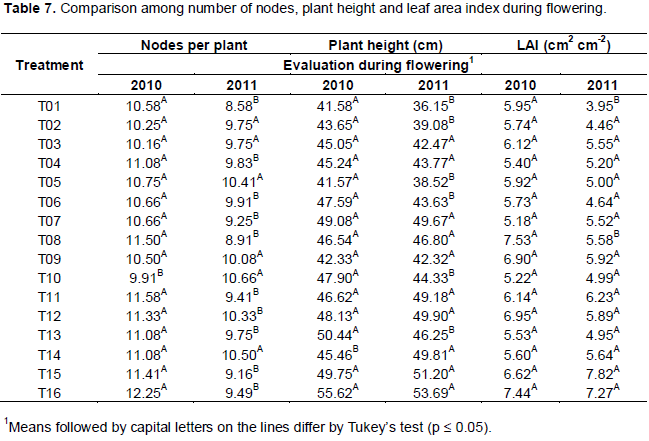
The NN of the plants from the first and second years was significant for the treatments T1, T4, T6, T7, T8, T11, T12, T13, T15 and T16 (Table 7), and the averages of NN in the first year were higher when compared to the second year, except for the T10.
The average plant height between the first and second cycles was significant for the treatments T1, T2, T5, T6, T10, T13, T14, T0, which was higher in the first year when compared to the second year, except for the T14, probably due to higher rainfall, reducing water scarcity. A significant difference only between T1 and T8 (Table 7) was observed between the LAI of the first and second experiments. Jauer et al. (2003) observed that the leaf area index reached the maximum closed to the beginning of grain filling period.
The characteristics, number of nodes per plant, plant height, leaf area index, and seed yield were sensitive to water stress. The largest water reductions of the bean cycle in Phase I (early after emergence to flowering) combined with Phase II (from full flowering to physiological maturity) resulted in greater effects on plant height and leaf area index. The higher the water deficit in the reproductive phase (Phase II beginning of full flowering to physiological grain maturity), the smaller the grain yield in kg ha-1 is.