Crude oil pollution damage the fertility of [R1] soil and vegetation, destroy wild life and breeding ground for marine fishes, because of the toxicity of oil
[R2] , thereby making farming, fishing and hunting difficult for the inhabitants of the area (Onwuka, 2005; Chikere et al., 2009). Therefore, crude oil pollution in the Niger Delta region causes severe socio-economic and environmental impacts. The impacts of the crude oil pollution occur at the local, national, regional and global levels (Platform, 2012). At all levels it is the poor that bear the heaviest burden. UNEP (2011) report
[R3] on Ogoni land showed that crude oil pollution from 50 years of oil operations in the Niger Delta region of Nigeria has penetrated further and deeper than many may have supposed.
In some areas, which appear unaffected at the surface, were in reality severely contaminated underground. Where entrepreneurs have established fish farms in the region, their businesses had been ruined by an “ever-present” layer of floating oil. Crude oil pollution therefore, impoverishes the inhabitants of the Niger Delta region of Nigeria (UNEP Report, 2011; Platform, 2012). The Niger Delta region includes the following nine states of the Federal Republic of Nigeria: Abia, Akwa Ibom, Bayelsa, Cross River, Delta, Edo, Imo, Ondo, and Rivers State.
Problem of the study
Osuji and Nwoye (2007) observed that the impact of petroleum hydrocarbon on soil fertility included low soil fertility, which in turn implied low agricultural productivity and reduced source of livelihood in the affected area. Oil spills have become a major environmental hazard
constituting[U4] serious socio-economic problems in Nigeria, especially in the oil producing communities (Atakpo and Ayolabi, 2009).
Idemudia (2008) assessed the issue of community development partnership and poverty reduction in the Niger Delta by oil transnational corporations. The paper found out that the community development partnership with the multinational oil companies had very limited positive impacts on poverty reduction in the region. Orogun (2009) in a case study illustrated and explicated the paradox of plenty, the resource course, the shadow state syndrome, and the debilitating effects of petroleum politics, in Nigeria. Economic exploitation of the region’s vast crude oil reserves by multinationals and governments and government authorities is juxtaposed, with the specter of environmental devastation excruciating poverty, and the recurrent rule of impunity.
Therefore, the problem of this study is to measure and compare poverty levels among crop farmers in crude oil polluted and non-polluted areas in Rivers State, Nigeria using socio-economic variables. The socio-economic variables considered in this study include years of farming experience, other working members of the household and membership of co-operative society. These variables were used to estimate and compare poverty levels using Foster et al. (1984) poverty measures of headcount, poverty gap and severity respectively in decomposable forms.
Significance of the study
Previous studies [U5] in the use of social and economic variables to describe the effects of crude oil pollution on the populace in Niger Delta
abounds [U6] (Eweje, 2006; Edino et al., 2010; Efe, 2010). Literature
exist[U7] in the use of socio-economic variables in determining the poverty levels among crop farmers (Thorp et al., 2005; Nasution, 2008).
Eweje (2006) examined issues of environmental costs and responsibilities resulting from oil exploitation and production in the Niger Delta region of Nigeria. The article further examined the implication of the current practices and policies of the multinational oil companies with respect to environmental impact of oil exploitation. The study’s findings illustrated that it is apparent to oil companies that pollution prevention pays while pollution does not.
Edino et al. (2010) observed that many studies had established relationships between gas flaring and poor agricultural yields. Their study found that the residents perceived gas flaring as hazardous to health, environment and general well-being of the community. Most residents seem to be resigned to the continued presence of gas flaring activities in the community.
Thorp et al. (2005)
reported [U8] that group formation has great potential to empower and raise the incomes of poor people.
According to the study, [U9] chronically poor are disadvantaged in group formation and this may form a significant part of vicious circle and dynamics of chronic poverty. Successful groups formed among the poor
according to the study [U10] often exclude the even poorer, particularly those associated with market functions. It is the political function of groups that is of primary importance in helping to overcome marginalization and social exclusion experienced by the poorest.
Nasution (2008) retrieved data from Indonesia’s Central Board of Statistic. Primary data comprised of farm development by the government, rural poverty in each village, farmer experience in poverty alleviation, and heads of villages, field farm officials, farmer group units, and field observation. Regression model was developed with classical normal linear regression model to reveal each variables share on rural poverty. Therefore, none of these studies had studied the current topic of poverty measurement among crop farmers in crude oil polluted areas in Rivers State, Nigeria using socio-economic variables.
Objectives of the study
The main objective of this study is to measure and compare poverty existing in crop farmers households in crude oil polluted areas of Rivers State, Nigeria. The specific objectives are to:
(i) Measure and compare the level of poverty by years of farming experience among crop farmers’ households in crude oil polluted and non-polluted areas of Rivers State, Nigeria.
(ii) Determine and compare the level of poverty by cooperative membership of crop farmer households heads in crude oil polluted and non-polluted areas of the state.
(iii) Analyze and compare the level of poverty by other working members of the households in crude oil polluted and non-polluted crop farms in Rivers State.
(iv) Make suggestions on how poverty could be alleviated among crude oil polluted crop farmers’ households in Rivers State, Nigeria.
Tsui (1996) studied a class of subgroup decomposable poverty measure whose changes may be decomposed into a growth and redistribution components. Bourguignon and Fields (1997) examined the distributional properties of poverty measures which are discontinuous, at the poverty line. It was shown that among all the additive poverty measure, only those measures with some discontinuous jump at the poverty line were such that it is optimal to allocate a given anti poverty budget either to the richest of the poor, or to the poorest of the poor, or to both. A special class of such poverty measures is an extension of the well known
p[U1] , the properties of which were investigated by them. Adams and Page (2005) results showed that both international migration and remittances significantly reduce the level, depth and severity of poverty in the developing world. The results suggested that a 10% increase in the share of international migrants in a country’s population will lead to a 2.1% decline in the share of people living on less than $1.00 per person per day. A similar 10% increase in per capita official international remittances will lead to a 3.5% decline in the share of people living in poverty.
Jolliffe et al. (2005) using a production survey from 1989 to 2001, considered the impact of food stamps on three measures of poverty - the headcount, the poverty gap and the squared poverty gap. They found that in comparison to the headcount measure, food stamp benefits led to large reduction in the poverty gap and squared poverty gap measure.
Dercon (2006) reported that a new decomposition of poverty changes was developed to analyze the determinants of poverty changes during a period of economic reform (1989 – 1995) in villages in Ethiopia. Poverty fell substantially, but with diverse experiences across villages. The farming experiences of the poor were mixed. One group of the poor in 1989, with relatively good land and location, out performed all other households, while another group with much poorer endowments and location experienced virtually unchanged and persistent poverty.
Babu and Sanyal (2009) in their work on food security, poverty and nutrition policy analyzed the measurement and determinants of poverty using logistic regression models. In their study they derived poverty line, poverty gap index and squared poverty gap index and other related variables. Gupta et al. (2009) assessed the effect of the steady growing remittance flows to sub-saharan
Africa.
The study found that remittances which were a stable private transfer have a direct poverty mitigating effect, and promote financial development. Maertens and Swinnen (2009) compared the characteristics of households who did not participate at all in French bean production and processing (non-participants) in Senegal, households with one or more members employed in the French bean agro – industry (agro-industrial employed), and households producing French bean on contract (contract farmers) and found that there were substantial differences in their human, physical and social capital. More contracted farmers were members of a farmers’ organization. They found out that export grew and contributed importantly to rural incomes and poverty reduction.
Data collection
This study was conducted in Rivers State of Nigeria. The state is located in the southern part of the Niger Delta region of Nigeria and is blessed with abundance of natural resources including majority of Nigeria’s crude oil and gas deposits (Ekpo, 1981; Osuji, 1998; Abii and Nwosu, 2009). Rivers State is characterized by two distinct seasons; wet and dry, which favour the cropping of cassava, yam, cocoyam, maize, oil palm, plantain, banana, vegetables, fruits etc.
Data was collected from both primary and secondary sources. The primary data were collected through personal interviews and observations with the farmers, and structured questionnaires distributed among farmers in crude oil polluted and non crude oil polluted areas of an affected community in the state. Data on socio-economic variables, household expenditure, area of farmland cultivated, area of farmland
[U1] spilled or acquired for crude oil exploration, exploitation and production, value of crops lost, output, value of crops produced etc. formed the bulk of information generated.
A multistage sampling procedure was used to obtain data for this study. It is a known fact that crude oil production, exploitation and exploration activities are widespread throughout the 23 local government areas (LGAs) of the state. The first stage involved the selection of 17 LGAs out of the existing 23 LGAs in the state. These 17 LGAs were selected because they were more crop farming inclined than others. The second stage involved the stratification of farmland in an LGA into two sampling units such as crude oil polluted and non-crude oil polluted. This stratification of the farmland into two sampling units was based on the fact that information were needed from both crude oil polluted and non-polluted areas.
The third stage involved the random sampling of 10 crop farmers from crude oil polluted areas in a selected LGA and a corresponding number of 10 crop farmers from non-crude oil polluted farmland in the same locality (community) in the given LGA. This summed to 20 crop farmer households interviewed per selected LGA in Rivers State. Ten crop farmer households only were sampled for easy survey and enumeration during random sampling, cost effectiveness and ensuring that the differences in crop production in the number of crude oil polluted and non-polluted farmland in the different LGAs could easily be compared.
Therefore, a total of 340 questionnaires were distributed among crop farmer households in the 17 LGAs selected which included: Abua/Odual, Ahoada West, Ahoada East, Andoni, Asaritoru, Degema, Eleme, Emohua, Etche, Gokana, Ikwerre, Khana, Obio/Akpor, Ogba/Egbema/Ndoni, Omuma, Oyigbo and Tai LGAs.
However, only a total of 296 questionnaires were retained as suitable for analysis. These 296 questionnaires retained for analysis consisted of 169 questionnaires from crude oil polluted crop farmer households, and 127 questionnaires from non-crude oil polluted crop farmer households.
Poverty measures
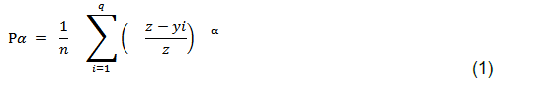
Ravallion (1992) on comparing the poverty measures for headcount (H) poverty gap (PG) and poverty severity (P2) said a common structure was evident in them and suggested a generic class of additive measures as follows:
Where, P

= weighted poverty index, q = the number of crop farmer households in poverty, y
i = the per adult equivalent expenditure of crop farmer household, z= the poverty line,
= 0, 1, 2 (that is, the degree of concern for the depth of poverty in a household
)[U1] , n = number of crop farmer households surveyed. for some non-negative parameter

. This is the Foster – Greer – Thorbecke (FGT) class of poverty measures (Foster et al., 1984). P
is simply the mean over the whole population of an individual poverty measure which takes the value (1 – yi/z)

for the poor and zero for the non-poor.
The main poverty measures of the headcount index has
= o, while
= 1 is for PG and
= 2 is for P
2. For both the poverty gap index P
1 and P
2 the individual poverty measure is strictly decreasing in the living standard of the poor (the lower the standard of living the poorer you are deemed to be). Further, P
2 has the property that the increase in your measured poverty due to a fall in standard of living will be deemed greater the poorer you are. For easy computation, Equation (1) is equivalent to Equation (2) (Ravallion, 1992
;[U2] Duclos et al., 2002):
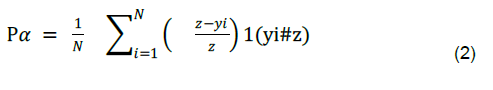
Where, N = total number of households surveyed (296 samples). I(.) = is an indicator variable which takes on a value of one if it’s argument is true (that is, the household is poor) and zero otherwise (that is, the poverty gap of the non-poor is set to zero).
Thus, the estimate of P
is simply the average of the poverty gaps raised to the power
, where by definition, the poverty gaps of the non-poor are zero. Clearly, a nice feature of the FGT – class of poverty measures is its simplicity and the ease with which it is calculated.
The socio-economic variables used in considering poverty experienced in this study were farming experience of household heads, their co-operative membership and other working members of the households.
Poverty measures by years of farming experience
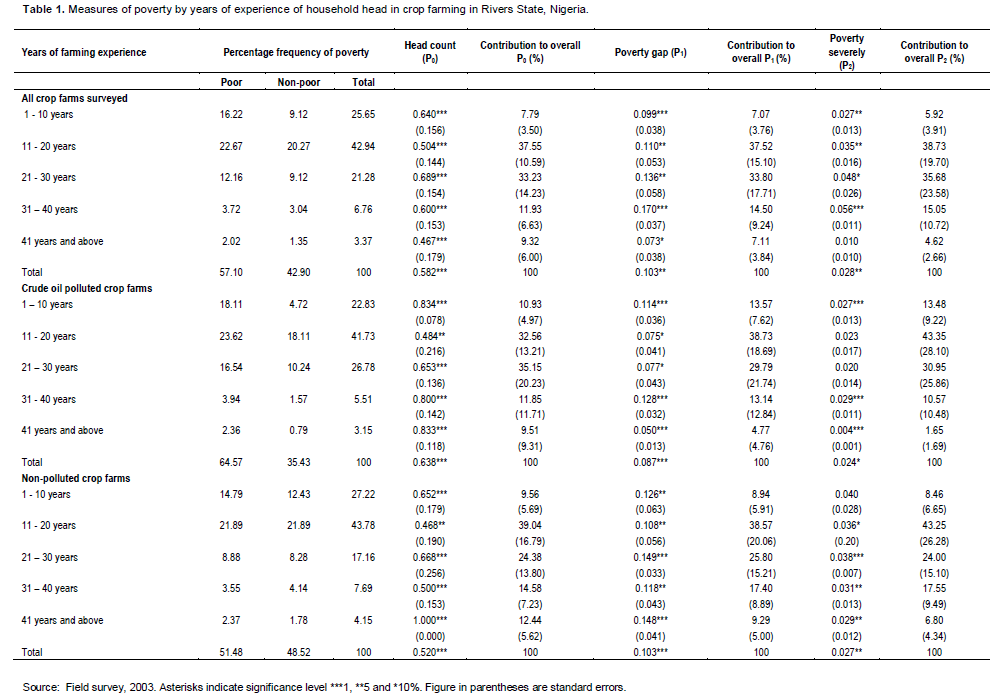
The measures of poverty by years of farming experience of household heads in crop production in Rivers State, Nigeria are given in Table 1. The table shows the result of years of farming experience in all farms surveyed in Rivers State, crude oil polluted and non-polluted crop farms respectively. In all crop farms surveyed, the average poverty level P0 was 0.582 (significant at 1%), average poverty level at P1 was 0.103 and for P2, it was 0.028 (both statistically significant at 5%).
In the crude oil polluted crop farmer households, the average poverty levels were P0 = 0.638; P1 = 0.087; P2 = 0.024, significant at 1% and 10% respectively. In the non-polluted crop farmer households (Table 1), the results of the headcount (P0) measure was 0.520 and P1 was 0.103, both statistically significant at 1%, while the average poverty measure for P2 was 0.027 (significant at 5%).
Poverty measures by membership of cooperative society
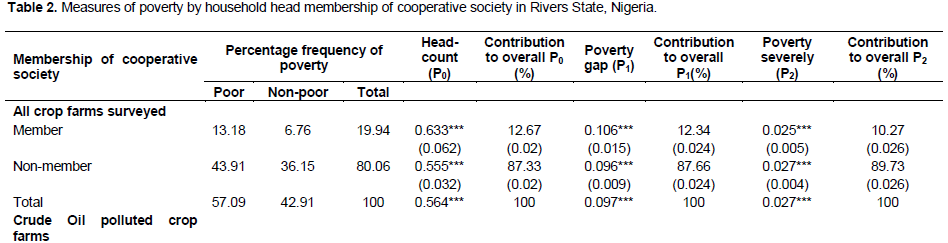
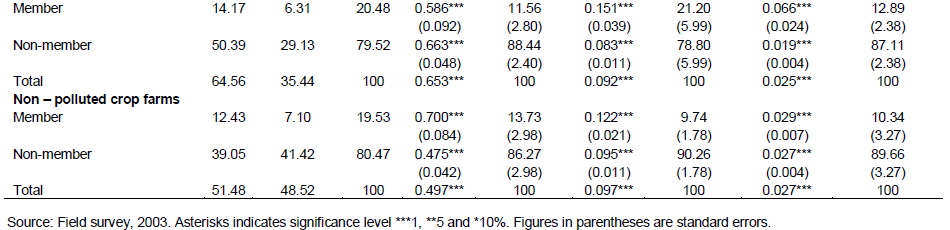
The poverty measures of household heads that belonged to one cooperative society or the other are shown in Table 2. The table contained results of all crop farms surveyed, crude oil polluted and non-polluted crop farms in Rivers State, Nigeria. In all crop farms surveyed, those who claimed to belong to one cooperative society or formation group or the other were 19.94% while those who do not belong to any cooperative formation were 80.06%.
The average poverty level in P
0 was 0.564 with a significance of 1%. Average P
1[U1] poverty measure was 0.097 while that of P
2 was 0.027, both statistically significant at 1%. The results of crude oil polluted crop farms on Table 2 showed that 20.48% of them were cooperative members, 79.52% did not belong to any cooperative. Average P
0 poverty level was 0.653, P
1 was 0.092 and P
2 was 0.025, all were statistically significant at 1%. In non-polluted crop farms, only 19.53% of the interviewed respondents were members of cooperative society, while 80.47% were none members. The average poverty level of P
0 was 0.497, P
1 was 0.097 and P
2 was 0.027, all statistically significant at 1%.
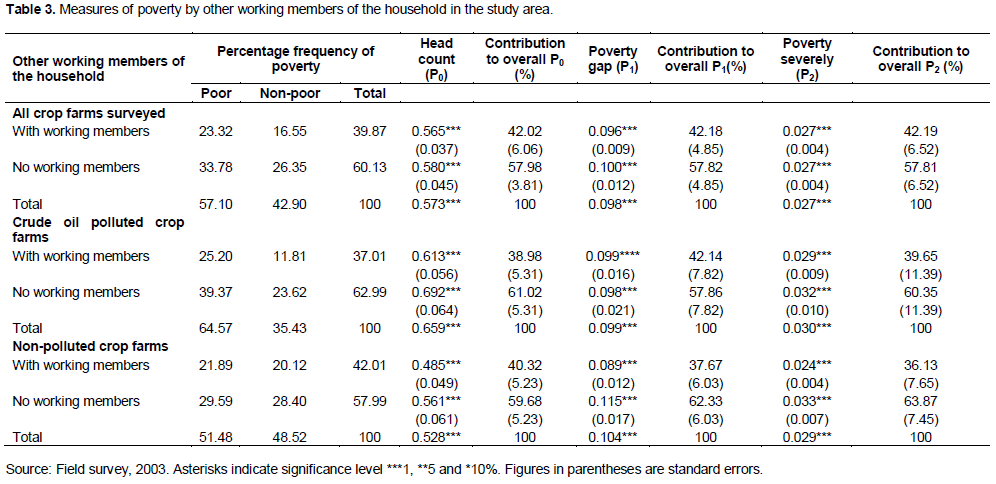
Poverty measures by other working members of the household
The poverty measures of other members of the household working apart from the head of the household in all crop farms surveyed, crude oil polluted and non-polluted crop farmers households are presented on Table 3.
The results of all crop farms surveyed showed that 60.13% of the household
s[U1] had no other members of the household working, while only 39.87
%[U2] of the households had such category of workers. The coefficient for average poverty level for P
0 was 0.573; P
1 was 0.098, while the average for P
2 was 0.027 (all statistically significant at 1% level. The results of the crude oil polluted crop farms in Table 3 showed that 62.99% of the households surveyed had no other working members, while about 37.01% had. The average coefficient value for P
0 was 0.659, that of P
1 was 0.099 and P
2 was 0.030, all statistically significant at 1% level. The non-polluted crop farms results (Table 3) indicated that about 42.01% of the interviewed respondents claimed to have other working members in their households, while 57.99% said they had none.
The average coefficient value of headcount poverty (P0) was 0.528, P1 was 0.104 and P2 was 0.029 respectively and they were all significant at 1% level.
Poverty measures by years of farming experience
There is likelihood of reduction in poverty in the households if the heads were adequately experienced in crop farming. There could be an increase in poverty level if, the crop farms were polluted by crude oil, years of experience in crop farming notwithstanding. From the headcount (P
0) results in all crop farms surveyed on Table 1, incidence of poverty was highest among the
21[U1] to 30 years of farm experience category, where 68.90% were poor, followed by 1 to 10 years group (64.0%), 31 to 40 years group (60.0%) and 11 to 20 years (50.4%). The intervals of years of crop farming experiences of 11 to 20 years and 21 to 30 years contributed about 70.78% of the overall incidence of poverty in P
0 ratio (both significant at 1%). In the poverty gap ratio (P
1), the interval of 31 to 40 years had the highest level of poverty where about 17.0% of the respondents in this group were very poor (or poorer), followed by 21 to 30 years group with 13.6% of the respondents being poorer than others. Again, the 11 to 20 years and 21 to 30 years groups accounted for more than 71.32% of the overall poverty in P
1 (both significant at 5%). At the P
2 (poverty severity) level, the 31 to 40 years group had the highest number of crop farmer households who were severely poor (5.6%), and followed by 21 to 30 years (4.8%).
The 11 to 20 years and 21 to 30 years groups still contributed the highest quota (74.41%) in the overall poverty measure. This showed that the crop farmers who were experienced between 11 to 40 years provided the highest number of poor farmer households.
Table 1 also indicated the results of crude oil polluted crop farms. At the head count level (P
0), the results showed that the incidence of poverty was highest among the households with 1 to 10 years of farming experience
([U2] 83.4% of the members of the group were poor), followed by 41 years and above (83.3%) and 31 to 40 years (80%), all significant at 1%. The interval of 11 to 30 years again contributed the highest level of incidence of poverty (67.71%) in the overall P
0 poverty level. In the P
1 measure, the group of 31 to 40 years of farming experience had the highest level of very poor (poorer) households (12.8%) and followed by 1 to 10 years (11.4%). Those households in the categories of 11 to 30 years of farming experiences also contributed more than 68.52% of the overall poverty among those deep in poverty. Poverty severity was worse in the group of 31 to 40 years with about 2.9% of the group being severely poor and this was followed by the 1 to 10 years interval where 2.7% of the group was severely poor both significant at 1%. The category of 11 to 30 years, again contributed the highest to overall poverty in P
2 measure (74.3%). Among the crude oil polluted crop farmer households, the 31 to 40 years category had the highest level of poverty at the P
0, P
1 and P
2 level respectively, followed by 1 to 10 years group, while the households heads who had 11 to 20 and 21 to 30 years of farming experience contributed the highest to the overall poverty at the incidence, depth and severity levels.
The results of non-polluted crop farms in Table 1 showed that 51.48% of the respondents were poor, while 48.52% were not poor. In the P
0 ratio, the results showed that there was absolute poverty among the group of 41 years and above (100%). This is a surprising result, as these household heads were the most experienced in crop production. Incidence of poverty was high among 21 to 30 years group (66.8%), followed by 1 to 10 years category (65.2%), both significant at 1% respectively. About 63.42% of the overall poverty in P
0 was contributed by the interval of 11 to 30 years of experience combined. At the P
1 level, the depth of poverty was very high among the 21 to 30 years of experience (14.9%) followed by 41 years and above (14.8%), significant at 1% respectively. More than 64% of the overall poverty of the population in P
1 was contributed by households in 11 to 30 years intervals. Following the results in P
2 class, severity of poverty concentrated among households in 1 to 10 years farming experience (4.0%), followed by 21 to 30 years (3.8%)
and the results [U3] were significant at 1%. About 67.25% of the overall poverty in P
2 was contributed by the households in 11 to 30 years of crop farming experience.
The results analyzed above, showed that there was higher level of incidence of poverty in the crude oil polluted crop farms than in the non-polluted crop farms and all crop farms surveyed in the state. This is evident from the average total figures of the incidence of poverty of 63.8% experienced by households in crude oil polluted crop farms as compared to 52.0 and 58.2% incidence (P0) of poverty levels experience by households in non-polluted crop farms and all crop farms surveyed in the state respectively. The difference in the incidence of poverty (P0) could have been caused by crude oil pollution on the crop farms (Edino et al., 2010; Efe, 2010). There existed generally poverty in the state, as the results showed. However, it was made worse by the presence of crude oil pollution on crop farms in Rivers State, Nigeria, the crop farming experience of the farmer being irrelevant. This result is similar to the results of Dercon (2006).
Poverty measures by membership of cooperative society
The poverty measures of household heads that belonged to a cooperative society were shown on Table 2. It is expected that a household head membership of one or more cooperative societies will reduce poverty in a given household, while if the head of a household does not belong to any cooperative society, there is likelihood of an increase in poverty in the household (
Waeterloos[U4] and Rutherford, 2004; Thorp et al., 2005; Maertens and Swinnen, 2007).
In all crop farms surveyed in Rivers State, Nigeria, 43.91% of those who did not belong to a cooperative society were poor while only 13.18% of those who belong to cooperative societies were poor. In the P0 measure, about 63.3% of the respondents who claimed to belong to cooperative societies were headcount poor, while about 55.5% of those who did not belong to any cooperative society were affected by incidence of poverty (both statistically significant at 1%). However, the none membership group contributed about 87.33% of the overall poverty in headcount ratio. The depth of poverty was higher in the group that claimed to belong to cooperative society (10.6%) as against 9.6% of the group of those who did not join cooperatives. In P1 measure, 87.66% of the depth in poverty was contributed by those who did not belong to cooperative societies. At the poverty severity level (P2) those who belonged to the cooperative societies were severely affected by poverty at 2.5% level, while those who did not belong had about 2.7% of them severely affected by poverty (all significant at 1%). However, 89.3% of the overall contributions to poverty in the P2 group were contributed by those who did not belong to the cooperative societies. These results showed generally that poverty existed in Rivers State among the crop farmer households, but was more evident in the households that did not join cooperative societies.
In crude oil polluted crop farms, 50.39% of the none
cooperative[U5] society members were poor, while in the group who joined cooperatives; it was only 14.17% of them that were poor. At the headcount (P
0) level (58.6%) of those who were cooperative members and 66.3% of none members of cooperative were affected by incidence of poverty respectively. About 88.44% of the overall poverty was contributed by the non
cooperative [U6] member households. The P
1 ratio results in crude oil polluted crop farms showed that about 15% of those who were members were deep in poverty, while 8.3% in the none membership category were deep in poverty, though they contributed more than 78% of the overall poverty in P
1 measure and 87.11% in the P
2 level (all results were significant at 1%). These results also showed that poverty was high in crude oil polluted crop farmer households with the incidence of poverty concentrating more among the none members and they also contributed between 78.80 to 88.44% of the overall poverty. These results were similar to the results of Thorp et al. (2005) and Maertens and Swinnen (2009).
In non-polluted crop farms, 39.05% of the poor were none members, while 12.43% of the poor were members. In the headcount (P
0) measure, the results showed that incidence of poverty concentrated among the members (70%), while none members had 47.5% incidence of poverty. The none members contributed more than 86% of the overall poverty in P
0 level. In the P
1 group, 12.2% of the members of cooperative society were deep in poverty, while 9.5% of the non members were deep in poverty. The none membership group contributed highest in overall poverty in P
1 (90.26%). In the P
2 category, members that were severely poor were 2.9%, in the none membership category, poverty was very severe amongst 2.7% of the households (all statistically significant at 1% level). The none membership category contributed about 89.66% of the overall poverty in P
2 measure. Again results obtained in non-polluted crop farms showed that there was poverty existing in the households, despite the fact that majority of the overall poverty (86.27 to 90.26%) were contributed by the none members
as[U7] earlier observed.
In comparison, it was observed that poverty existed on crop farmer households in Rivers State, Nigeria in all categories of farms. Majority of the poverty was contributed by none members of cooperative societies in the state, in most cases occurring for more than 80%. However, poverty was relatively higher amongst the none member households in crude oil polluted crop farms (66.3%) as against 47.5 and 55.5% in non-polluted and all crop farms surveyed in Rivers State, Nigeria. Also, in the crude oil polluted crop farms, the average incidence of poverty was higher (65.3%) when compared to the values of 49.7 and 56.4% in non-polluted and all crop farms surveyed respectively. These higher levels of poverty noted above, could have been caused by the negative effects of crude oil pollution on crop farms in Rivers State, Nigeria (Eweje, 2006
;[U8] Edina et al., 2010
; [U9] Efe, 2010). The results are different from the researches of Agudelo et al. (2003); Swinton et al. (2003), and Swinton and Quiroz (2003). These researchers found out that household poverty were not correlated with environmental degradation while this study found out that the higher poverty levels experienced by households were as a result of crude oil pollution on their environment.
Poverty measures by other working members of the household
Among crop farm families, an additional variable included is a binary variable that indicates whether or not the household head has other working members in his/her household. The household occupation ratio (ratio of employed household members to the total household members) is negatively related to the likelihood of poverty. A higher ratio reduces the likelihood of poverty. The probability of poverty is expected to increase if the household head does not have other working members in the household.
In all crop farms surveyed in Rivers State (Table 3) the results showed that 23.32% of the household with extra working members (outside the household head) were poor, while 33.78% of those household without any additional working member were poor. At the P0 level, 56.5% of the households with additional working members experienced incidence of poverty, while a higher percentage (58.0%) of the household without other working members experienced incidence of poverty. In the P1 level, about 9.6% of those households with extra working members were deep in poverty while 10% of those without extra working members were deep in poverty. In all crop farms surveyed, the households without additional working member contributed higher percentage of overall population poverty with 57.98% at P0, 57.82% at P1 and 57.81% at P2 (all figures were statistically significant at 1%).
Table 3 indicated the probability of poverty occurrence in a household with or without other working members in crude oil polluted crop farms. The study observed that more than 64% of the respondents were poor of which 25.20% of them were household heads with other working members. There was a high level of poverty observed at the headcount (P0) ratio where 69.2% of households without additional working members were poor, while 61.3% of the households with working members were poor. This meant that those without other working members experienced more poverty during the period of survey and contributed more to the overall poverty in the P0 category with 61.02% of poverty as compared to 38.98% in the households with other working members. At the depth of poverty (P1) and poverty severity (P2) levels, the contributions to overall poverty were 57.86 and 60.35% respectively, which maintained that poverty of households without other working members was worse than poverty in households with other working members.
Table 3 further showed that 51.48% of the household heads were poor, of which 21.89% were having other working members in the households in non-polluted crop farms. However, a total of 48.52% were not poor. The P0 value for household heads without additional working members was 56.1%, while the value of P0 for households with extra working members was 48.5%. The P0 (59.68%), P1 (62.33%) and P2 (63.87%) results showed that the households without other working members contributed more to overall population poverty as compared to the households with extra working members.
In comparison, the results of the study showed that there was poverty existing in Rivers State, Nigeria, irrespective of the category of farms studied with average incidence of poverty being 65.9% in crude oil polluted crop farms, 52.8% in non-polluted crop farms and 57.3% in all crop farms surveyed. The results also showed that there was more poverty experienced at the P
0, P
1, and P
2 levels in the households without extra working members, which contributed 57.81 to 63.87% of the overall poverty in the population than in the households with additional working members
whose contributions were 36.13 and 42.19%. [U10] These results are similar to Dorward et al. (2004), Adams and Page (2005), Grupta et al. (2009) and Maertens and Swinnen (2009). The results further showed that incidence of poverty was higher in crude oil polluted crop farms with households without additional working members experiencing poverty up to 69.2% as compared to 56.1% in non-polluted crop farms and 58% in all farms surveyed. Even in the households with other working members, poverty was more severe in crude oil polluted farms (61.3%) as compared to 48.5% in non-polluted crop farms and 56.5% in the all crop farms surveyed. The reason for these differences could be the presence of crude oil pollution on crop farms in Rivers State, Nigeria. Therefore, crude oil pollution makes the crop farmer households to experience more poverty (Osuji and Nwoye, 2007; Idemudia, 2008; Orogun, 2009; UNEP Report, 2011
;[U11] Platform, 2012).
This study observed that poverty existed generally in crop farmer households in Rivers State, Nigeria in all categories of crop farms and all socio-economic variables studied. The results of the poverty measures by years of experience of household head in crop farming in Rivers State, Nigeria showed that poverty was more pronounced amongst the 1 to 30 years group of farming experiences ranging from 72.98 to 80.33% as their contributions to overall poverty in the population. The results on years of crop farming experience in Rivers State also showed that there was higher level of incidence of poverty (P0) in crude oil polluted crop farmer households with average poverty incidence of 63.8% as compared to 52% in non-polluted crop farmer households and 58.2% in all crop farms surveyed category.
Majority of poverty was contributed by none members of cooperative
societies[U1] , in most cases occurring for more than 80%. Also, there was more incidence of poverty (P
0) experience in crude oil polluted crop farmer households (65.3%) than in non-polluted crop farmer households (49.7%) and in all crop farmer households surveyed (56.4%) in the state using household heads membership to cooperative societies as yardstick in Rivers State, Nigeria.
The results of this study showed that there was more poverty experienced at the P0, P1, and P2 levels in the households without other working members, contributing 57.81 to 63.87% of the overall poverty in the population than in the households with additional working members whose contributions ranged from 36.13 to 42.19%. The results further showed that incidence of poverty (P0) was higher in crude oil polluted crop farmer households (65.9%) as compared to 52.8% in non-polluted crop farmer households and 57.3% in all crop farms surveyed in Rivers State, Nigeria.
The supposed reason for the increase in the level of incidence of (P0) in crude oil polluted crop farms could be due to the presence of crude oil pollution on crop farms in Rivers State, Nigeria. Therefore, crude oil pollution, caused by crude oil exploration, exploitation and production, in Rivers State, Nigeria increased the poverty level experienced by crop farmers (Idemudia, 2008) hence; the study confirmed that crude oil pollution impoverished the crop farmer (Onwuka, 2005; Chikere et al., 2009; Platform, 2012).
This study therefore makes the following recommendations to ameliorate the high incidence of poverty being experienced by crop farmer households in crude oil polluted areas.
(i) Crop farmer households who
have [U1] suffered economic losses and therefore became poorer, due to crude oil pollution on their farmland should be financially compensated after qualified experts had evaluated and sanctified their claims (UNEP’s Report, 2011) thereby alleviating them from poverty. This will enable them establish other businesses that may not easily be affected by crude oil pollution in the area which might make them escape poverty.
(ii) Secondly, there should be increase in sources of non-farm income and diversification of existing sources of income which will reduce over dependence on farmland and hence poverty experienced in crude oil polluted crop farmer households. This could be done by job creation to increase
the number of [U2] other working members of the households. It is also expected that household heads joining cooperative societies (Thorpe, 2005) to increase their sources of income (Gupta et al., 2009; Maertens and Swinnen, 2009) could help reduce the poverty experienced by crop farmer households in Rivers State, Nigeria as observed in this study.