Sesame (Sesamum indicum L.) belongs to the genus Sesamum, order Tubiflorae and family pedaliaceae and is a diploid species with 2n = 2x = 26 chromosomes and it has numerous wild relatives in Africa and small numbers in India (FAO, 2012). It is the oldest self-pollinating annual oilseed originated in Africa, Ethiopia domesticated over 5000 years ago. Although originated in Africa, it was spread early through West Asia to India, China and Japan which became secondary distribution centers and it is now cultivated in many parts of the world (Yamanura, 2008). Sesame is an oilseed crop grown for its seed and oil of local and export markets is a great source of income for farmers, traders, processers and the national economy of Ethiopia. It is used in local consumptions; for cooking, salad and margarine. It is also used in the manufacture of soaps, paints, perfumes, pharmaceuticals and insecticides. The meal, left after the oil is used as feed for poultry, livestock and as fertilizer (Khanna, 1991).
Sesame world production is estimated at 3.24 million metric tons in 2007 and increased to 3.84 million metric tons in 2010 and almost 90% of production area was in Asia and Africa. Ethiopia was the 7th major sesame producing country in the world in the year 2004 with area coverage 65,000 ha, production about 49,000 tons and productivity about 479 kg ha-1 (IPMS-Ethiopia Farmers Project, 2005). Now, Ethiopia is the 4th with area coverage 384,682.79 ha, production about 327,740.92 tons and productivity is estimated as 852 kg ha-1 (CSA, 2011/2012).
Sesame seed is the second largest export earner for Ethiopia next to coffee due to it’s excellent demand in the international market and then contributed significant role for the achievement of the country's economic growth over the last few consecutive years. The export of sesame seeds was 43,131 tons in the year 2007 and it was almost doubled 82,201 tons in the year 2011 and the major imported countries are: China, Japan, Turkey, Republic of Korea, USA, Saudi Arabia, Syrian Arab Republic and Mexico (Haile, 2009). It is also consumed by existing domestic large and small-scale oil mills (CSA, 2011/2012). The uses of sesame are:
(1). Edible oil: The oil is almost odorless with a distinctive nutty sweet flavor. Roasted sesame oil resists rancidity due to the antioxidants formed during seed roasting.
(2). Confectionary, biscuit and bakery industry: Mostly hulled clear white sesame is required for bakery products. Hulled sesame sticks to the bread or roll, while maintaining the white color after baking.
(3). Tahini industry: Tahini, a traditional Middle Eastern paste, is made from hulled sesame seed and is rich in protein.
(4). Halva industry: Halva is a sweet made of 50% tahini, boiled sugar and other ingredients.
(5). Sesame flour and sesame seed sprouts.
(6). Pharmaceutical ingredients (Wijnands and Biersteker, 2007).
Sesame oil is non-drying oil; highly stable and it is very rich in protein, a polyunsaturated fat used in margarineproduction and cooking oils. It is an ingredient in soap, cosmetics, lubricants and medicines. In general, sesame an oil seed involves in food, industrial, and pharmaceutical uses all over the world. Its agronomical uses include: - An excellent rotation crop of cotton, corn, peanut and sorghum, an excellent soil builder which improve soil texture, soil moisture retention, lessoning soil erosion and resistance to drought (Jewol, 2007). Its temperature requirement is 20 to 35°C. It is adaptable to many soil types but it performed best on well drained and medium textured fertile soil. It does not grow well on heavy clay soils and salty soil. It will die on water logged area (Haile, 2009).
The average productivity of sesame (S. indicum L.) is low as compared to other oilseeds, due to the complex yield constraints like abiotic and biotic factors. These factors are the main contributors for genotype x environmental interaction (GEI) in crops yield uncertainty. Genotype x environment interaction is a challenge for plant breeders and complicates cultivar recommendation because of the inconsistency of best-yielding material across cropping environments. However, it may also offer opportunities; it means yields can rise through growing materials specifically adapted to a given area or through using crop management practice, or preventing yield reduction in unfavorable years through the cultivation of stable-yielding materials.
In crop research, the most commonly used way to evaluate the effect of the uncontrollable environmental factors on crop response is to repeat the experiment at several sites in a single year, or over several crop seasons in a single site, or both. Genetic erosion would prevent by tested the genotypes adaptability over multi-environments at early strategy rather than testing done only in one environment (Gauch and Zobel, 1996). Assessing any genotype or agronomic treatment without including its interaction with the environment is incomplete and thus limits the accuracy of yield estimates (Crossa, 1990).
Clustering of the testing environments, identifying the degree of interaction of genotype by environment and recommending stable genotype(s) across the environments or specific adaptive genotype(s) for each environment can reduce the undesirable effect of GEI and increase the effectiveness of productivity. Several studies were carried out on GEI by different researchers on various oilseeds like sesame genotypes (Zenebe and Hussien, 2009; Hendawey and Farag, 2010), Linseed genotypes (Crossa, 1990), linseed and sesame genotypes (Hariprasanna et al., 2008).
In eastern Amhara Ethiopia, always a problem of yield instability due to diversified environmental conditions and there is no study about GEI on sesame production. Therefore, it is important to study the extent of the influence of the environment on the expression of a trait of interest, like seed yield using appropriate materials. Hence, this experiment was conducted to determine the magnitude of genotype and environmental interactions for seed yield and to assess the stable or specific sesame genotype(s).
The experiment was carried out in two years (2010 and 2011) main cropping seasons (July to December) at the following five representative sesame growing areas of Eastern Amhara Region, Ethiopia, such as: (i) Chefa representing the lowland areas of south Wollo zone with an altitude of 1465 masl, global position 10°37’N 39°47’E, annual rain fall 850 mm, minimum temperature 12.5°C, maximum temperature 29.9°C and soil type vertisol (for two years), (ii) Kobo representing the lowland moisture deficit areas of north Wollo zone with an altitude of 1465 masl, global position 11°09’N 39°36’E, annual rain fall 634 mm, minimum temperature 15.9°C, maximum temperature 30.5°C and soil type Eutric Fluvisol (for two years), (iii) Jari representing the mid altitude with terminal moisture deficit areas of south Wollo zone with an altitude of 1680 masl, global position 11°21’N 39°38’E, annual rain fall not available, minimum temperature not available, maximum temperature not available and soil type vertisol (for one year), (iv) Sirinka representing the mid altitude relatively normal rainfall areas of north Wollo zone with an of altitude 1850 masl, 11°45’N 39°36’E, annual rain fall 876 mm, minimum temperature 13.6°C, maximum temperature 26.3°C and soil type Eutric vertisol (for one year) and (V) Shewarobit representing the lowland moisture deficit areas of north Shewa zone with an altitude of 1300 masl, 10°59’N 39°53’E, annual rain fall 597 mm, minimum temperature 13.1°C, maximum temperature 32.5°C and soil type not available (for two years) totally eight environments.
In this experiment, twelve sesame genotypes were used namely Local variety (from eastern Amhara farmer), Acc. 00035, Acc. 00044, Acc. 00046, Acc. 00047, Acc. 018, Hirhir-Kibe, (from Werer Agricultural Research Center), Acc.202-344, NN-0143, Acc.202339, Acc.202340 (from Institute of Biodiversity Conservation) and Borkena from (from Sirinka Agricultural Research Center).
The trial was laid down in randomized complete block design (RCBD) with three replications. The size of the experimental plot was five rows with five-meter long. The row - to - row and plant-to-plant distances was 40 and 10 cm, respectively. Sowing was done by hand drilling at moist soil in the rows with a seed rate of 5 kg ha-1 and thinning was done after 25 days of sowing, fertilizer was not applied. Weeding and other practices were applied for all the plots uniformly. To reduce border effects, data were recorded from the three central rows and the net harvested area was 6 m2.
Statistical analysis
The twelve genotypes of variance at each environment and combined analysis of variance at eight environments were subjected using general statistics (GenStat) program version 13 (Payne et al., 2006) software to observe the difference among genotypes in their performance in seed yield and seed yield related traits. The statistical significance of ANOVA components and homogeneity test of the error mean squares from the individual analysis of variance were determined using the application of the F-test (Gomez and Gomez, 1984).
The different stability parameters; Wricke’s ecovalence (Wi) (1962) and Eberhart and Russell (1966) regression coefficient (bi) and deviation from regression (S2di), cultivar superiority measure (Pi) of Lin and Binns (1988), Additive Main effect Multiplication Interaction (AMMI) and AMMI Stability Value (ASV) Purchase (1997) models were carried out using Agrobase (2000) software. Although data were collected on various characters such as oil content (%), oil yield (kg ha-1), thousand seeds weight (gm), flowering and maturity days, etc. only seed yield (kg ha-1) was considered in stability analysis and presented for a paper to avoid bulkiness of the data in a manuscript and seed yield is the result of the contribution of all seed yield related traits.
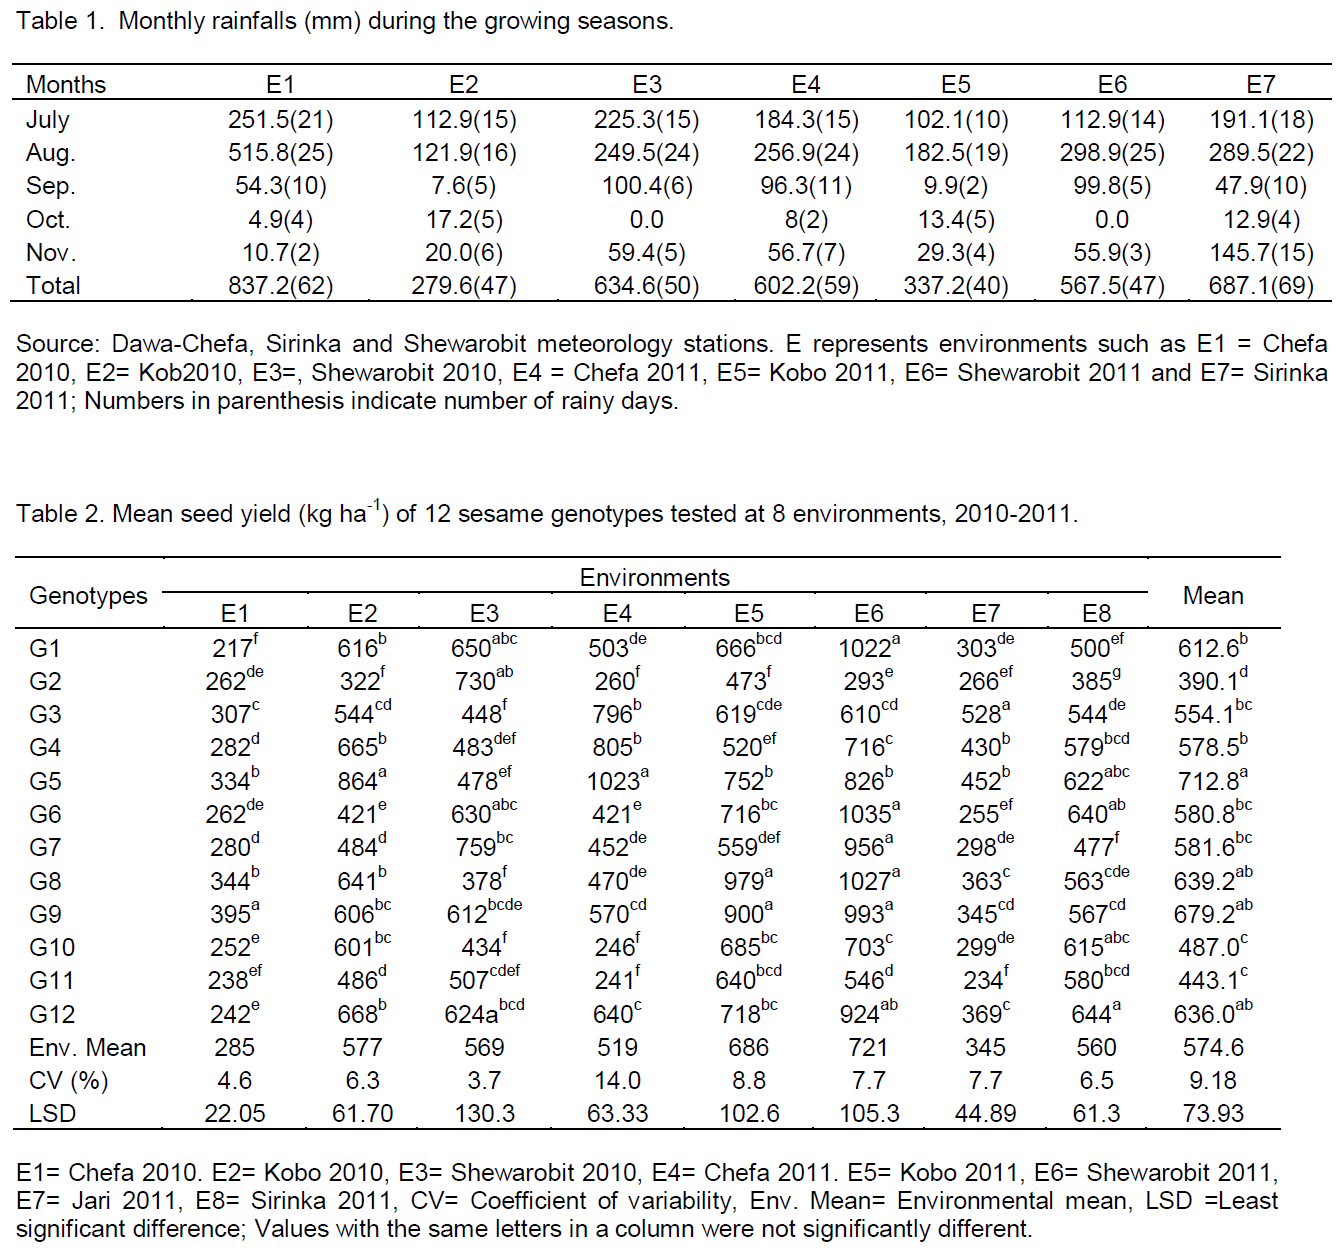
The experiment was conducted in eight environments at five representative sesame growing areas of eastern Amhara. The rainfalls (mm) during the growing seasons of the locations of the two cropping seasons were recorded. The rainfall during the growing seasons of the locations ranged from 279.6 mm at Kobo 2010 to 837.2 mm at Chefa 2010. Maximum rainfall was recorded during the seedling and vegetative stages of the crops in July and August; however, there was shortage of rain at the flowering and pod setting stages of the crops in September and October, but at the maturity stage (November), there was high rainfall (Table 1). Minimum temperature of the locations ranged from 7.4°C in November at Chefa 2010 to 20.3°C in June at Kobo 2010 and maximum temperature ranged from 26.2°C in January at Chefa 2011 to 36.0°C in June at Shewarobit 2011.
Seed yield (kg ha-1) and oil content (%)
The mean seed yield (kg ha-1) of individual environment was presented in Table 2. The individual analysis of variance revealed that, this character was highly significant (P<0.01) indicated the presence of genetic variability among genotypes; hence, theses genotypes could be used as source of breeding materials to develop hybrid varieties.
Overall mean seed yield ranged from 217 kg ha-1 for genotype G1 at Chefa in 2010 to 1035 kg ha-1 for G6 at Shewarobit in 2011. The highest mean seed yields across environments were shown by genotypes; G1, G5, G8, G9, and G12 with overall mean seed yields (612.6. 712.8, 639.2, 679.2 and 636 kg ha-1), respectively, and were higher than the grand mean (574.6 kg ha-1) and national average (479 kg ha-1); whereas the lowest mean seed yields were recorded for the G2, G10, and G11 (390.1, 487 and 443.1 kg ha-1), respectively. The genotypes responded differently to the different environments for their seed yield with rank changed, this indicating that selection should be based on mean performances of the genotypes and similar result were reported by El-Bramawy and Shaban (2007) in sesame and Adane (2008) in linseed.
Regarding yield across environments the highest mean seed yields (kg ha-1) were recorded at Shewarobit and Kobo both in 2010 and 2011 cropping seasons, this shows that the two locations are suitable for sesame production. At these locations, most of the genotypes had good performance and gave mean seed yields more than grand mean and national average (574.6 and 479 kg ha-1), respectively; the reason might be these locations have warm conditions with sandy soil and short rain seasons.
Hence, Shewarobit and Kobo are suitable for sesame production. Chefa, Jari and Sirinka have relatively high altitude with low temperature and clay soil. In these locations, most of the genotypes showed poor performance and gave low seed yields (kg ha-1), therefore, Chefa, Jari and Sirinka are not suitable for sesame production. Sesame seed yield was increased at low altitude environments; indicated that this crop can well perform at low land areas and it is a warm lover crop.
Oil content was determined using Nuclear Magnetic Resonance method (Robbelen et al., 1989). Homogeneity test was carried out through the application of the F-test (Gomez and Gomez, 1984) and as the oil content showed heterogeneous error variance, therefore, arcsine transformation was done and figures in parenthesis were arcsine transformed value.
The mean oil content of the genotypes was ranged from 46.4% (42.9) by G12 to 53.4% (47.0) by G4. High oil content across environments were obtained from genotypes G4 [51.0% (45.0)], G3 [51.0% (45.6)], G8 [51.0% (45.6)], G5 [50.8% (45.5)], G10 [50.5% (45.3)], G11 [50.2% (45.1)], and G1 [50.1% (45.1)]. Genotypes G1, G3, G4, G5, G8, G10 and G11 are fulfill World export standard that is, their oil content records 50% and above. Across locations, Chefa, Jari and Sirinka gave high mean oil content, while Shewarobit and Kobo gave lower oil content. According to this finding, oil content of genotypes showed increasing trend to environments increasing in altitude and receiving better rainfall amount. On the other hand, oil content of genotypes drastically decreased in moisture-deficit environments. This is because in moisture-deficit environments genotypes would tend to synthesize proteins so as to cope up the unfavorable environments. As seed yield increases oil content decreases so, to improve the oil production of sesame, selection should be based on high seed yielder with relatively oil content producing genotypes or cross breeding of high seed yielder genotype with high oil content producer genotype. Similar result was reported by Zenebe and Hussien (2009) in sesame.
Seed yield related traits
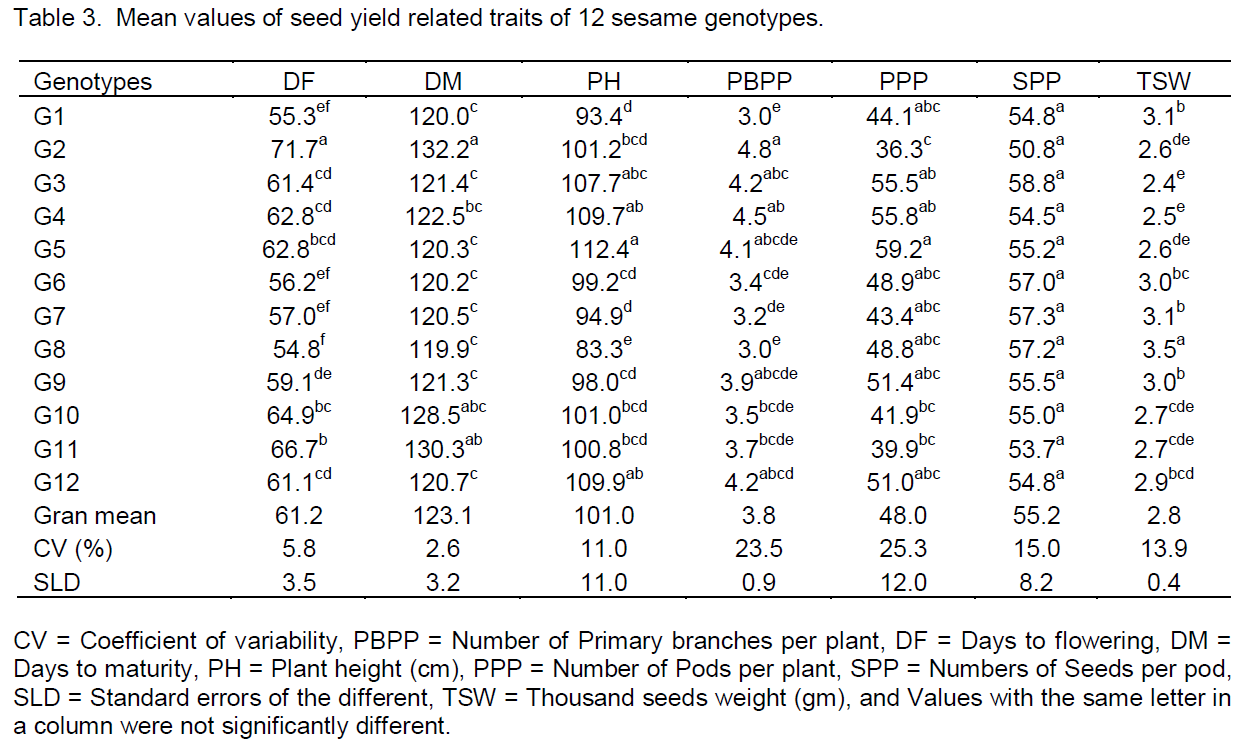
The analysis of variance of seed yield related traits showed highly significant variability (P<0.01) among genotypes evaluated for all parameters except number of seeds per pod (SPP) in all environments (Table 3), this showed that, the genotypes had variability for phenological and agronomic traits. There were significant different between genotypes in days to flowering (DF), days to maturity (DM), plant height in cm (PH), thousand seeds weight in gram (TSW), number of primary branches per plant (PBPP) and number of pod per plant (PPP), this result agrees with the findings of Abou El-Nasr et al. (2006) in mustard, Adane (2008) in linseed and Nigussie (2012) in common bean. Genotypes G1, G6, G7, G8 and G9 were recorded 3.0 g and above for thousand seeds weight in gram (TSW) so they fulfill the requirement of international oilseed market standard.
Most genotypes were early flowered and matured at Shewarobit (56.5 and 103.7 days) and Kobo (58.4 and 114.7 days), respectively, but flowered lately at Jari and Chefa (66.3 and 68.4) and matured lately at Jari and Sirinka (146.2 and 146.9 days), in that order. All genotypes were flowered and matured earlier than local variety this showed that the improved varieties can escape short rain seasons than the local variety.
Combined ANOVA and estimation of variance components
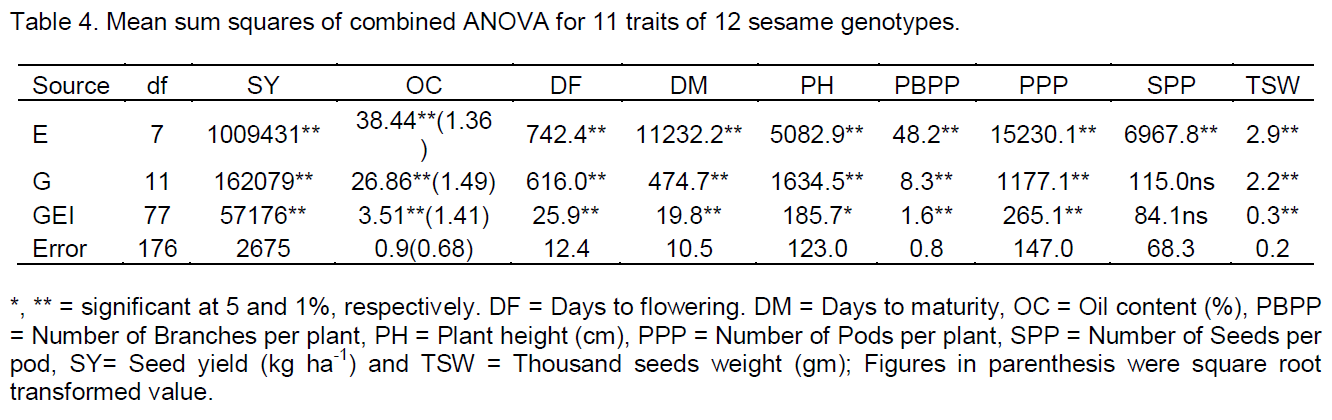
Combined analysis of variance was also conducted for the traits considered. Homogeneity test of the error mean squares from the individual analysis of variance was carried out through the application of the F-test for all characters (Gomez and Gomez, 1984). The traits showed homogeneous error variances except for oil content (%). In order to conduct combined analysis, arcsine transformation for oil content was used as the variances tend to be proportional to the means (Table 4).
The result of the combined ANOVA indicated that there were highly significant variations among environments and among genotypes across all environments in the two cropping seasons. The environments had different impacts on the yield potential of the genotypes and genotypes showed rank difference; hence, the breeding strategy should be based on the performance of the genotypes. Similar results were reported by Adane (2008) in linseed, Zenebe and Hussien (2009) in sesame, Molla (2010) in finger millet and Nigussie (2012) in common bean.
Stability analyses
Twelve genotypes at eight environments were quantified using the following models:
Wricke’s (Wi) ecovalence analysis
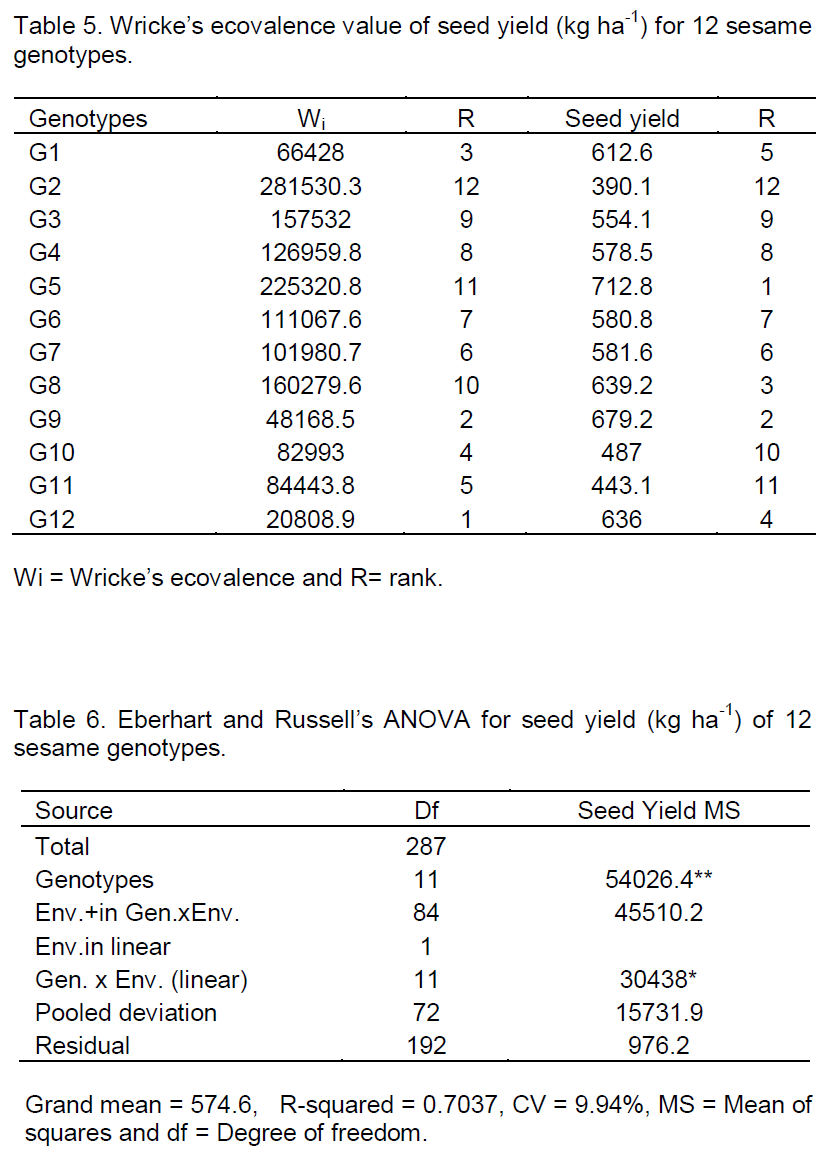
According to this model, genotypes with low value of Wi have smaller deviations from the mean across environments and are thus more stable. The lower the value of Wi the smaller will be the fluctuations from the predictable response in different environments so that the genotype with the least or zero ecovalence is considered to be ideal from the point of view of yield stability (Becker and Leon, 1988).
According to this stability parameter, the relatively stable genotypes were the fourth and the second high yielder genotypes G12 and G9. On the other hand the first top seed yielder genotype (G5) was the most unstable (Table 5). The result indicated that the highest yielder genotype (G5) have high ecovalence. According to Asrat et al. (2008) genotypes with high mean and large estimated value is suitable for high input environment. Hence genotype G5 was suitable for favorable environments, similar results were reported by Kassa (2002) in Ethiopian mustard and Alberts (2004) in common bean.
Eberhart and Russell's linear regression model
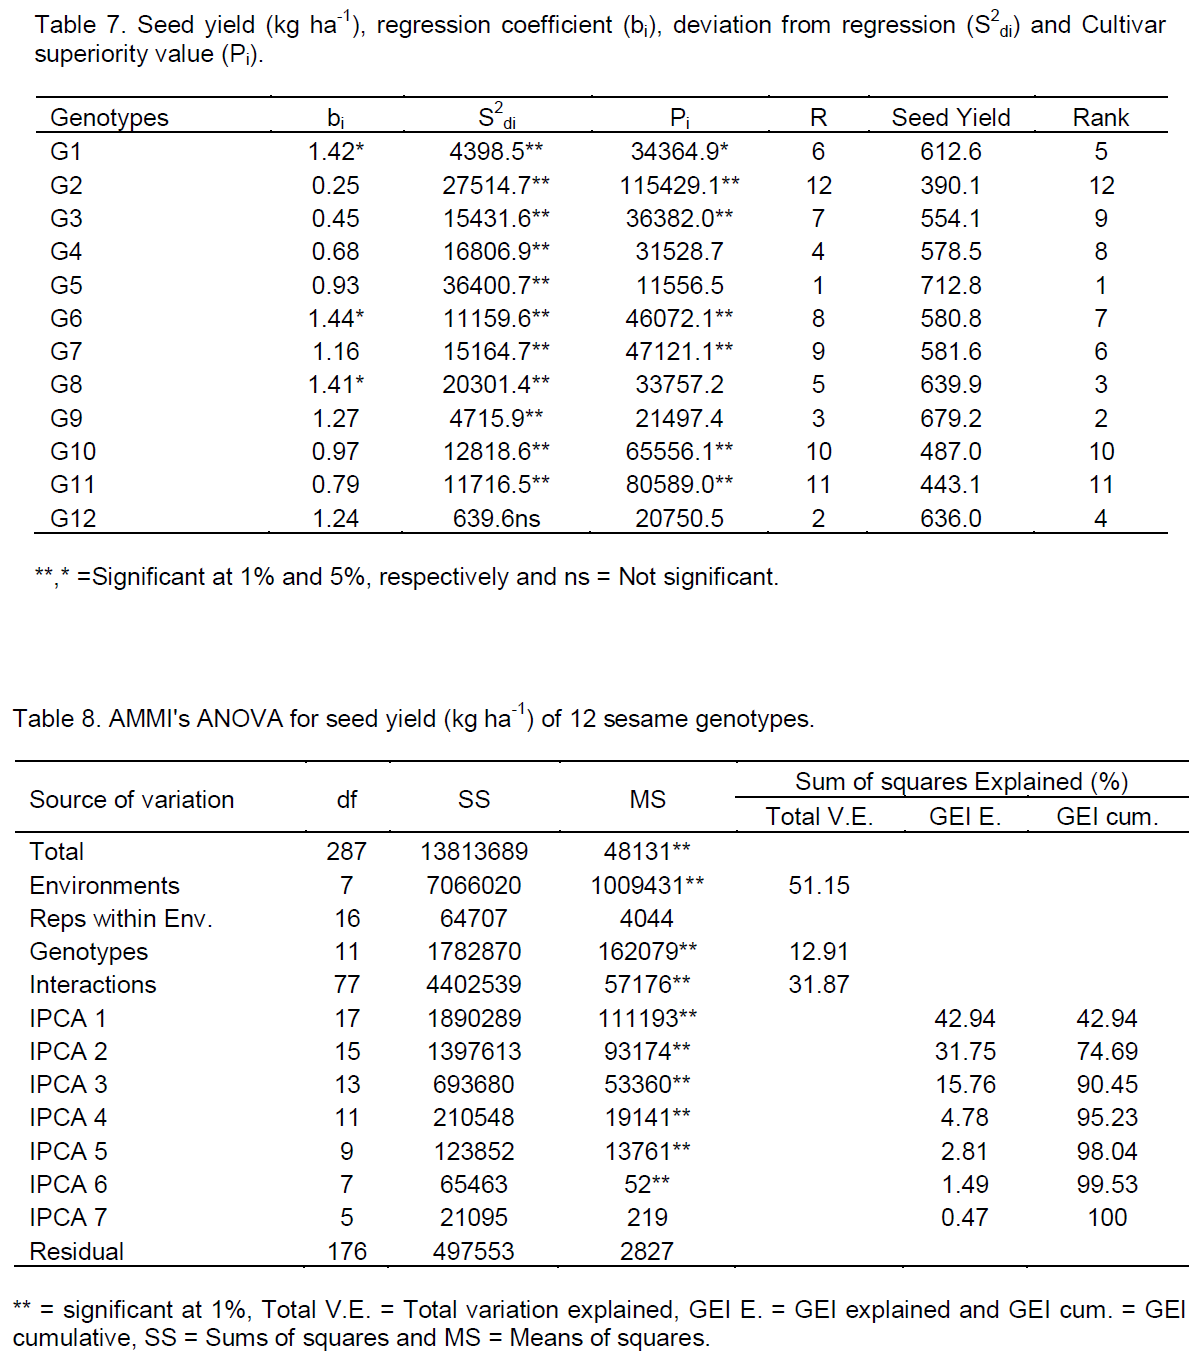
The mean squares for GEI was significant for seed yield (kg ha-1) (P<0.01) (Table 6). This permitted the partitioning of GEI effects into environment linear, GEI (linear) interaction effects (sum squares due to regression, bi) and unexplained deviation from linear regression (pooled deviation mean squares, S2di). The analysis of variance for the regression model of seed yield (kg ha-1) was presented in (Table 7). The stability analysis of variance revealed highly significant (P<0.01) different between genotypes, suggesting that there were considerable differential performance of the genotypes, this result was in line with Adane (2010) on linseed.
The GEI (linear) interaction of seed yield (kg ha-1) was significant (P<0.05), indicating that the stability parameter (bi) estimated by linear response to change in environment was different for all genotypes or genotypes had different slopes (Table 7). This confirms that GEI were in a linear function of environments indices as the mean of all the genotypes tested. The deviation from the regression (S2di) was not significant, indicating that, the nonlinear sensitivity in the expressions of these traits was not important. This result was agreed with the findings of Mahto et al. (2006) in finger millet.
The computed regression coefficients (bi) and deviation from regression (S2di) of seed yield (kg ha-1) of twelve sesame genotypes was presented in (Table 8). According to Eberhart and Russell (1966) model, a stable genotype should have high yield, unit regression coefficient (bi) and deviation from regression (S2di) nearly equal to zero. Based on these three preconditions, there was no stable genotype in this study.
The genotypes with the regression coefficient (bi) greater than one have below average stability, above average mean yield and highly sensitivity to environmental change, so these genotypes were best fit for specific adaptation in favorable or high potential environments, the genotypes with the regression coefficient less than one, have greater resistance to environmental change (above average stability), and thus increases the specificity of adaptability to low potential environments (Eberhart and Russell, 1966). As a result, genotypes: G1, G6, G7, G8, G9 and G12 had regression coefficients greater than unity, indicating their responsiveness to favorable environments, whereas, G2 and G3 had regression coefficient significantly lower than unity, showing their adaptation to low yielding environments. Other genotypes like G4, G5, G10 and G11had closer to unity; therefore, these genotypes had average responsiveness, and this result was in line with the findings of Firew (2003) in common bean.
Cultivar superiority measure (Pi) of Lin and Binns model
Lin and Binns (1988) stability measure by superiority index (Pi) defined as the deviation of the ith cultivar relative to the genotype with maximum performance in each environment. The superior genotype would be the one with the lowest (Pi) value, that one which remained among the most productive in a given set of environments. The ranks of the (Pi) measure with mean seed yield (kg ha-1) was given in (Table 7).
According to this model, the most stable genotypes with the lowest Pi were G5, G12 and G9 which ranked 1st, 4th and 2nd in mean seed yield (kg ha-1). These stable genotypes had least contribution to the total variation due to GEI for seed yield. The most unstable were G2, G11 and G10 they ranked 12th, 11th and 10th for mean seed yield (kg ha-1). These unstable genotypes contributed a large portion of the total variation of GEI for the seed yield (kg ha-1). The most productive genotypes tended to be the most stable and hence (Pi) indicates the performance of the genotypes not actually an indication of stability. Similar results were reported by Lin and Binns (1988), Perreira et al. (2009) in bean, (Molla (2010) in finger millet and Nigussie (2012) in common bean.
AMMI analysis
The AMMI analysis of variance of seed yield (kg ha-1) of twelve sesame genotypes tested at eight environments were presented in Tables 8. The result revealed that sesame genotypes were significantly (P<0.01) affected by environments (E), and GEI. The large sum of squares for environments indicated that the environments had different response for genotypes. From the total variation (Table 9), environment had taken the major share (51.15%), followed by GEI (31.87%), genotypes (12.91%), error (3.60%) and replications (0.47%). The larger portion of the sums of squares was contributed by environment and GEI to the total sums of squares as compared to the genotypes, indicated great influence of those environments on sesame production in eastern Amhara sesame growing areas, that means there is a significant different between locations and genotypes, and also genotypes showed rank changed in the two years data. The result indicating that, the breeding strategy should be based on the performance of the genotypes instead focusing stable or specific variety development. The investigation was in agreement with the findings of Adugna and Labuschagne (2002) and Adane (2008) in linseed.
The magnitudes of the GEI sum of squares were 2.5 times of the genotypes sum of squares for seed yield (kg ha-1), indicating that there were substantial genotypic responses across environments. The AMMI1 model, the Interaction Principal Component Axes (IPCA1 and IPCA2) showed highly significant (P < 0.01) and explained 42.94 and 31.75% totally accounted 74.69% for seed yield of the GEI variation, using 17 and 15 degrees of freedom (32) from the total of 77 degrees of freedom available for the interaction.
Though, the higher interaction principal component axes (IPCA3 to IPCA6) of the interactions were significant for the model, the prediction assessment indicated that AMMI 1 with only two interaction principal component axes were the best predictive (Zobel et al., 1988). Further interaction principal component axes captured mostly noise and therefore, did not help to predict validate observations. This result was in harmony with the results of Molla (2010) in finger millet and Nigussie (2012) in common bean.
Partitioning of the total variances of oil content indicated that environment 25.59% (25.29), genotypes 28.10% (27.77), GEI 25.71% (26.23), replications within environment 1.67% (1.64) and error 12.49% (12.65) had contributed (Table 10). The contribution of sums of squares due to environment and GEI were relatively lower than the contribution of sums of squares due to genotypes on oil content as compared to seed yield (kg ha-1), indicated that environment and GEI influence on oil content were not as large as their influence on seed yield (kg ha-1) (Table 9). Similar result was also reported by Adane (2008) in linseed.\
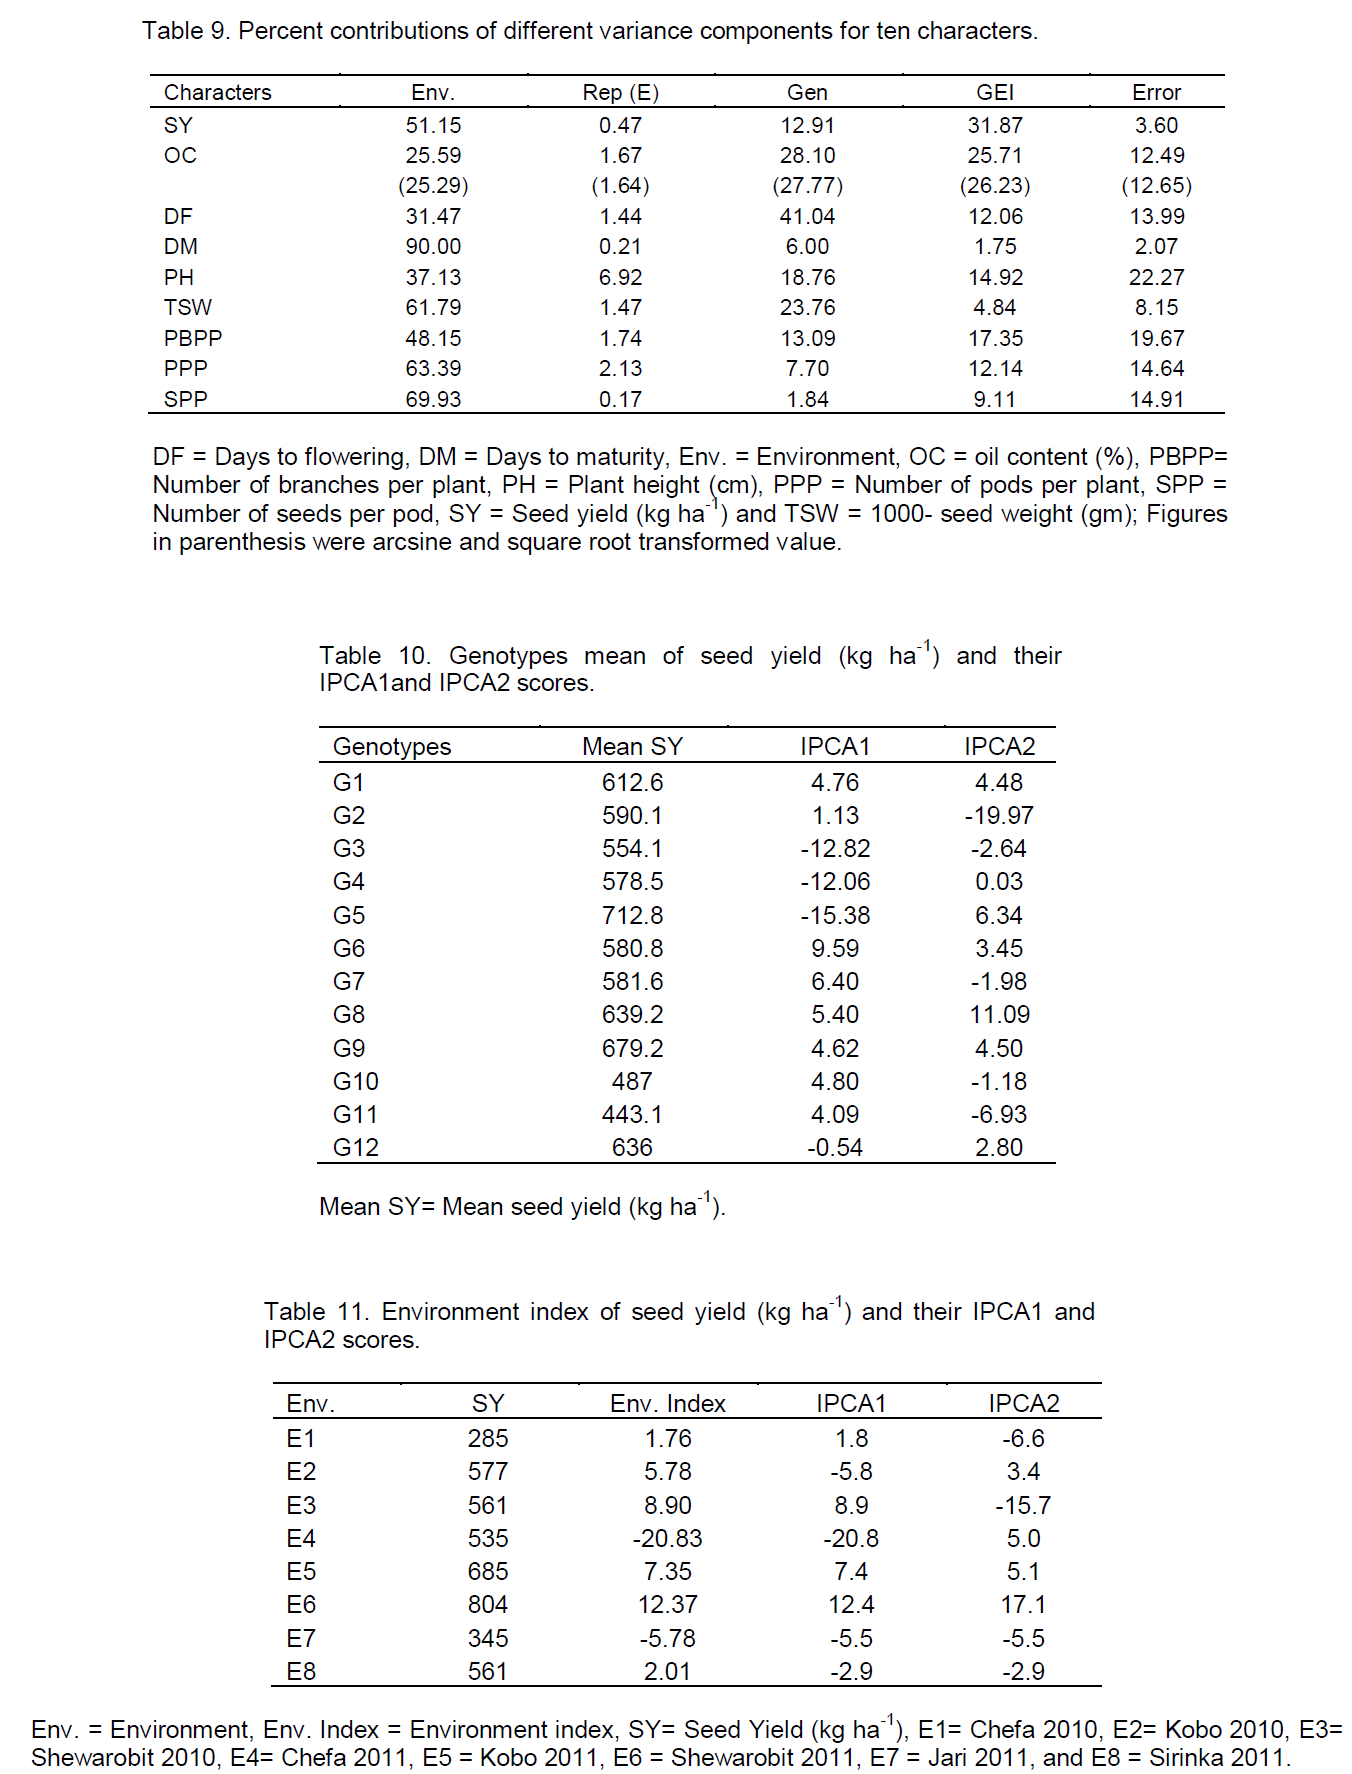
In other agronomic traits, environment accounted for larger share of total sums of squares. It accounted for days to flowering 31.47%, for days to maturity 90.00%, for number of primary branches per plant 48.15%, for number of pods per plant 63.39%, for plant height (cm) 37.13%, for number of seeds per pod 69.93% and for thousand seeds weight (g). GEI contribution was higher than that of genotypes for most of the traits and had great influence on sesame seed yield (kg ha-1) production, similar result was reported by Zenebe and Hussien (2009) in sesame.
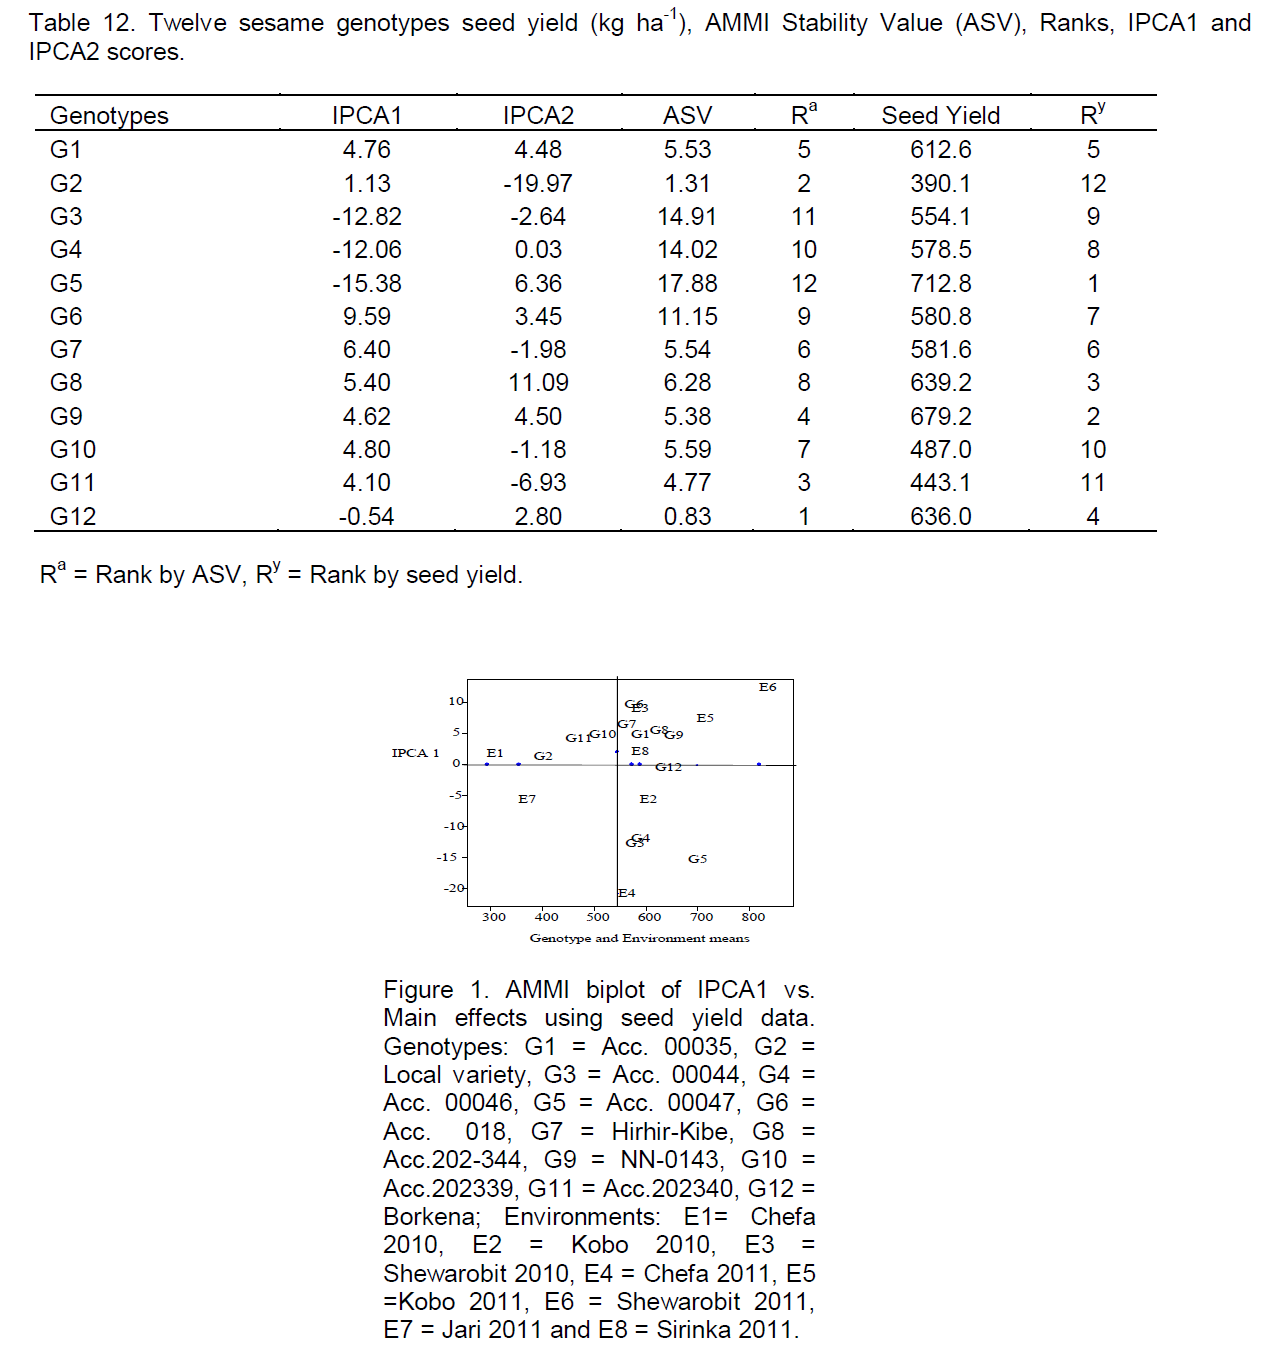
The IPCA scores of the genotype in the AMMI analysis is an indication of the genotype adaptability over environments and association between genotypes and environments (Gauch and Zobel, 1996). The first and the second IPCA scores of genotypes of seed yield (kg ha-1) were given in Table 10. Regardless of the positive or negative signs, genotypes with small scores close to zero have low interaction and stable, whereas genotypes with large scores have high interactions and were unstable (Zobel et al., 1988). By considering IPCA1 alone and despite the positive or negative signs, genotypes G2 and G12 had small scores close to zero were stable; whereas genotypes G3, G4 and G5 had large IPCA1 scores far from zero were unstable, this result was agreed with the findings of Crossa (1990), Molla (2010) in finger millet and Nigussie (2012) in common bean.
As the result was shown in Table 11, based on environmental index and environmental mean seed yield values (kg ha-1), environments were classified into three groups, Kobo and Shewarobit were the most favorable (potential) environments for the production of sesame which had the largest environmental index values (5.78 and 8.90), with mean seed yield (kg ha-1) (577 and 561 kg ha-1) in 2010 cropping season and (7.35 and 12.37) with mean seed yield (kg ha-1) (685 and 804 kg ha-1) in 2011 cropping season, respectively. Sirinka had average environment with environmental index and environmental mean seed yield values (2.01 and 561 kg ha-1), respectively, whereas Chefa 2010/2011 and Jari 2011 were the most unfavorable environments since they had the smallest environmental index values (1.76, -20.83 and -5.78) with mean seed yield (285, 535 kg ha-1 and 345 kg ha-1), respectively.
Environments with larger IPCA1 scores discriminate among genotypes more than environments with lesser scores (Zobel et al., 1988; Kempton, 1984). Accordingly, Shewarobit was the most discriminating environment than the others (Table 11) and this result was in agreement with the findings of Nigussie (2012) in common bean.
Genotypes with IPCA scores near zero had little interaction across environments (the more stable genotypes) and those far along the axis had high interaction (more unstable genotypes). Genotypes and environments with the same sign on the IPCA axis had positive interaction and vice versa (Zobel et al., 1988) (Table 11).
AMMI stability value (ASV)
The AMMI model does not provide a measure of quantitative stability. But quantitative stability measure is essential in order to quantify and rank genotypes according to yield stability. For this reason ASV was proposed by Purchase (1997). In this model, genotypes with least ASV were considered the most stable, whereas those which had highest ASV were considered unstable (Purchase, 1997). According to this model, genotypes with their seed yield (kg ha-1) G12, G2 and G11 were stable, whereas genotypes G5, G3 and G4 were unstable (Table 12); similar result was reported by Adane (2008) in linseed.
In the AMMI model I biplot, the plot was helpful to visualizing the average productivity of the genotypes, environments, and their interaction for all possible genotype x environment combinations (Yan and Hunt, 1998). The AMMI1 biplot for seed yield (kg ha-1) of twelve genotypes at eight environments presented in Figure 1 showed that Shewarobit and Kobo were potential and favorable environments; Sirinka was an average, while Chefa and Jari were unfavorable environments for sesame production and also Shewarobit and Chefa were the most discriminating environments, while Local variety and genotype Acc.00047 were the most responsive genotypes.
Comparison of stability parameters
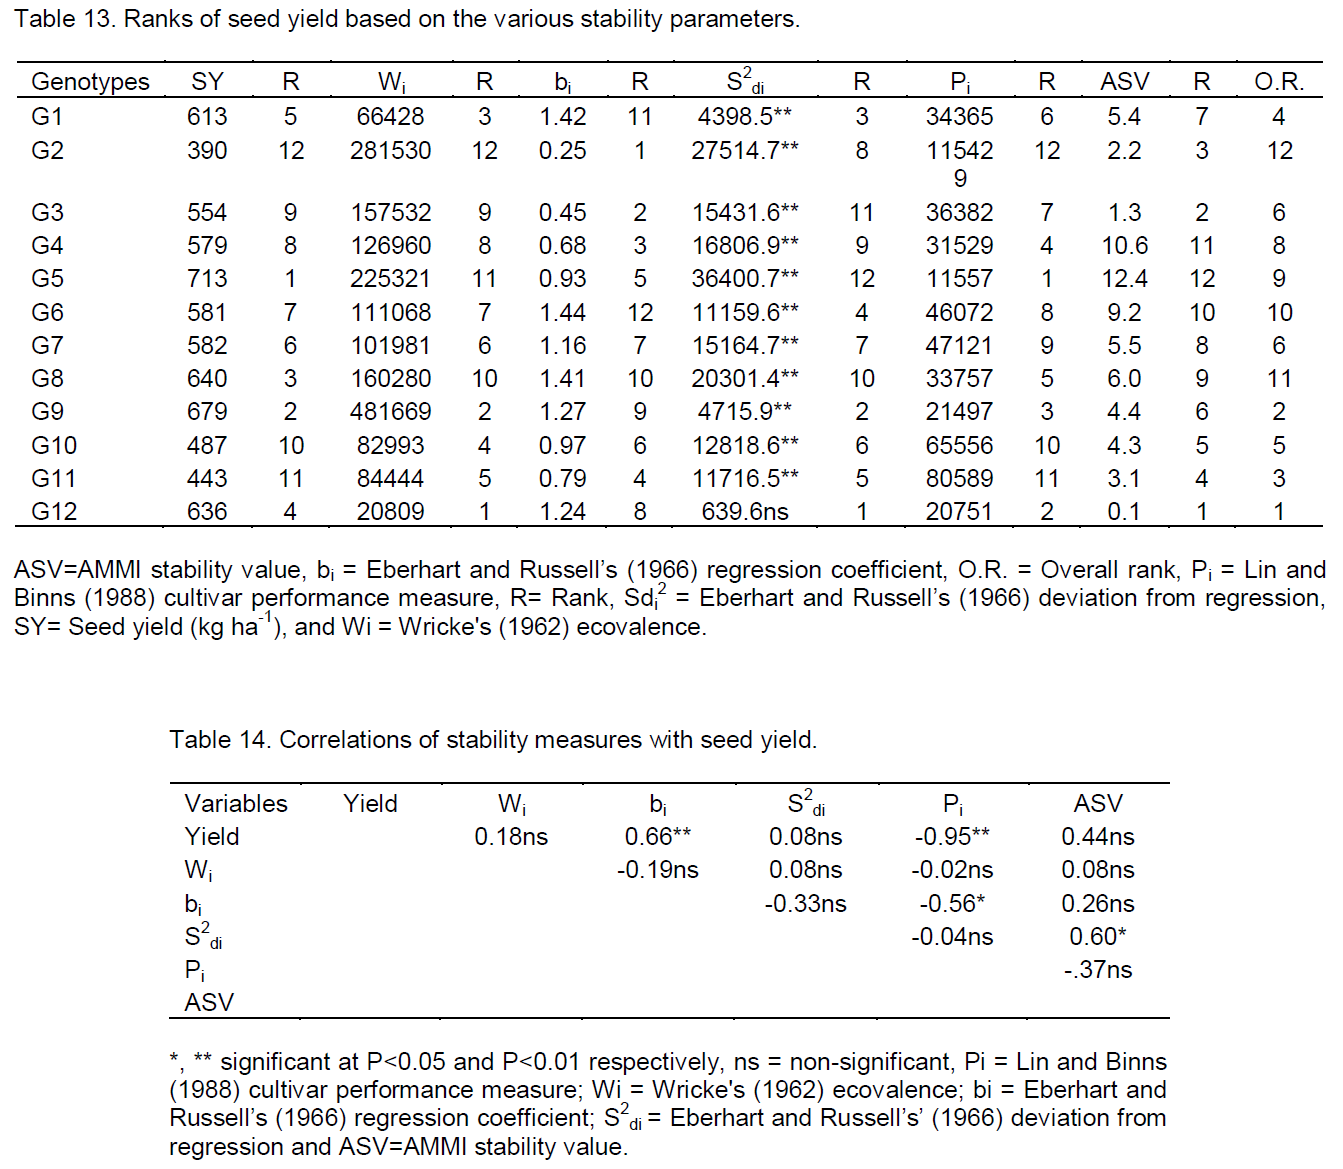
Different stability parameters were used to compare the stability and ranking of sesame genotypes. Although there was change in ranking order of genotypes from one stability parameter to another, based on the information (Table 13), genotypes G12, G9 and G1 with mean seed yield of 639, 679 and 613 kg ha-1 were found stable by stability parameters Wricke’s (1962) ecovalence and deviation from regression (Eberhart and Russell, 1966). These genotypes had high buffering capacity to environmental changes such as diseases and drought (Becker and Leon, 1988), while G2, G8 and G6 with mean seed yield of 390, 639 and 580.8 kg ha-1 respectively were unstable. This result was in agreement with the findings of Alberts (2004) in maize, Muluken (2007) in malt barley and Nigussie (2012) in common bean.
The fourth and second high yielder genotypes, G12 and G9 were the first and the second stable by most of the stability measures with mean seed yield of 639 and 679 kg ha-1, respectively. The highest seed yielder genotype (G5) with mean seed yield (712. 8 kg ha-1) was the most unstable except by the stability parameter cultivar superiority performance (Pi) (Lin and Binns, 1988) where it appeared as 1st stable cultivar (Table 8).
This genotype had the highest value of ASV in seed yield (kg ha-1) (Table 13). The high yielder genotypes had high ASV value and were positively correlated; this result was similar to the works of Carbonell et al. (2004) and Perreira et al. (2009) in bean.
Although, most of the genotypes showed inconsistency in ranking for stability measures, when compared on overall ranking, genotype G12 ranked 1st in stability parameter Wi, S2di and ASV; 2nd in Pi and it was found at the origin in the AMMI 1 biplot and genotype G9 was 2nd rank in stability parameter Wi, S2di ; 3rd in Pi and it was found relatively near the origin in the AMMI 1 biplot.
Yield stability is an important issue in cultivar testing and selection, but stability is meaningful for cultivar evaluation only when the genotypes are comparable in average yield. Stability alone is meaningless, that means a less stable cultivar that performs well on average is better than a cultivar that stable and performs consistently poor (Weikai, 1999), hence, G12 and G9: 4th and 2nd in their seed yield, respectively were 1st and 2nd stable genotypes and thus they could be grown in wide environments. Similar results were identified by Adugna and Labuschagne (2002) in linseed, Abou El-Nasr et al. (2006) in mustard, Gunasekera et al. (2006) in Indian mustard and Hariprasanna et al. (2008) in groundnut.
Duarte and Zimerman (1995) suggested that phenotypic stability should not be restricted to one method but personalized to the stability type of interest to the individual researcher. Inconsistency in ranking using a univariate approach was previously suggested to be difficult to reconcile into a unified conclusion by Lin et al. (1986). According to them, the basic reason for the difficulty is that a genotype’s response to environments is multivariate. This problem has been overcome by using the AMMI model (Alberts, 2004; Adugna, 2007). Since it has a power of measuring the magnitude of the sums of squares of environments, GEI and genotypes, evaluate multivariate responses of the genotypes and also shows the potential and poor environments; high and low yielder as well as stable and unstable genotypes on the same biplot graph, that means AMMI model is the best model of the others for this study.
Correlation of stability parameters
The correlation of different stability parameters was determined using General statistics (GenStat) program version 13 (Payne et al., 2006) for each of the possible pair wise comparisons of the ranks for the seed yield (kg ha-1) (Table 14). The only regression coefficient (bi) had highly significant positive rank correlation with seed yield with (r=0.66), the high correlation mean seed yield and regression coefficient (bi) was expected as the value of this statistic was higher for high yielding genotypes, this result was in agreement with the findings of Molla (2010).
Lin and Binns (Pi) method showed a highly significant negative rank correlation (r = - 0.95) with seed yield, indicated that, high yielding and responsive genotypes like G5 had a tendency to lower Pi value, this result was in agreement with the works of Nigussie (2012) in common bean, but disagreed with the result of Molla (2010) in finger millet.
On the other hand, stability parameters (Wi, S2di and ASV) had non-significant correlation (r=0.18, 0.08 and 0.44) with seed yield. The non-significant correlation among yield and stability parameters indicated that, information cannot be collected from average yield alone (Duarte and Zimermann, 1995) in common bean. S2di was positively significant correlated with Wi and ASV indicating that they can measure similar aspects of stability which in harmony with the work of Firew (2003). Therefore, it is possible to use only one of them as a measure of biological stability.