ABSTRACT
Research was conducted in Malawi and Tanzania to determine cowpea (Vigna unguiculata L. Walp) grain yield responses to applied P and K, the agronomic and economic efficiency of nutrient application, and the importance of other nutrient deficiencies. Nine site-years of research were conducted. Cowpea did not respond to fertilizer P and K in Malawi. In Tanzania, the yield response to applied P was linear with 21 kg of grain yield increase per kg of P applied. Overall, the effect of P applied at the economically optimal rate (EOR) were mean cowpea grain yield increases and profit to cost ratios (PCR), respectively, of 0.47 Mg ha-1 and 3.2 in Tanzania. Similar effects for K application in Tanzania with an EOR of 17 kg ha-1 were 0.264 Mg ha-1 yield gain and a PCR of 2.3. There were no responses to application of Mg, S, Zn and B. Financially constrained farmers are often not able to apply fertilizer at EOR for all of their cropland. The mean effect of applying K in Tanzania at 50% compared with 100% of EOR to twice as much land was 35% more production increase and 52% more PCR. The results indicate the importance of adequate availability to farmers of straight P and K fertilizers for farmer profitability. Use of multi-nutrient fertilizers implies paying for nutrients that will not give a yield response, thereby reducing the profit potential.
Key words: Economically optimal rate, net return to fertilizer, optimization, phosphorus, potassium, response functions.
Cowpea (Vigna unguiculata L. Walp) is important in sub-Saharan Africa (SSA) as a crop rotated or intercropped with non-legumes for food protein and micro-nutrients (Gibson and Ferguson, 2008) and income earnings. The average 2012 and 2013 annual production (Mg yr-1) and grain yield (Mg ha-1) for cowpea, respectively, were: 118,300 and 0.54 for Kenya; 33,400 and 0.46 for Malawi; 82,800 and 1.15 for Uganda; and 182,300 and 0.82 for Tanzania (Food and Agriculture Organization Statistics (FAOSTAT), 2016). Cowpea is primarily a crop of smallholder farmers grown with little control of biotic and abiotic production constraints. Yield is often constrained by inadequate nutrient availability (Osodeke, 2005; Woomer et al., 2012; Olaleye et al., 2012) but numerous other abiotic and biotic constraints and inadequate management also contribute to low yields and to low responses to applied inputs as was determined for bean (Phaseolus vulgaris L.) (Wortmann et al., 1998). Little fertilizer is applied for cowpea production (Chianu et al., 2011) while mean fertilizer use across all crops is only about 27 kg ha-1 in Malawi and 8 kg ha-1 in Tanzania (Walters, 2007). Cowpea is an especially important pulse in semi-arid regions of Sub-Saharan Africa (Ajeigbe et al., 2012; Dube and Fanadzo, 2013; Maman et al., 2017). The leaves and grain are important foods with protein contents of 27-43% in leaves and 21-33% in grain (Ddamulira et al., 2015; Abudulai et al., 2016). It is also used as a livestock fodder in West Africa and can account for more than 40% of the value of the crop in the Sahel (Kamara et al., 2012; Maman et al., 2017). Cowpea can have high levels of biological N fixation and is relatively tolerant of soil water deficits with wide adaptation (Bisikwa et al., 2014; Ddamulira et al., 2015). Great profitability from fertilizer use decisions based on robust response functions is likely to be essential for great increases in fertilizer use (Kaizzi et al., 2017; Nalivata et al., 2017; Senkoro et al., 2017). Applying nutrients at the steep part of response functions can offer great profit opportunity in situations of financially constrained fertilizer use while application at the economically optimal rate (EOR) to maximize net returns ha-1 from fertilizer use is important when fertilizer use is adequately financed (Jansen et al., 2013). Some information from past research can be considered along with current results in determination of nutrient response functions (http://agronomy.unl.edu/OFRA). Cowpea responses to applied nutrients have included mean cowpea grain yield increases of 0 and 0.24 Mg ha-1 due to 10 kg ha-1 N without and with P uniformly applied, respectively (Agboola, 1978; Buerkert et al., 1997), and 0.19 Mg ha-1 mean increase due to 10 kg ha-1 P alone applied (Magani and Kuchinda, 1997; Ndor et al., 2012: Nyoki and Ndakidemi, 2013). Maman et al. (2017) found that cowpea response to P added greatly to fertilizer use profitability for pearl millet-cowpea intercropping. They also established a basis for determining intercrop response functions from pearl millet sole crop information. Determination of robust crop nutrient response functions is important to improving the profitability of fertilizer use for cowpea sole crop production in SSA. The objectives of this research were to determine for cowpea production areas of Malawi and Tanzania the grain yield responses to applied P and K, the agronomy and economic efficiency of applied P and K, and the importance of applied Mg, S, Zn and B to yield.
Study field trial sites
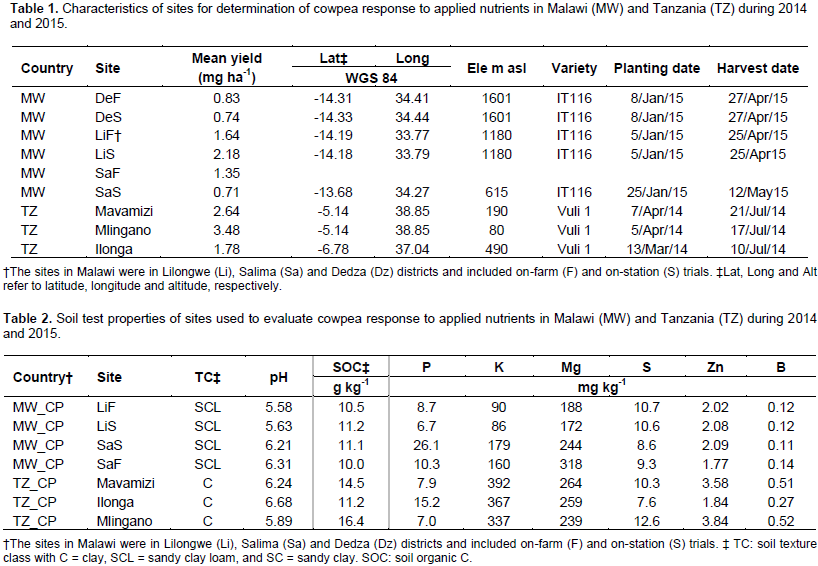
Nine site-yr of research for cowpea were conducted across diverse growing conditions for determination of response to applied nutrients (Tables 1 and 2). The spans of coverage included 9° latitude, 1500 m elevation, 5.6 to 6.7 soil pH, 10 to 16 g kg-1 soil organic C, 7 to 26 mg kg-1 Mehlich 3 P, and 86 to 390 mg kg-1 K. This research was conducted as part of an alliance of 13 nations in SSA under the Optimization of Fertilizer Recommendations in Africa (OFRA) project (Kaizzi et al., 2017). In central Malawi, trials were conducted in the Salima, Lilongwe and Dedza areas (Tables 1 and 2). The Dedza trials had Hapic Lixisol soils and a sub-humid climate with mean monthly minimum and maximum temperatures of 9 to 16 and 20 to 26°C. The Lilongwe trials had Hapic Lixisol soil and a sub-humid climate with mean monthly minimum and maximum temperatures of 8 to 17 and 24 to 30°C, respectively. The Salima on-farm trials had Lithic Leptosol soil and the on-station trials had Eutric Fluvisol soil with a semi-arid climate with respective mean monthly minimum and maximum temperatures of 16 to 22 and 26 to 33°C. The rainfall distribution for each area was uni-modal with 94, 90 and 90% of the rainfall for Salima, Lilongwe and Dedza, respectively, occurring during December to June. Soil properties ranged from 5.4 to 6.4 pH, 9 to 17 g kg-1 soil organic C, and 7 to 26 mg kg-1 Mehlich 3 P. In eastern Tanzania, cowpea trials were conducted on clay soils at Ilonga with a Eutric Fluvisol, Mavamizi with a Ferralitic Cambisol, and Mlingano with a Ferralitic Cambisol (Tables 1 and 2). Mavamizi and Mlingano have a mean of about 1280 mm yr-1 precipitation with 46 and 38% occurring during March to June and September to December. Rainfall for Ilonga was about 975 mm yr-1 precipitation with 90% occurring during November to May. The mean monthly minimum and maximum temperatures (°C) range respectively from approximately: 15 to 21 and 28 to 32 for Ilonga; and 18 to 22 and 27 to 33 for Mavimizi and Mlingano. Soil properties for the Tanzania sites ranged from 5.9 to 7.7 pH, 11 to 17 g kg-1 soil organic C, and 7 to 20 mg kg-1 Mehlich 3 P.
Experimental design and agronomic practice
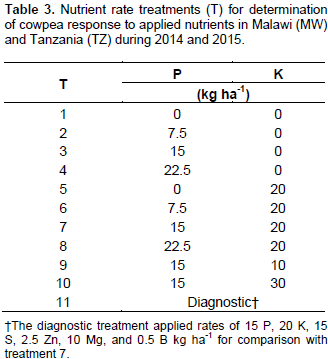
There were 11 nutrient rate treatments with 4 P levels in 7.5 kg ha-1 increments evaluated with 0 and 20 kg ha-1 K uniformly applied, and four K levels in 10 kg ha-1 increments evaluated with 15 kg ha-1 P uniformly applied (Table 3). The trials in Tanzania also had a diagnostic treatment to test for yield response to Mg, S, Zn, and B. The on-station trials had three replications. The on-farm trials had at least six replications with each replication in the field of another farm. Trials had a randomized complete block design. Plot size was six rows wide and 6 m long. The nutrient sources were triple super phosphate for P, KCl for K, magnesium sulfate for Mg and S, zinc sulfate for Zn and S, and borax for B. All of the P, K, and the diagnostic package were applied at planting time. The land for all sites was tilled before planting but the tillage practice varied. Ridges were formed in Malawi and seed was planting into the top of the ridge but planting was on flat soil in Tanzania. The cowpea varieties were IT116 of 68 days to maturity in Malawi and Vuli 1 in Tanzania of 65 days to maturity (Table 1). Row spacing was 0.5 m. The intended plant spacing was 15 cm. Weed control was by hand hoeing. In Malawi and Tanzania, insect pest control involved spraying the crops with cypermethrine ([cyano-(3-phenoxyphenyl)methyl] 3-(2,2-dichloroethenyl)-2,2-dimethylcyclopropane-1-carboxylate). Copper oxychloride (Cl2Cu2H3O3-) fungicide was applied to control fungal diseases.
Data collection and analysis
Soil samples composed of soil from at least eight sampling points per replication were collected before tillage. The samples were air-dried, sieved through a 2-mm sieve and analyzed for particle size distribution, pH, organic C (OC), and exchangeable K, Ca, Mg, Zn, S and B were analyzed at the World Agroforestry Centre in Nairobi Kenya. Upper fully expanded leaves of an N-P-K treatment were sampled at flowering in Tanzania and analyzed for N, P, K, Ca, Mg, S, Fe, Cu, Mn, Zn, B, and M at the same laboratory. Analyses were with a combination of wet chemistry and mid-infrared scanning methods (Shepherd and Walsh, 2007; Terhoeven-Urselmans et al., 2010; Towett et al.. 2015;
https://www.worldagroforestry.org/sd/landhealth/soil-plant-spectral-diagnostics-laboratory/sops). Harvest for yield determination was by uprooting the plants from the two inner rows, removing the pods and air-drying before shelling. The harvested grain was weighed and air-dried grain yield calculated. To determine grain water content, grain was tested with a Dickey-John Tester in Tanzania. In Malawi, 100 kernels were dried in an oven at 70 – 80°C for 24 h for water content determination. The collected data were used to calculate: grain yield at 850 g kg
-1 moisture; agronomic efficiency (AE), or the gain in grain yield per kg of P and K (kg kg
-1); and economically optimum rates (EOR), that is, the rate to maximize net returns per ha. The profit to cost ratio (PCR) was calculated as the ratio of the net returns due to the nutrient application relative to the cost of that nutrient application. Economic calculations were done with differing fertilizer use costs relative to grain value. These ratios of nutrient application cost to grain value (CP) ranged from 3 to 7 kg kg
-1. Analysis of variance (ANOVA) combined across site-yr (SY) within countries were conducted to determine treatment and interaction effects on grain yield. The P × K interaction was evaluated by conducting ANOVA on the sub-set of eight treatments when treatment effects were significant. The K rate and diagnostic treatment effects were tested using orthogonal contrasts. Effects were considered significant when P ≤ 0.05. Asymptotic regression was fitted to the data for yield response to applied nutrients. The asymptotic function was given as yield (Mg ha
–1) y =
a–
bcr, where
a was yield at the plateau due to application of that nutrient,
b was the maximum gain in yield due to application of that nutrient,
c was a curvature coefficient, and
r was the nutrient rate. When the asymptotic function failed to give a realistic convergence, linear functions were attempted.
The mean cowpea grain yield was 2.63 Mg ha-1 in Tanzania and 1.29 Mg ha-1 in Malawi (Table 1). Grain yield was on average 0.15 Mg ha-1 less with the diagnostic treatment compared with the similar P-K treatment in Tanzania, but the diagnostic treatment effect was not significant in the overall analysis or for any location. The diagnostic treatment was not included for the Malawi trials. In Tanzania, grain yield was not affected by the P × K interaction but P effects differed by location with no P effect at Ilonga and with linear P effects of differing slopes at Mavamizi and Mlingano, along with a linear effect overall (Table 4). The application of K had a curvilinear to plateau effect on grain yield overall in Tanzania. The overall EOR for P due to linear effect of P was inferred to be 22.5 kg ha-1 as the highest rate evaluated (Figure 1), with the AE of P use equal to 21 kg kg-1 and the PCR with CP = 5 equal to 3.2 kg kg-1. The EOR of K ranged from 14 to 20 kg ha-1 for CP 7 to 3. With CP of 5, the EOR of K was 16 kg ha-1 with a yield gain of 0.263 Mg ha-1, an AE of 16.5 kg kg-1, and a PCR of 2.30 kg kg-1. The equation for Tanzania to calculate EOR of K from CP was EOR = 29.0 – 3.6CP + 0.21CP2. In Malawi, the only treatment effect on grain yield was negative for K application with the on-station trial at Dedza according to Yield = 1.10 – 0.021K, R2 = 0.92.

Diagnosis of nutrient deficiencies requires consideration of information from multiple sources but crop response to applied nutrients is the strongest indicator of deficiency. Grain yield was not increased by the diagnostic treatment containing Mg, S, Zn and B for the six trials that included the diagnostic treatment. Soil test results indicated adequate availability of Mg, S, Zn and B for all trial sites. For foliar samples collected in Tanzania, the minimum, maximum and median foliar nutrient concentrations were: 3.2, 3.5 and 3.3 g kg-1 for Mg; 2.6, 3.3 and 2.7 g kg-1 for S; 35, 51 and 36 mg kg-1 for Zn; and 19, 36 and 33 mg kg-1 for B, respectively. The critical levels for deficiency used by OFRA in interpretation of cowpea foliar test results have been 2.5 and 2.0 g kg-1 for Mg and S, and 20 and 15 mg kg-1 for Zn and B, respectively. According to these critical levels, the foliar results indicate that the plants were not deficient for Mg, S, Zn and B. Cowpea yield responses to applied P in Malawi and Tanzania were not related to Mehlich 3 P even though it was < 15 mg kg-1 in five of seven cases (Tables 2, 3, 4). There was a positive yield response to K in Tanzania but not in Malawi even though soil test values were overall higher in Tanzania. The results demonstrate good profit potential for P and K applied at EOR to cowpea in Tanzania but not in Malawi (Figure 1). However, financially constrained smallholders are seldom able to buy enough fertilizer to apply at EOR to all of their cropland and expect higher PCR by applying at less than EOR without great losses in production potential. An exception is for the linear response to P in Tanzania where PCR was constant across P rates to the maximum applied rate of 22.5 kg ha-1 P. Estimated yield gains and PCR with 100 and 50% of EOR were: 0.264 and 0.198 Mg ha-1 and 2.3 and 3.9 $ $-1 for K in Tanzania.

These comparisons indicate that, with curvilinear to plateau responses, the effect of nutrients applied at 50% compared with 100% EOR were about 22% less yield gain but 88% more PCR. Therefore, the greatly improved PCR with 50% compared with 100% EOR while applying the affordable amount of fertilizer to twice as much cropland presents an opportunity for smallholders to improve their total production and profit, and eventually gain the financial ability to apply fertilizer at EOR to cropland. Maximizing profit potential of fertilizer use is relatively easy for situations where fertilizer use is not financially constrained as farmers apply at EOR to all crops in consideration of the current CP for each crop-nutrient combination. However, the resource poor farmer needs to consider more than the profit potential of a single nutrient applied to a single crop. For example, P compared with K applied to cowpea in Tanzania has higher PCR. The PCR is generally greater with rates of less than 100% of EOR. Other crops in the system also have PCR associated with the diverse feasible crop-nutrient-rate combinations. Profit maximization is expected with the affordable fertilizer allocated to the highest PCR opportunities. Consideration of all potential permutations, especially with more than three crops in the system requires advanced calculations such was through use of linear optimization (Jansen et al., 2013; Kaizzi et al., 2017). Under OFRA, a dataset of >5950 geo-referenced nutrient functions was developed from results of past and OFRA-supported field research. Using the OFRA Inference Tool (Wortmann et al., 2017) for spatial transfer of results, fertilizer use optimization tools were developed for 67 recommendation zones, each able to consider the nutrient needs of up to nine crops or intercrops. These and other OFRA resources are freely available at http://agronomy.unl.edu/OFRA.

Fertilizer P and K can be profitably applied at EOR for cowpea production in Tanzania but not in Malawi. The available information from crop response, soil test, and available foliar test results indicate that deficiencies of Mg, S, Zn and B are not of concern for cowpea production in Malawi and Tanzania. Farmers whose fertilizer use is financially constrained can greatly improve net returns on their investment by applying fertilizer at less than EOR but over more land. The mean effects of applying the same amount of fertilizer nutrients at 50% compared with 100% EOR include 56% more production and 88% more PCR. Farmers are likely to have more profit potential from use of straight fertilizers such as triple super phosphate by avoiding the cost of nutrients in fertilizer mixes for which there is no response.
The authors have not declared any conflict of interests.
The authors are thankful to the Alliance for Green Revolution in Africa (AGRA), CABI, the University of Nebraska-Lincoln, and the Governments of Malawi, Kenya and Tanzania for supporting the research work. The contributions of research support staff, research center management, and cooperating farmers were essential to the success of this research.
REFERENCES
|
Abudulai M, Seini SS, Haruna M, Mohammed AM, Asante SK (2016). Farmer participatory pest management evaluations and variety selection in diagnostic farmer field Fora in cowpea in Ghana. African Journal of Agricultural Research, 11:1765-1771.
Crossref
|
|
|
|
Ajeigbe HA, Saidou AK, Singh BB, Hide O, Satoshi T (2012). Potentials for cowpea (Vigna unguiculata) for dry season grain and fodder production in the Sudan and Sahel zones of West Africa. In: Boukar O, Coulibaly O, Fatokun CA, Lopez K, Tamo M editors. Innovative Research Along the Cowpea Value Chain. Proc. 5th World Cowpea Conf., Saly, Senegal. International Institute of Tropical Agriculture (IITA), Ibadan, Nigeria, pp. 189-202.
|
|
|
|
|
Bisikwa J, Kawooya R, Ssebuliba JM, Ddungu SP, Biruma M, Okello DK (2014). Effects of plant density on the performance of local and elite cowpea varieties in Eastern Uganda. African Journal of Applied Agricultural Sciences and Technologies, 1:28-41.
|
|
|
|
|
Chianu JN, Nkonya EM, Mairura FS, Chianu JN, Akinnifesi FK (2011). Biological nitrogen fixation and socioeconomic factors for legume production in sub-Saharan Africa: a review. Agronomy for Sustainable Development, 31: 139–154.
Crossref
|
|
|
|
|
Ddamulira G, Santos CAF, Obuo P, Alanyo M, Lwanga CK (2015). Grain yield and protein content of Brazilian cowpea genotypes under diverse Ugandan environments. American Journal of Plant Sciences, 6:2074-2084.
Crossref
|
|
|
|
|
Dube E, Fanadzo M (2013). Maximizing yield benefits from dual-purpose cowpea. Food security, 5:769-779.
Crossref
|
|
|
|
|
Food and Agriculture Organization Corporate Statistical Database FAOSTAT (2016). Food and Agriculture Organization of the United Nations Statistics Division Available at: http://faostat3.fao.org/download/Q/QC/E. Accessed March 2018.
|
|
|
|
|
Gibson R, Ferguson E (2008). An interactive 24-hour recall for assessing the adequacy of iron and zinc intakes of developing countries. Tech. Monog. 8. HarvestPlus, Washington DC, USA.
|
|
|
|
|
Jansen JA, Wortmann CS, Stockton MA, Kaizzi KC (2013). Maximizing net returns to financially constrained fertilizer use. Agronomy Journal, 105:573-578.
Crossref
|
|
|
|
|
Kamara AY, Ewansiha SU, Ajeigbe HA, Okechukwu R, Tefera H, Boukar O, Omoigui LO (2012). Improvement in grain and fodder yield of cowpea (Vigna unguiculata) varieties in the Sudan savannas of Nigeria over the past four decades. In: Boukar O, Coulibaly O, Fatokun CA, Lopez K, Tamo M editors. Innovative Research Along the Cowpepa Value Chain. Proc. 5th World Cowpea Conf., Saly, Senegal. International Institute of Tropical Agriculture (IITA), Ibadan, Nigeria. Crop Science, pp. 179-188.
|
|
|
|
|
Kaizzi CK, Mohammed MB, Maman N (2017). Fertilizer use optimization: principles and approach. In: Wortmann CS, Sones K. Editors. Fertilizer Use Optimization in Sub-Saharan Africa. CABI, London, UK pp. 9-19.
Crossref
|
|
|
|
|
Magani IE, Kuchinda CM (1997). Effect of phosphorus fertilizer on growth, yield and crude protein content of cowpea (Vigna unguiculata [L.] Walp) in Nigeria. Journal of Applied Biosciences, 23:1387-139.
|
|
|
|
|
Maman N, Garba M, Wortmann CS (2017). Optimizing fertilizer use within the context of integrated soil fertility management in Niger. In: Wortmann CS, Sones K. Editors. Fertilizer Use Optimization in Sub-Saharan Africa. CABI, London, UK. pp 136-147.
|
|
|
|
|
Nalivata PC, Munthali Mw, Makumba WI, Mbewe E, Manase H (2017). Optimizing fertilizer use within the context of integrated soil fertility management in Malawi. In: Wortmann CS, Sones K. Editors. Fertilizer Use Optimization in Sub-Saharan Africa. CABI, London, UK pp. 113-124.
|
|
|
|
|
Ndor E, Dauda NS, Abimuku EO, Azagaku DE, Anzaku H (2012). Effect of phosphorus fertilizer and spacing on growth, nodulation count and yield of cowpea (Vigna unguiculata (L) Walp) in Southern Guinea Savanna agroecological zone. Nigeria. Asian Journal of Agricultural Sciences, 4:254-257.
|
|
|
|
|
Nyoki D, Ndakidemi PA (2013). Economic benefits of Bradyrhizobium japonicum inoculation and phosphorus supplementation in cowpea (Vigna unguiculata (L) Walp) grown in northern Tanzania. American Journal of Research Communication, 1:173-189.
|
|
|
|
|
Olaleye O, Fagbola O, Abaidoo RC, Ikeorah N (2012). Phosphorus response efficiency in cowpea genotypes. American Journal of Research Communication, 4:1:81-90.
|
|
|
|
|
Osodeke VE (2005). Determination of phosphorus requirements of cowpea (Vigna unguiculata) in the acid soils of south-eastern Nigeria using sorption isotherms. Global Journal of Agricultural Sciences, 4:135-138.
|
|
|
|
|
Senkoro CJ, Ley GJ, Marandu AE, Wortmann C, Mzimbiri M, Msaky J, Umbwe R, Lyimo SD (2017). Optimizing fertilizer use within the context of integrated soil fertility management in Tanzania. In: Wortmann CS, Sones K. Editors. Fertilizer Use Optimization in Sub-Saharan Africa. CABI, London, UK. pp. 176-192.
Crossref
|
|
|
|
|
Shepherd KD, Walsh MG (2007). Infrared spectroscopy—enabling an evidence-based diagnostic surveillance approach to agricultural and environmental management in developing countries. JNIRS 15:1-19.
Crossref
|
|
|
|
|
Terhoeven-Urselmans T, Vagen TG, Spaargaren O, Shepherd KD (2010). Prediction of soil fertility properties from a globally distributed soil mid-infrared spectral library. Soil Science Society of America Journal, 74:1792-1799.
Crossref
|
|
|
|
|
Towett EK, Shepherd KD, Sila A, Aynekulu E, Cadisch G (2015). Mid-infrared and total x-ray fluorescence spectroscopy complementarity for assessment of soil properties. Soil Science Society of America Journal, 79: 1375-1385.
Crossref
|
|
|
|
|
Walters D (2007). Tanzania: The challenge of moving from subsistence to profit. Busi. Develop. OECD Journal, 8:79-102.
|
|
|
|
|
Woomer PL, Baijukya F, Turner A (2012). Progress towards achieving the vision of success of N2Africa. www.N2Africa.org. P 23.
|
|
|
|
|
Wortmann CS, Kirkby RA, Eledu CA, Allen DJ (1998). An Atlas of Common Bean (Phaseolus vulgaris L.) Production in Africa. Cali, Colombia: Centro Internacional de Agricultura Tropical.
|
|
|
|
|
Wortmann CS, Milner M, Kaizzi KC, Maman N, Cyamweshi RA, Dicko MK, Kibunja C, Macharia M, Maria R, Nalivata P, Negash D, Nkonde D, Ouattara K, Senkoro CJ, Tarfa BD, Tetteh FM (2017). Maize-nutrient response information applied across Sub-Saharan Africa. Nutrient Cycling in Agroecosystems, 107:175-186.
Crossref
|
|


