Full Length Research Paper

ABSTRACT
Agricultural production and productivity play a paramount role in the livelihood of rural farm households. Agricultural technology affects agricultural productivity and the welfare of rural farm households. However, there is a gap in knowledge on the effect of different technology adoptions on farm household’s welfare. This study examined the effect of improved wheat variety adoption on household’s welfare in Ethiopia. The study was based on cross-sectional data collected through a semi-structured questionnaire from 150 sample farm households. Double hurdle and Endogenous Switching Regression model were employed. The result indicates that the improved wheat variety adoption decision and intensity of adoption of farm households have determined by credit access, extension visits, soil fertility, plot size, off-farm employment, age of household head, distance from input market, and farm experience. The estimated model also revealed that adoption of improved wheat varieties has a positive and significant effect in enhancing farm household’s welfare. Therefore, adoption of yield-enhancing agricultural technologies should be more intensified to improve smallholder farmers’ welfare.
Key words: Adoption, double hurdle, endogenous switching regression, impact, technology.
INTRODUCTION
The agricultural sector continues to play a dominant and strategic role in the development and growth of most developing nations of the world. Most importantly, its role as a source of food, raw material and employment cannot be overemphasized. In Sub-Saharan Africa (SSA), Asia and the Pacific, the agriculture-dependent population is over 60%, while in Latin America and high-income economies the proportions are estimated to be around 18 and 4%, respectively (World Bank, 2006). Therefore, the agricultural sector brings about economic growth and development, overcome poverty and enhance food security, through an increase in productivity of smallholder farmers. To this end, increasing agricultural productivity has been an issue that development institutions and governments in the world give attention to. However, achieving agricultural productivity and growth will not be possible without developing and disseminating yield-increasing technologies. Particularly, recently it is no longer possible to meet the needs of increasing numbers of people by expanding the area under cultivation (Asfaw et al., 2012). Improved technology use has paramount importance on rural household’s crop productivity and welfare (Mekonen and Karelplein, 2014). Agricultural productivity can be enhanced through the use of improved agricultural technologies (Maertens and Barrett, 2013). It plays a significant role in fighting poverty, lowering per-unit costs of production, boosting rural incomes and reducing hunger (Kassie et al., 2011). Poor farmers could benefit from technology adoption by increasing production for home consumption and increasing gross revenue from crop sale (De Janvry and Sadoulet, 2002). In the same vein, improved agricultural technology adoption has the potential to deepen the market share of agricultural output through which the smallholder farmers’ resource use and output diversification. Increasing productivity in agriculture depends on adopting production enhancing technologies and the innovativeness of farmers (Awotide et al., 2016).
Existing literature evidenced the positive impact of technology adoption on productivity, poverty reduction and welfare across the world (Awotide et al., 2016; Nyangena and Maurice, 2014). Similarly, in Ethiopia studies revealed the positive productivity and welfare implication of improved agricultural technologies (Asfaw et al., 2012; Mekonen and Karelplein, 2014) and improve the food security of smallholder farmers (Shiferaw et al., 2014). According to Mekonen and Karelplein (2014) adoption of improved seeds and chemical fertilizer alone will increase crop productivity by 7.38 and 6.32% per year of each in Ethiopia. Despite this in Ethiopia regardless of the increasing rate of adoption and its positive impact on production and productivity, a large extent of rural farm households are under deplorable living conditions.
Recently wheat production accounted for not less than 16% of the total cereal crop area in Ethiopia. About 36% of cereal farm households are directly dependent on wheat farming in Ethiopia. However, the national average productivity of wheat is 1.83 tons/ha (CSA, 2011), and 2.7 tons/ha in 2018. Wheat production is also projected to be 2.77 tons per hectare and the total area cultivated increased to 1.66 million hectares in 2019/2020 cropping season. Despite this Ethiopia didn’t meet its domestic wheat demand. While it produces about 4.6 million metric tons every year, its consumption is beyond its production level (that is, 6.3 million metric tons per year) (Bickford, 2019). Besides the low level of productivity, there has been a growing tendency of demand for wheat both in rural and urban Ethiopia which leaves the people unable to afford for the growing demand and will aggravate the existing poverty situation in the country.
Although a number of studies revealed that extensive efforts have been taken to develop and disseminate several modern agricultural technologies, the systematic analysis of the adoption and livelihood impacts of these technologies have been scarce. Most studies in the literature have looked at the impact of cereal crops (maize, teff and sorghum) and other crops (groundnuts, pigeon peas, rice) on agricultural productivity and household welfare (Asfaw et al., 2012; Mekonen, and Karelplein, 2014; Jaleta et al., 2015; Awotide et al., 2016). Shiferaw et al. (2014) and Tesfaye et al. (2016) have tried to look at the welfare effect of improved wheat varieties in Ethiopia. Wheat is the fourth major staple food crop that the government and agricultural development institutions targeted the development and dissemination of improved wheat verities and provision of adequate seed timely and at affordable prices to farmers. Despite these efforts of the government and policymakers, much less is known about the welfare impact of wheat technology at the farm household level and the rate of adoption in Hadya Zone particularly in Misha district is very low where its welfare impact is unexplored, while the area is a wheat potential area. Therefore, the study aims to analyze the determinants of agricultural technology adoption decision, intensity and the impact of adoption on rural farm household’s welfare in Hadya Zone.
METHODOLOGY
Sampling and methods of data collection
This study was held in Misha district of Hadya zone, based on information from the Hadya zone Agriculture office. Multi-stage sampling technique was used for the representative sample selection. First, the major wheat-growing district ( Misha district) was selected purposively; second, we select five representative kebeles, out of 29 kebeles of the district where kebeles were purposively selected based on their wheat potential taken from the respective district agriculture office and finally, a representative sample of farm households was selected using simple random sampling technique. In the study, 30 households were randomly drawn from each kebele hence, a total of 150 farm households were drawn from five representative kebeles. The study used a structured questionnaire as the main data collection instrument. For data reliability and accuracy of the data collection instrument, we pre-test the questionnaire using a test-retest data reliability method and we found the coefficient of reliability 0.75, which implies the data is reliable. Alongside, the data collection was supplemented by an interview, focus group discussion and secondary data.
Analytical framework and estimation techniques
Decision and intensity of adoption of improved wheat variety
Rogers and Shoemaker (1971) defined adoption as the decision to apply innovation and to continue using it. Differences in adoption decisions are often due to the fact that farmers have different adaptive capacity, different objectives, preferences, and different socio-economic and biophysical characteristics (Shiferaw et al., 2008). In such a context, farmers’ decisions regarding the adoption of innovations can be explained using the theory which guides maximization of expected utility. Following this theory, a farmer will adopt a given new technology if the expected utility obtained from the technology exceeds that of the indigenous one.
Different researchers used different models for analyzing the determinant of technology adoption. In principle, the decisions on whether to adopt and how much to adopt can be made jointly or separately (Gebremedhi and Swinton, 2003). The Tobit model was used to analyze under the assumption that the two decisions are affected by the same set of factors (Greene, 2000). However, the decision to adopt may well precede the decision about the intensity of use and hence the explaining variables in the two stages may differ. The underlying assumption of the Tobit model is farmers demanding modern inputs have unconstrained access to the technology (Bingxin and Alejandro, 2014). Therefore, the Tobit model is inappropriate in situations where some portion of farmers are constrained to access new technology and other portions of farmers are not considering the new technology. The Heckman selection model is also another alternative model used to analyze the intensity of technology adoption. In the Heckman model, the non-adopters are considered as they will never adopt under any circumstances (Jose, 1989). Hence, Heckman selection model is restrictive in the sense that non-adopters to adopt might be encouraged to adopt for various reasons like access and improvements in extension programs and changes in input prices. On the other hand, a double hurdle model which was first proposed by Cragg (1971), assumes that non-adopters are considered as a corner solution in a utility-maximizing model (Tafesse and Sodo, 2016). DH model is the modification of the Tobit model and the Heckman model because it is more flexible. In this model, households make two separate decisions. First households decide whether to participate or not. Secondly, they decide how much they adopt. Hence, this model gives a room for factors affecting the two decisions to differ as it model the decision process in two separate steps. It also considers the possibility of zero observation in the second stage of decision which may arise from an individual’s choice or random circumstances.
Due to the above-mentioned reasons, this study adopts the double hurdle model. The first stage of this model is a probit model to analyze determinants of adoption, and the second stage is a truncated model for determinants of the level of adoption. Use of Cragg’s model for analyzing adoption and intensity of adoption is common in agricultural economic literature); (Teklewold et al., 2006; Shiferaw et al., 2008; Gebregziabher and Holden, 2011; Tsehaye, 2016; Tafesse and Sodo, 2016).
The double-hurdle model is a parametric generalization of the Tobit model, in which two separate stochastic processes determine the decision to adopt and the level of adoption of technology. The two-stage questions in a typical DH model are: i) Have you adopted improved wheat varieties Adoption decision (yes/no)? and ii) If the decision is to adopt, how many improved varieties in kg you applied given different constraints-Intensity Decision (kg/ha)? Therefore, the double-hurdle model has an adoption (D) decision with an equation:
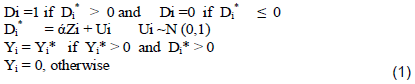
Being D* I a latent variable that takes the value 1 if a farmer use improved varieties technology and zero otherwise, Zi is a vector of household characteristics and α is a vector of parameters. This function is the probit model estimation for the adoption decision of households.

Where Y*i is the observed proportion of agricultural technologies and Xi is a vector of household socioeconomic characteristics and β is a vector of parameters. Equation 2 is estimated using truncated regression. From Equation 1 and 2, Ui and Vi are stochastic error terms, which represents omitted, yet relevant but difficult to capture variables and measurement errors. It is assumed both to be normally, identically and independently distributed. There are two thresholds that should be passed in order to observe a positive level of improved wheat varieties application. First is the adoption threshold (if the farmer has adopted improved wheat varieties), and second is a level threshold (farmer has applied a non-zero improved wheat variety). The log-likelihood function for the double-hurdle model that nests the bivariate probit model and a truncated regression model is given following Cragg (1971) by:
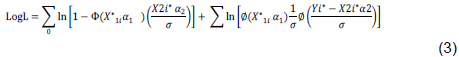
Where  refer to the standard normal probability and density functions respectively, X1i and X2i independent variables for probit and truncated model, respectively, α1 and α2 are parameters to be estimated for the two models. Assuming the independence of the error terms in the probit and truncated model, the log-likelihood function of the double hurdle model can be maximized, without loss of information, by maximizing the two components separately: the probit model (overall observations) followed by a truncated regression on the non-zero observations.
A hypothesis test for the double hurdle model against the Tobit model will be checked using the log-likelihood ratio test statistics. The likelihood ratio test statistics Γ can be computed (Greene, 2000) as Γ = -2[lnLT-(lnLP+lnLTR)] ~ 2k, where LT is the likelihood for the Tobit model; LP is the likelihood for the probit model; LTR is the likelihood for the truncated regressions model; and k is the number of independent variables in the equations. If the test hypothesis is written as: 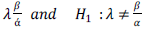 and H0 is rejected on a pre-specified significance level, provided Γ >2k, it is a confirmation to the superiority of the double-hurdle specification over the Tobit model. It is in such a case, the decision for improved varieties adoption and the decision on how much to adopt is treated differently.
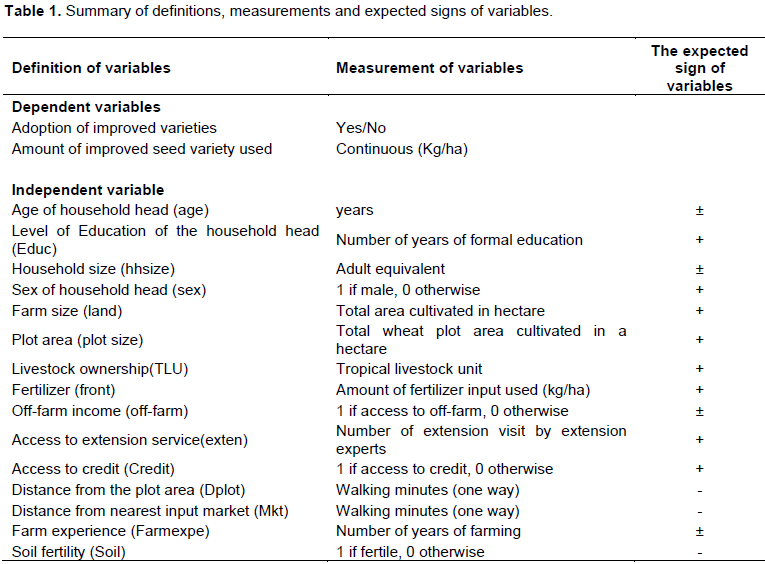
The independent variables and their definitions
A multitude of factors is found in the literature that affects the decision of farmers to adopt new agricultural technology and the level of adoption of these technologies. The set of explaining variables are household characteristics, physical, socio-institutional and plot-level characteristics included in the empirical models are selected following a review of many literature on farm level investment theory (Gebremedhin and Swinton, 2003; Tafesse and Sodo, 2016; Tsehay, 2016). These are explained in Table 1.
Adoption decision and its impact on household welfare
The empirical challenge in impact assessment using observational studies is establishing a suitable counterfactual against which the impact can be measured because of self-selection problems (Shiferaw et al., 2014). To accurately measure the impact of technology adoption on the welfare of farm households, the exposure to the technology should be randomly assigned so that the effect of observable and unobservable characteristics between the treatment and comparison groups is the same, and the effect is attributable entirely to the treatment. However, when the treatment groups are not randomly assigned, adoption decisions are likely to be influenced both by unobservable (e.g., managerial skills, motivation, and land quality) and observable heterogeneity that may be correlated to the outcome of interest. In developing countries particularly in rural areas, labour markets, credit markets and input markets are either missing or imperfect (Asfaw et al., 2012). This imperfection might be associated with poverty, underdeveloped non-farm sector, asymmetric information and high transaction costs, mainly in credit and input markets. In such situations, the relevance of a separable household model where consumption and production decisions are made independently is questionable. According to Asfaw et al. (2012), a suitable framework for analyzing household microeconomic behaviour under market imperfections is a non-separable model. This is because non- separable models can take into account the problem of selectivity bias and endogeneity.
In the literature, various econometric approaches exist to deal with selection bias such as instrumental variable (IV) approaches, propensity score matching (PSM), generalized propensity score (GPS) matching in a continuous treatment framework, and Heckman selection model. However, while PSM only controls for observed heterogeneity, instrumental variable (IV) control for unobserved heterogeneity. The Heckman selection model also considers those who do not adopt technology will never adopt under any circumstances. Therefore, a recently more applicable model for impact assessment in the literature i.e. endogenously switching regression model is more appropriate for various reasons. Recent studies in impact assessment are shifting to endogenously switching regression (Asfaw et al., 2012; Shiferaw et al., 2014; Mekonen and Karelplein, 2014; Kassie et al., 2014).
The assumption behind using endogenously switching treatment effect regression is that, in addition to the observed variables, there might be an unobservable farm and/or household characteristics that could potentially influence both the adoption of improved wheat varieties and household welfare. A farm household self-selects into adopting agricultural technologies due to observable and unobservable variables. Estimating the impact of technology adoption on household welfare without accounting for this problem might suffer from potential endogeneity bias and thus the estimated results may over or under-estimate impacts compared to the actual impact. It will also result in inconsistent estimates of the effect of the adoption of agricultural technology on household welfare. Simultaneous equation model can explicitly account for such endogeneity (Hausman, 1978).
This problem of endogeneity can be addressed by randomly assigning improved variety to treatment and control households, which assure that using improved variety is the only differentiating factor between treated households and those excluded from it, so that the control group can be used to assess the counterfactual (what would have happened to adopters in the absence of the intervention) (de Janvery et al., 2010). However, households per se decide to adopt or not to adopt based on the available information at hand. Therefore, adopters and non-adopters may be systematically different, which necessitates specification of separate welfare outcome functions for adopters and non-adopters, while at the same time accounting for endogeneity. The econometric problem will thus involve both endogeneity (Hausman, 1978) and sample selection (Heckman, 1979). This motivates the use of an endogenous switching regression model that accounts for both endogeneity and sample selection (Alene and Manyong, 2007; Di Falco et al., 2011; Asfaw et al., 2012; Shiferaw et al., 2014; Mekonen and Karelplein, 2014; Kassie et al., 2014).
Endogenous switching regression model
In this study, adoption is defined if farmers used any of the improved wheat varieties, either freshly purchased, and/or recycled improved varieties. A farmer adopts improved varieties if the expected utility from adoption (Ua) is higher than the corresponding utility obtained from non-adoption (Una), that is, Ua- Una > 0. The benefit from adopting improved wheat varieties by the ith farmer can be modelled as:

Where Zi is a vector of household, farm and institutional variables that affect the decision to adopt and/or not to adopt improved wheat varieties and is an error term. For households growing improved wheat varieties and for those who didn’t grow during the 2016/2017 production season, the outcome equation (welfare) corrected for endogenous adoption is given as:
Regime 1:

Regime 2:

Where Yi per capita consumption expenditure of household I under regime 1 (adopter of IWV) and regime 2 (local indigenous variety), Xi is a vector of the plot, household, farm, other explanatory variables, 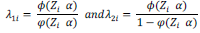 and are the inverse Mill’s ratios (IMR) computed from the selection equation and are included in Equations 5 and 6 to correct for selection bias in a two-step estimation procedure, that is, endogenous switching regression.
  and σ are parameters to be estimated, and η is an independently and identically distributed error term.
Conditional Expectations and Treatment Effects
The structure of the expected conditional and average treatment effects under actual and counterfactual scenario is specified as:
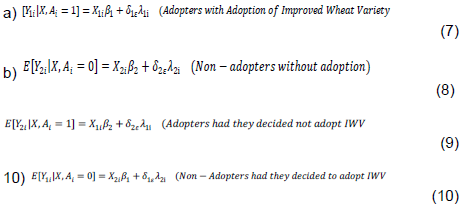
Situations 7 and 8 are observed in the sample. However, Equation 9 and 10 are the hypothetically expected situations (counterfactual outcome) where the treated happened to be untreated, and the untreated happened to be treated. Accordingly, the expected change in the welfare for households adopted improved varieties, that is, the average treatment effect on the treated plots (ATT) is given as:

Similarly, the expected per capita consumption of a household not growing improved varieties had they grew an improved variety, that is, the average treatment effect on the untreated households (ATU)
is given as:

Where X1 and X2 are set of explanatory variables affecting consumption expenditure in regime 1 and regime 2, respectively β1 and β2 are parameters to be estimated. The transitional and base heterogeneity will also be estimated.
Full information maximum likelihood estimation (FMLE) technique is the appropriate method for endogenous switching regression. It can simultaneously estimate the selection equation (probit model and the outcome equation (the per capita consumption expenditure).
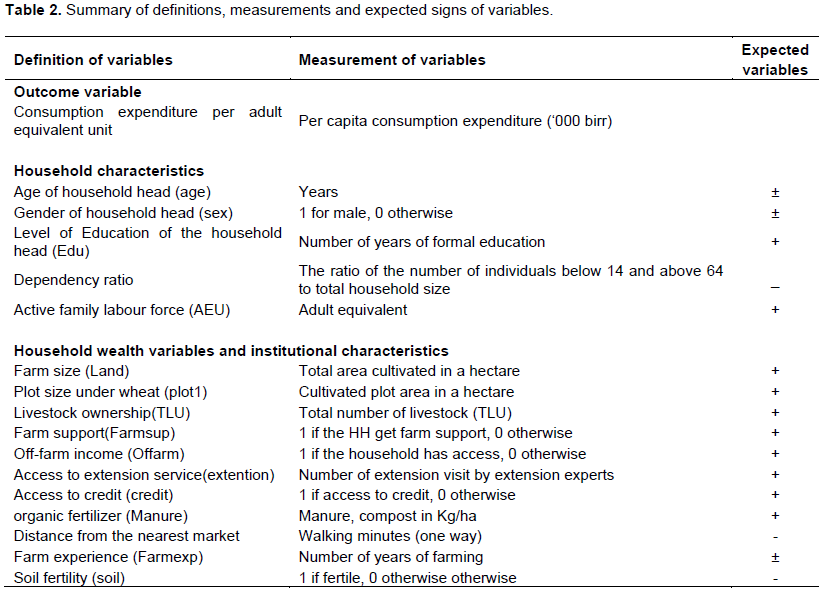
Variable definitions, measurements and expected signs in adoption impact model
Based on the bounds of existing literature on impact analysis on welfare set of explanatory variables are adopted in this study as presented in Table 2.
RESULTS AND DISCUSSION
Descriptive analysis
Distribution of plot size, technology adoption and intensity
Since it is important to describe the data which results in insight on the adoption of agricultural technologies and intensity of use, we demonstrate the distribution of plot size, and technology adoption and intensity in Table 3. It is revealed that about 66% of the samples adopt chemical fertilizer, and 35% of them are non-adopters. This is consistent with Terefe et al. (2013) on the central rift valley of Ethiopia. About 30% of sample respondents appeared to be organic fertilizer (manure) adopters and about only 10% of sample households adopt compost, while about 38% of the samples adopt improved wheat variety. This implies that compared to chemical fertilizer, the adoption of improved seed was found to be small.
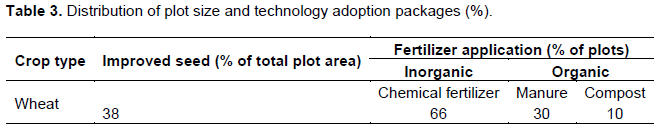
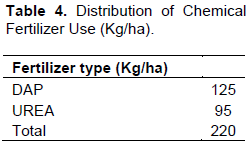
Table 3 shows a variation in the application of organic and inorganic fertilizers, and improved high –yield increasing varieties. The low level of organic fertilizer application is a manifestation of the level of technological practices and existing knowledge within the farm households. Table 4 also infer the existence of variation in the intensity of adoption of chemical fertilizer among adopters. On the average adopters use 125 kg of DAP and 95 kg of UREA per hectare of their fertilized land under wheat production. Though variations exist between the two types of chemical fertilizers, the level of chemical fertilizer use per hectare of the wheat plot area is not underestimated.
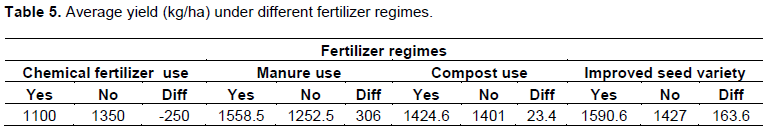
It is worth mentioning to investigate the relationship between productivity (yield) and the application of chemical fertilizer in comparison to pre-existing technological practices. An insightful result on average yield under different technology regimes is presented in Table 5. The average yield is about 1970 kg/ha with significant variation across fertilizer types. Another important feature of the table is the impact of fertilizer use on productivity. There is a positive differential in productivity between adopters and non-adopters of organic fertilizer and improved seed varieties, which implies that fertilizer and improved seed use helps to improve the productivity of smallholder farmers.
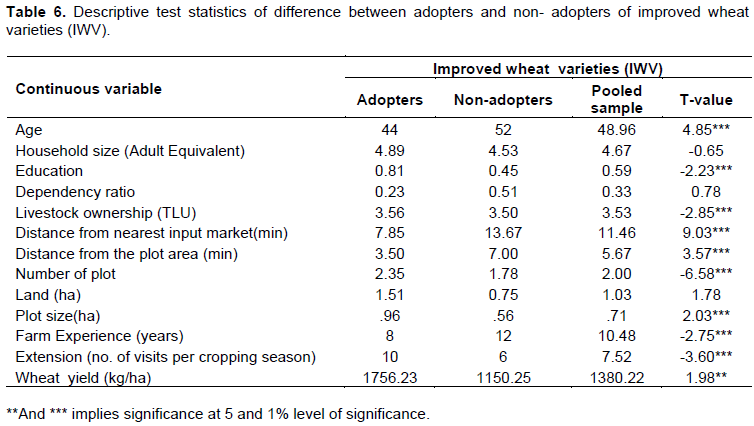
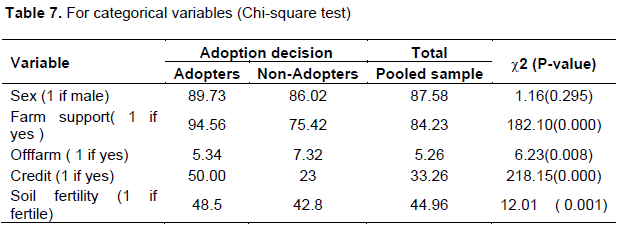
A simple mean comparison test between adopters and non-adopters of improved seed variety shows that household characteristics, including education and livestock ownership (TLU), are considerably larger for adopters. The mean distance from input market and distance from the plot area is smaller for the adopters compared to its counterparts, signifying that non-adopters have less access to market and information which in turn results in a slow diffusion of farm technology as well as high transportation cost. Households are also different in terms of their plot characteristics such as plot size and a number of plots of wheat. Adopters of improved wheat varieties have more hectares of wheat land and the number of plots of land under wheat cultivation. However, the data revealed that adopters are highly associated with lower farming experience. It leads us to conclude that farmers with few years of farming tend to adopt more than those with many years of farming. On the other hand, adopters are found to be with more access to extension visit and larger farm productivity/ yield per hectare. Farmers who adopt the modern high yield varieties of wheat seed have secured high yield (about 606 kg) than what the non-adopters produce. With regard to institutional factors (credit access and farm support), adopters have more access than non-adopters. This implies that those farmers with access credit or having access to farm support are more likely to participate in adopting new technologies. This is because they can have less financial constraint and more know how to use these technologies. About 50% of adopters were found to have credit access and 94.56% of them have access to farm support. However, only 23% of non- adopters have access to credit service. Tesfaye et al. (2016) have also found a positive implication of credit service on wheat adoption decision. Mohamed and Temu (2008) also argued that credit can facilitate farm households to purchase the needed agricultural inputs and enhance their capacity to affect long-term investment in their farms (Tables 6 and 7).
The probability and intensity of agricultural technology adoption
The probability of agricultural technology adoption
Table 8 deals with the estimated relationship between socio-economic and institutional factors, and smallholder farmer’s technology adoption decision. The result has revealed that off-farm employment of the household head, access to credit service, the fertility of soil; total land size and the number of extension visits reinforce farmer’s probability of adopting new agriculture technology. The land area the major component of the wealth of rural households has a significant positive impact on the likelihood of adopting an improved variety of wheat. The result demonstrated that the probability of adoption increase by 2.1% when the size of land under cultivation rise by 1 ha. This result is similar to the findings of Asfaw et al. (2011) and Hailu et al. (2014). It is also evident that farmers with financial constraint decide to adopt new technologies provided that they are offered to fill their financial gap, which implies that adoption is greater when farmers are with the opportunity of accessing credit from financial institutions than otherwise could be. The result is consistent with Hailu et al. (2014) and Yu et al. (2011).
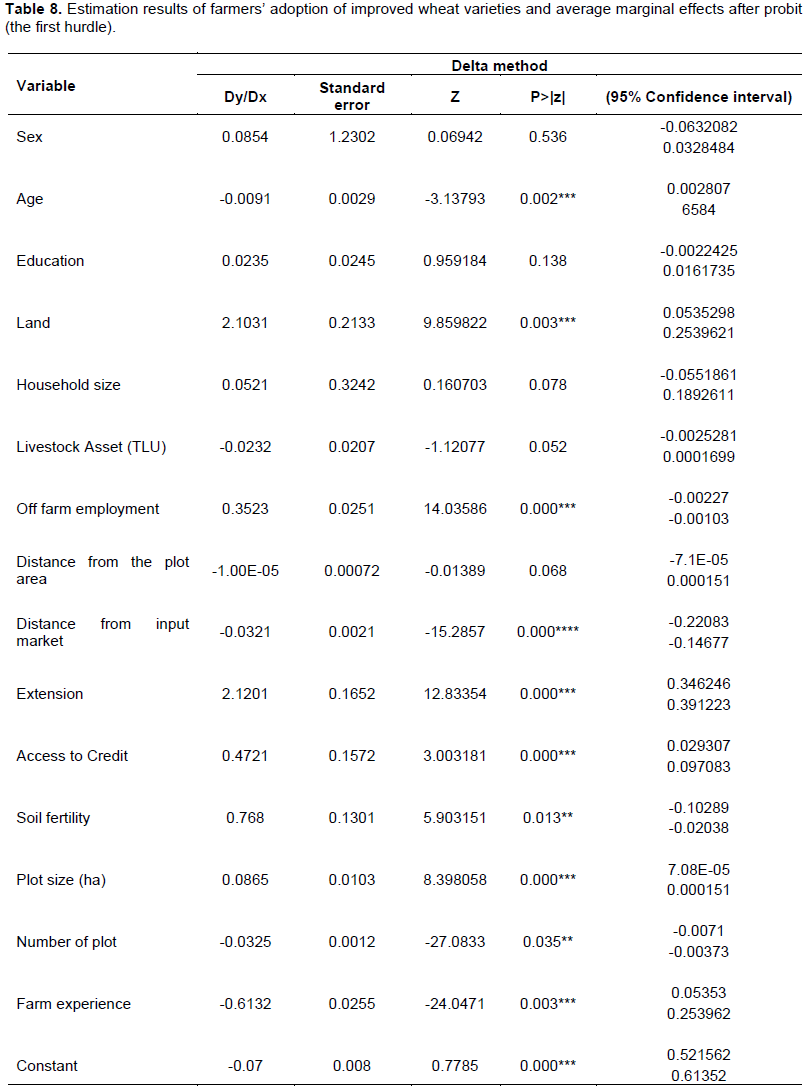
The number of extension visits made by extension experts has an imperative role in enhancing farmer’s adoption decision. The result has shown that improved wheat variety adoption likely increases by 2.1% for a unit increase in extension visit. It is statistically significant at 1% level of significance. Therefore, we can deduce that the higher the number of extension visit to farmers, the higher the likelihood of preference to adopt a new variety of wheat. It is the major instrument for the dissemination of outputs of agricultural research. It affects agricultural technology adoption in various situations. First, extension training and advisory service to farmers increase human capital and information access. Second, it is mostly complemented with input distribution and farm credit access. Third, it is the major channel through which agricultural research and development outputs are transferred to smallholder farmers. The fertility status of the soil is another factor affecting farmer’s adoption decision. The result confirmed that farmers have a high chance of adoption, provided that their plot is fertile land. Their probability of adoption tends to decrease when the soil fertility status is getting poor. The result of this study is also similar to the findings of Asfaw et al. (2012); and Shiferaw et al. (2014).
On the contrary, some institutional, demographic structure and plot specific variables have a detrimental impact on farmer’s probability of technology adoption; Farm experience, the number of the plot, distance from input markets and age of the household head are found to influence farmer’s adoption decision negatively. The result revealed that the age of the household head is negatively and significantly affecting the probability of adoption at a 1% level of significance. It infers that an increase in the age of the household head by one year will result in the likelihood of adoption of improved wheat variety by 0.01%. The higher the age of the household head is the lesser the probability of introducing the new technology. Likewise, farm experience also influences adoption decision negatively. When number of years of experience increase by a year, the likelihood to adopt the new technology falls by 0.61%. This might be the case that farmers with long years of farming experience are reluctant and stick to their traditional farming, instead of adjusting them to the new technologies. This is result is consistent to the descriptive result and the finding of Hailu et al. (2014), Yu et al. (2011) and Kassie et al. (2009).
Land fragmentation measured by the number of plot and average walking distance from the input market in minutes reduces smallholder’s interest to adopt a new variety of wheat seeds. It is significant at 5 and 1% level of significance, respectively. Accordingly, as the distance to the nearest market increases by one minute, the probability of adopting improved wheat variety would decrease by 0.03%. The same would also be true that the farther the plot from the homestead, it would be less likely to utilize inputs. The result is in line with our prior expectation and consistent with the theory. The same result was found by Kassie et al. (2012), Shiferaw et al. (2014) and Hailu et al. (2014).
The intensity of technology adoption
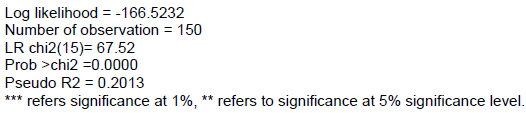
It is imperative to try to look at the intensity of technology adoption when we speak of the impact of adoption on households welfare. With this regard, the intensity equation is estimated for improved varieties of wheat, where the result is presented in Table 9. The result demonstrated that household characteristics such as education and household size have a positive and significant effect on the amount of improved wheat variety used. However, age has a detrimental effect on the intensity of technology adoption. As the age of the household head increases the level of adoption tends to decrease. This implies that farmers might become reluctant to take advantage of new technologies and stick to their traditional farming experience as their age goes up, which is in line with prior theoretical expectation. Whereas, the level of adoption was found higher with higher educational level and large family size. The study also revealed that the level of technology adoption (improved wheat variety) by smallholder farm households tends to raise with a better level of livestock asset ownership. Livestock ownership has a positive and significant effect while education has a positive and significant effect. Livestock is a proxy for household wealth and wealthier farmers have more chance of purchasing improved wheat technology. The result also concludes that off-farm employment improves the intensity of adoption. Hence, adopters support themselves with off-farm activities.
Distance from the input market and distance from wheat plot area result in a detrimental impact on the level of technology adoption. As the plot area and the nearest input market is far from the homestead, farmers will face higher transportation cost given poor infrastructure and thereby accessibility of new wheat technology becomes difficult. Similar results were found by other studies (Hailu et al, 2014; Kassie et al., 2009).
The intensity of adoption is also found to increase with the higher number of extension visits. Access to the extension has a positive and significant effect on the intensity of adoption which may be due to the fact that access to and the frequency of extension visit is a vital way through which farmers get technical information and other services. Total land size has a negative and significant effect on the intensity of improved wheat variety use. Similarly, farm experience and the number of plot area have a negative effect on the level of improved wheat technology adoption. However, adopters are found to have more access to credit service than non-adopters. Credit gives farmers with the capacity to purchase the demanded technology; hence greater credit accessibility gives them to increase their level of adoption. In the same vein, soil fertility of wheat plot area results in a positive impact on the intensity of adoption.
Welfare impact of technology adoption
Determinants of household per-capita-expenditure
Comparing the household per capita expenditure differential between adopters and non-adopters of improved technology is the major objective of this study. For that matter, we have estimated expenditure functions for the two groups, in order to deduce whether farm households are benefited from adopting improved wheat varieties. For identification, we took government extension, and input market distance as selection instruments of our study. These variables are expected to fulfil to main conditions to be considered as a valid instrument. First, they should not be directly related to the farm household’s farm consumption expenditure. They should directly affect the adoption of the Improved wheat variety. For instance, if we take input market distance it directly affects the demand of adopting an improved wheat seed, however; it doesn’t have a direct effect on the farm household’s expenditure. Because farm inputs are critical ingredients to increase productivity, farmers with difficulty of accessing farm inputs will fail to adopt new technology and vice versa. However, it is difficult to prove the validity of the instruments without undertaking appropriate statistical tests. Hence, we use two main tests for robustness checks. By using robust probit regression the effect of instruments on improved wheat adoption (the dependent variable in the selection equation) is jointly significant at 5% level of significance. The second test is conducted by using OLS regression on the outcome equation of non-adopters with selection instruments and other covariates. The result of this test indicates that the instruments joint effect on the nonadopters consumption expenditure is insignificant.
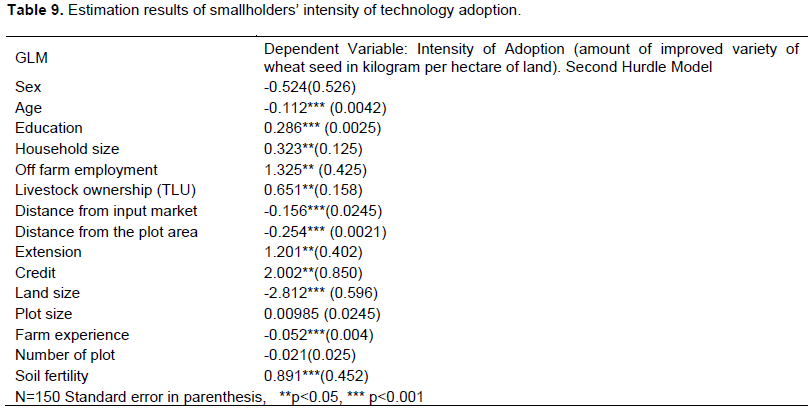
As we can see in the 1st column of Tables 10 and 11 we have estimated the consumption expenditure function for the pooled sample using OLS estimation technique by considering an improved wheat variety as an explanatory variable. The result shows that the adoption of 9 wheat variety has a positive significant effect on per capita consumption expenditure function. Column (1) of OLS regression in the Table 10 indicates that other factors remain constant; farm households who adopted IWV can get a 35% consumption increment than their non-adopter counterparts. However, accepting this result as a correct measure for the effect of IWV on household per capita consumption is not appropriate. Because in this regression it is assumed that there is strict exogeniety in the adoption of IWV. But it is the personal decision of farmers and potentially endogenous. Thus, the estimated results of this model are biased and inconsistent since it fails to account the problem of selection bias and unobservable heterogeneity. Indeed, it fails to identify the structural difference in consumption expenditure between adopters and non-adopters.
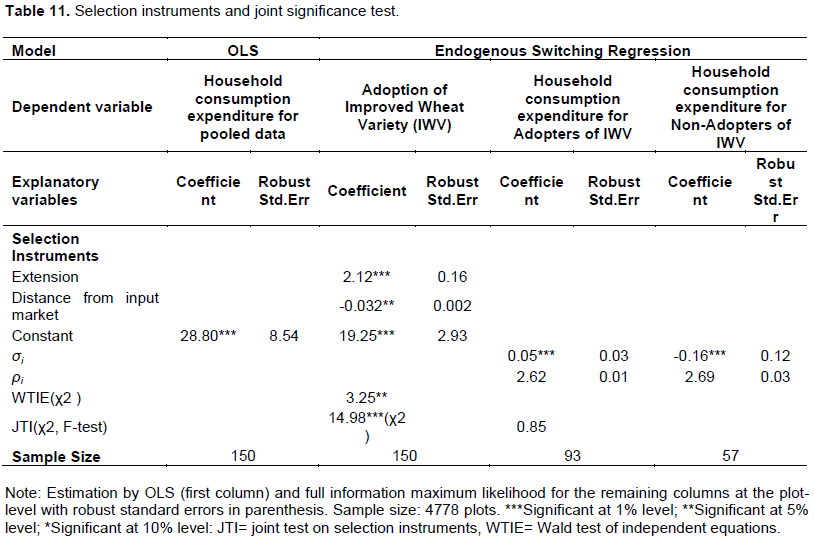
To this end, the Endogenous Switching Regression (ESR) model for household per capita consumption functions for adopters and non-adopters was estimated. The last two columns of Tables 10 and 11 indicate the determinants of per capita consumption expenditure for adopters and non -adopters. As per the result, household characteristics, credit access, and extension are found the key determinants of the consumption functions of both adopters and non- adopters. The Wald test of independence is significantly different from zero, which indicates the existence of selection bias and slope heterogeneity between adopters and non- adopters. There are also some factors which affect adopters and non -adopters differently. Thus estimating two separate income functions is mandatory.
Household characteristics
Household characteristics are found significantly influencing household welfare outcomes. Compared to the non-adopters, adopters are found to have higher age level. An increase in the year of the household head results in a 6% increase in household consumption level and a 5% increase in consumption level for total sample households. This implies that households who adopt an improved variety of wheat have better consumption level than that of their counterparts, despite their age goes up. On the other hand, household size has a strong negative influence on consumption expenditure of non-adopters than adopters. A unit increase in household size results in about 78% reduction in consumption of non- adopters and 32% reduction of consumption for adopters. Probably this will be due to the case when the household members are dependent and not contribute to the income portfolio of the household.
Farm experience is the other significant covariate that affects consumption of households. A one year increase in farm experience of adopters results in a 3% increase in their per capita consumption, however, farm experience doesn’t affect the welfare of non- adopters. This is because experienced farmers are more exposed to technology and are better aware of the significance of adoption. Similarly, as prior expectation, an increase in ownership of livestock assets increases the per capita consumption of adopters by 6% than their counterparts. This might be associated with the increase in cash from their livestock assets which can support the access to finance for input for production. The rest of household characteristics, sex, and education and off-farm employment have no significant impact on the consumption level of sample households.
Institutional factors
The result indicated that credit access has a strong significant effect on household per capita consumption/ welfare on both adopters and non- adopters. This might be through the associated productivity growth from credit access and the resulting growth in farm income that adopters and non- adopters increase their welfare.
However, the resulting welfare increment of adopters (24) is 12% higher than that of non- adopters (12%). The effect of extension service on rural household welfare is also positive and significant. Ceteris paribus, adopter’s welfare will increase by 35% provided they are privileged to the access to extension service by one more trip, which is significantly higher than non-adopters (9%). According to Birkhaeuser et al. (1991), the extension has the potential of bridging discoveries and mitigation methods from research laboratories and the in-field practices of individual farmers, In addition, it provides, information about cropping techniques, optimal inputs use, high-yield varieties and prices. Access to extension service enhances the adoption of improved agricultural technologies by reducing supply-side constraints that arise due to information market inefficiencies (Wossen et al., 2015).
Plot characteristics
A number of the plot is found has a strong negative and significant impact on household welfare of adopters, while its effect on non-adopters is found neutral. This is because more fragmentation of land might put a challenge on managing croplands during pre and post-harvest period. It will incur much time, money and labour force to manage the weeding and harvesting of crops when the plot is many and fragmented. Especially, improved varieties need strong follow up than the traditional varieties which can adjust to the environment easily. Adopter’s welfare will decrease by 3% more than their counterparts if their plot land is increased by one more unit. However, plot size has a strong positive impact on the welfare of adopters. Increased in the size of plot land, increase the per capita consumption of adopters by 12% more than the consumption of non- adopters. This is the fact that the large land size allows applying improved technologies and used as security to access credit compared to those with small land size. Similar results have been found in (Hailu et al., 2014).
Average expected per capita consumption expenditure
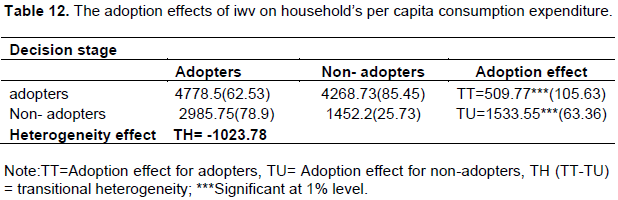
From our previous result, we have found that adopting IWV has a positive significant effect on household’s per capita consumption expenditure. However, this simple measurement is inappropriate as both observed and unobserved factors which may have an effect on the outcome variable may not be considered. Therefore, it is important to compare the value of the outcome variable with the actual and counterfactual cases. In Table 9 the result on the expected consumption expenditure in the actual and counterfactual cases is presented. The result indicates that adoption of IWV do not have the same effect on adopters had they been a non-adopter and non- adopters had they been an adopter.
The number in the first row first cell of Table 12 is the average per capita consumption value (4778.5) for adopters of IWV. The number in the second cell (4268.73) indicates the average per capita consumption for adopters in the counterfactual case. Then the adoption effect on adopters can be found by subtracting the second cell from the first cell (509.77). The result is positive and significantly different from zero. This suggests that the farm household’s consumption per adult equivalent for those who adopted IWV is significantly higher than if they did not adopt. By using a similar procedure the adoption effect of IWV on non-adopters can be calculated from the same table. In the second row first cell of the following table, we get the value of average per capita consumption for non-adopters in the counterfactual case, while the second cell in the same row represents the same value in the actual case. Then by taking the difference between the first and the second cell we can get per capita consumption of non-adopters (1533.55). The result indicates that per capita consumption will increase significantly if they adopt IWV than the actual case of non-adoption. Similar studies by Di Falco et al. (2011); also reported the same result with our study.
CONCLUSIONS
From the results of the study, we found it possible to draw the following conclusions. First, it was found that household characteristics, plot characteristics and institutional factors are the main determinants of adopting improved wheat verities. Age of household head, off-farm employment, and farm experience were the key household characteristics that determine the likelihood of adoption significantly. Extension service, credit access, soil fertility, plot size and land size affect the probability of adopting IWV positively and significantly. Whereas, farm experience, age of the household head, distance from the input market and a number of the plot (fragmentation) negatively affect the decision of farmers improved wheat technology adoption. Second, the study revealed that adoption of improved wheat variety is found to be less in plots which are located in the farther distance to nearest input market and have more farming experience with many numbers of plots. Plots that are far from the input market fails to get timely access to inputs and accessibility will become costly to get. Indeed farmers cannot visit continuously due to their distance problem. Likewise, households with lots of farm experience are associated with less likelihood of adoption. Similar to the effect on the decision model, variables like; age, off-farm employment, distance from the input market, extension, credit, size and soil fertility, and farm experience have a strong and significant effect on the amount of improved wheat per hectare adopted by households. The intensity of adoption is lower for households with higher age, far from the input market, plots far from the homestead, more land size and high level of farm experience. However, the level of technology adoption is high for households with more education, high household size, off-farm employment, more livestock ownership, more extension service, access to credit service and fertile soil. The study applied the Double Hurdle (DH) model to simultaneously estimate the decision/ Probit and intensity/ truncated model.
Third, factors such as household size, soil fertility, access to credit, and a number of extension visits are the major determinants of households consumption expenditure per adult equivalent for both adopters and non-adopters. Household size measured in adult equivalent; reduce the per capita consumption of both adopters and non-adopters. However, its effect is severe on non- adopters. Soil fertility, access to credit, and the number of extension visits are found to spur household welfare for both adopters and non-adopters, though adapters are better than their counterparts. Other variables like; age, farm experience, asset ownership (TLU), and a number of plot increase the welfare of adopters, leaving non- adopters welfare neutral. On the contrary, the distance of the plot from the nearest input market and plot size reduces adopter’s welfare. Fourth, both adopters and non-adopters adopting improved what varieties can improve the farm household’s welfare, given they decided to adopt than they would if they had not adopted it. In addition, non-adopters can get the largest payoff relative to adopters if both of the two groups decided to adopt. To recap, the regression result revealed that agricultural technology adoption has a positive and significant effect on the farm by which adopters are better off than non- adopters of the technology.
RECOMMENDATIONS
The findings of this study are indisputably essential to develop policies and strategies that aimed at improving the wellbeing of farm households through improved technology adoption and application of these technologies at a large scale. The result conveyed that the adoption of improved wheat varieties has a positive and significant effect on adopter’s welfare. Hence, participation in technology adoption should be further advanced and barriers to access technologies should be settled. Therefore, this study draws the following main policy implications.
(i) Institutional factors like, extension, and credit are found the most important factors which increase the likelihood of adoption. Thus, at most attention should be given by policymakers for the provision of credit service and the number of extension visits for rural farm households. This will enable to increase their willingness and ability to purchase/ participate in new agricultural technologies through relaxing their cash constraint and providing them with better information on the access and application of the technology. Furthermore, the distance to the input market negatively affects the probability of adoption. Hence, alternative ways of accessing complementary inputs which are necessary for effective agriculture should be in place. Mainly improving access to infrastructure might be an alternative.
(ii) Though Farm size affects both the household’s welfare and the decision to adopt, it affects adoption decision positively and welfare negatively. As farm size increases the likelihood of adoption increase while farmer’s welfare will decline. This implies that farm households are better productive and highly motivated to practice IWV at lower farm size. Therefore, agricultural policies should invest more on mechanisms that enable farmers to be more productive in small land size. So as to augment agricultural productivity and to reduce rural poverty it is better to focus on intensive farming compared to extensive farming
(iii) Credit constraint is a headache of a rural farm household’s welfare. Keeping other things stable, by adopting improved/high yield varieties farmers can improve their welfare substantially in terms of per capita consumption expenditure increment. Therefore, it is strategic to promote the adoption of IWV in credit-constrained farm households.
(iv) Since the application of improved technology adoption increase farm household’s welfare, increasing the participation of farmers on adoption and their level of adoption vital to spurring agricultural productivity and hence welfare.
(v) Since aged farmers and those with higher years of farm experience have a low rate of technology adoption, their productivity will be lower which would end up with poverty. Therefore, those farmers are needed to be supplemented by strong institutional support and access to credit.
(vi) Household size reduces farmer’s per capita consumption expenditure, which might be a higher dependency level. Therefore, it should be better if appropriate family planning mechanism and information on the relevance is addressed timely.
(vii) Despite the positive effect of the adoption of IWV on both adopters and non-adopters, the extent of benefit from the treatment effect is not equal and comparable. This implies the existence of divergence between the two groups. So policymakers should take in to account this heterogeneity when they are attempting to advance the relevance of IWV so as to secure the full potential benefit of the practice.
CONFLICT OF INTERESTS
The authors have not declared any conflict of interests.
REFERENCES
|
Asfaw S, Shiferaw B, Simtowe F, Lipper L (2012). Impact of modern agricultural technologies on smallholder welfare: Evidence from Tanzania and Ethiopia. Food Policy 37:283-295. |
|
|
Asfaw S, Shiferaw B, Simtowe F, Haile M (2011). Agricultural technology adoption, seed access constraints and commercialization in Ethiopia. Journal of Development and Agricultural Economics 3(9):436-477. |
|
|
Awotide B, Karimov A, Diagne A (2016). Agricultural technology adoption, commercialization and smallholder rice farmers' welfare in rural Nigeria. Agricultural and Food Economics 4(3):1-24 |
|
|
Bickford R (2019). Ethiopia Grain and Feed Annual Report.Global Agricultural Information Network, USDA foreign agricultural service staff report, ET1903. |
|
|
Bingxin Y, Alejandro NP (2014). Fertilizer Adoption in Ethiopia Cereal Production. Journal of Development and Agricultural Economics 6(7):319-337. |
|
|
Birkhaeuser D, Evenson RE, Feder G (1991). The economic impact of agricultural extension: A review. Economic Development and Cultural Change 39(3):607-650. |
|
|
Cragg JG (1971). Some statistical models for limited dependent variables with application to the demand for durable goods. Econometrica (pre-1986) 39(5):829. |
|
|
Central Statistical Agency (CSA) (2011). Report on Area and Production of Major Cereals (Private Peasant Holdings, Meher Season). Agricultural Sample Survey 2110/11, Addis Ababa, Ethiopia. |
|
|
De Janvry A, Sadoulet E (2002). World poverty and the role of agricultural technology: direct and indirect effects. Journal of Development Studies 38(4):1-26. |
|
|
Di Falco S, Marcella V, Mahmud Y (2011). "Does Adaptation to Climate Change Provide Food Security? Micro Evidence from Ethiopia" American Journal of Agricultural Economics 93(3):829-846. |
|
|
Gebregziabher G, Holden S (2011). Does Irrigation Enhance and Food Deficits Discourage fertilizer Adoption in a Risky Environment? Evidence from Tigray. Ethiopian Journal of Development and Agricultural Economics pp. 514-528 |
|
|
Gebremedhin B, Swinton SM (2003). Investment in soil conservation in northern Ethiopia: the role of land tenure security and public programs. Agricultural Economics 29(1):69-84. |
|
|
Greene WH (2000). Econometric Analysis. 4th edition. Englewood Cliffs: NJ: Prentice-Hall. |
|
|
Hailu BK, Abrha BK, Weldegiorgis KA (2014). Adoption and Impact of Agricultural Technologies on Farm Income: Evidence from Southern Tigray. International Journal of Food and Agricultural Economics 2:91-106. |
|
|
Hausman JA (1978). Specification tests in econometrics. Econometrica 46:1251-1272 |
|
|
Heckman J (1979). Sample selection as a specification error. Econometrica 47:153-161. |
|
|
Jaleta M, Kassie M, Marenya P (2015). Impact of Improved Maize Variety Adoption on Household Food Security in Ethiopia: An Endogenous Switching Regression Approach. International conference of agricultural economists, agriculture in the interconnected world, Milan Italy. |
|
|
Jose A (1989). A double-hurdle model of cigarette consumption. Journal of Applied Econometrics 4(1):23-39. |
|
|
Kassie M, Shiferaw B, Muricho G (2011). Agricultural technology, crop income, and poverty alleviation in Uganda. World Development 39(10):1784-1795. |
|
|
Kassie M, Jaleta M, Shiferaw B, Mmbando F, Muricho G (2012). Plot and household-level determinants of sustainable agricultural practices in rural Tanzania. Environment for Development Discussion Paper-Resources for the Future (RFF), (12-02). |
|
|
Kassie M, Jaleta M, Mattei A (2014). Evaluating the impact of improved maize varieties on food security in Rural Tanzania: Evidence from a continuous treatment approach. Food Security 6(2):217-230. |
|
|
Kassie M, Yesuf M, Köhlin G (2009). The role of production risk in sustainable land-management technology adoption in the Ethiopian Highlands. rapport nr. Working Papers in Economics 407. |
|
|
Maertens A, Barrett CB (2013). Measuring Social Networks' Effect on Agricultural Technology Adoption. American Journal of Agricultural Economics 95(2):353-359. |
|
|
Mekonen T, Karelplein K (2014). Productivity and Household Welfare Impact of Technology Adoption: A Micro-econometric Analysis. United Nation University and Maastricht University. |
|
|
Mohamed KS, Temu AE (2008). Access to credit and its effect on the adoption of agricultural technologies: the case of Zanzibar. African Review of Money Finance and Banking pp. 45-89. |
|
|
Nyangena W, Maurice O (2014). Impact of Improved Farm Technologies on Yields, the Case of Improved Maize Varieties and Inorganic Fertilizer in Kenya. The environment for Development, Discussion Paper Series (EfD DP 14-02). |
|
|
Rogers EM, Shoemaker FF (1971). Communication of innovations: A cross-culture approach. The Free Press, Collier Macmillan Publishing Inc, NY pp. 11-28. |
|
|
Shiferaw B, Kassie M, Jaleta M, Yirga C (2014). Adoption of improved wheat varieties and impacts on household food security in Ethiopia. Food Policy 44:272-284. Elsevier Ltd. |
|
|
Shiferaw K, Tewodros AK, You L (2008). Technology Adoption under Seed Access Constraints and the Economic Impacts of Improved Pigeon pea varieties in Tanzania. Agricultural Economics 39(3):309-323. |
|
|
Tafesse T, Sodo W (2016). Adoption and Intensity of Row-Seeding (Case of Wolaita Zone). Open Access Library Journal 3(03):1. |
|
|
Teklewold H, Dadi L, Yami A, Dana N (2006). Determinants of adoption of poultry technology: a double-hurdle approach. Livestock Research for Rural Development 18(3):1-14. |
|
|
Terefe T, Ahmed H, Gebremariam G (2013). Adoption and extent of use of organic fertilizer in Arsi Negelle District, Oromia Regional State of Ethiopia: What are the sources? Advanced Journal of Agricultural Research 1(004):061-071. |
|
|
Tesfaye S, Bedada B, Mesay Y (2016). Impact of improved wheat technology adoption on productivity and income in Ethiopia. African Crop Science Journal 24(s1):127-135. |
|
|
Tsehaye A (2016). The Analysis of Fertilizer use and Agricultural Productivity: (Case of La'ilay Maychew Woreda, Tigray, Ethiopia). A paper presented on 14th International Conference on the Ethiopian Economy, organized by Ethiopian Economics Association (EEA). |
|
|
World Bank (2006). World Development Report: Agriculture for Development, Washington D.C. |
|
|
Wossen T, Berger T, Di Falco S (2015). Social capital, risk preference and adoption of improved farmland management practices in Ethiopia. Agricultural Economics 46:81-97. |
|
|
Yu B, Nin-Pratt A, Funes J, Gemessa SA (2011). Cereal production and technology adoption in Ethiopia. Ethiopia Strategy Support Program II (ESSP II), ESSP II Working Paper 31. |
|
Copyright © 2024 Author(s) retain the copyright of this article.
This article is published under the terms of the Creative Commons Attribution License 4.0


