African Journal of
Agricultural Research

  • Abbreviation: Afr. J. Agric. Res.
  • Language: English
  • ISSN: 1991-637X
  • DOI: 10.5897/AJAR
  • Start Year: 2006
  • Published Articles: 6860

Full Length Research Paper

Spatial variability of weeds in an Oxisol under no-tillage system

Glécio Machado Siqueira
  • Glécio Machado Siqueira
  • Department of Geoscience, UFMA - Federal University of Maranhão, Av. dos Portugueses, 1966, Bacanga, CEP 65080-805, São Luís – MA, Brazil.
  • Google Scholar
Raimunda Alves Silva
  • Raimunda Alves Silva
  • Department of Geoscience, UFMA - Federal University of Maranhão, Av. dos Portugueses, 1966, Bacanga, CEP 65080-805, São Luís – MA, Brazil.
  • Google Scholar
Alana das Chagas Ferreira Aguiar
  • Alana das Chagas Ferreira Aguiar
  • Department of Biology, UFMA - Federal University of Maranhão, São Luís – MA, Brazil.
  • Google Scholar
Mayanna Karlla Lima Costa
  • Mayanna Karlla Lima Costa
  • Department of Geoscience, UFMA - Federal University of Maranhão, Av. dos Portugueses, 1966, Bacanga, CEP 65080-805, São Luís – MA, Brazil.
  • Google Scholar
Ênio Farias França e Silva
  • Ênio Farias França e Silva
  • Department of Rural Technology, UFRPE - Federal Rural University of Pernambuco, Recife – PE, Brazil.
  • Google Scholar


  •  Received: 12 April 2016
  •  Accepted: 02 June 2016
  •  Published: 21 July 2016

 ABSTRACT

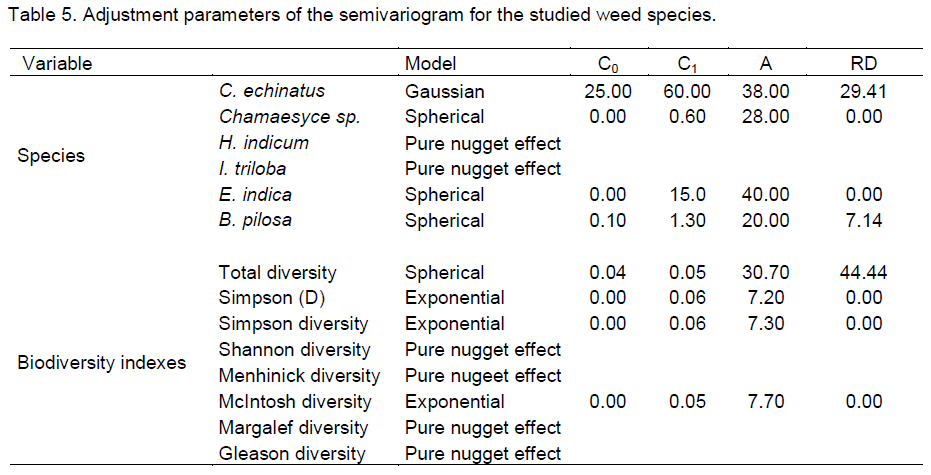
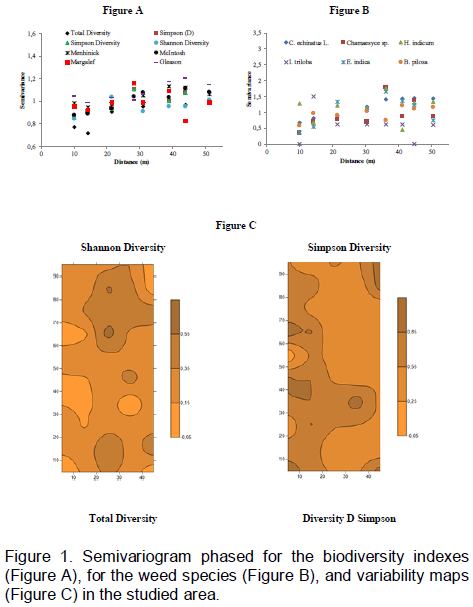
In the global agribusiness, the herbicide use is a major problem for sustainable production, in this sense, it is necessary to better understand the interaction of weed species and floristic composition such as biodiversity indicators. The objective of this study was to analyze the spatial variability of weeds in an Oxisol under no-tillage system. Samples were taken in an area of 0.5 ha, in 50 sampling points with spacing of 5 m x 10 m. Data were analyzed by means of classical statistics, geostatistics, and spatial variability of the constructed maps by the interpolation by kriging technique. All the species of weeds presented in the study area showed spatial variability with the exception of Ipomoea triloba (L.) and Heliotropium indicum (L.), which showed pure nugget effect. The range values (a) shows that the spacing between samples can be extended to all species of weeds. The study was unable to determine specifics areas of management in the local since the different species of weed infested different plots of the area.

Key words: Precision agriculture, semivariograms, site-specific management.


 INTRODUCTION

The weeds have acquired along the evolutionary process the capacity to establish themselves in areas where the natural vegetation has been eliminated, mainly for agricultural cultivation. Among the developed features by the weeds, there are high reproductive capacity, rapfastid dispersal, and genetic adaptations. These associated characteristics are responsible for a significant part in the reduction of agricultural production (Rodrigues et al., 2010).  Once uncontrolled,   weeds host several pest insects, nematodes, and pathogens in the crops.
 
Furthermore, the weeds even compete for water, nutrients which reduce the availability in the crop in the area. The knowledge of how the populations of weeds develop allows adding to the agricultural production system a lot of information that were previously ignored in most of the cases which herbicide application is made considering an average infestation for all growing area. In this sense, the use of precision farming tools allows space and temporal monitoring of weeds variability, mapping the infestation areas, specific areas of management determination (Goel et al., 2003), and herbicides localized application, which reduces the applied amount and costs.
 
According to Mortensen et al. (1998), the weed species presented temporal stability which favors the management of cropping areas. However, in Brazil, little is known about the spatial variability of weeds. The first works were Shiratsuchi et al. (2004, 2005), Schaffrath et al. (2007) and Monquero et al. (2008) whose studied the spatial distribution of weed in order to determine specific zones of management. Other studies emphasized the importance of studying the weeds distribution and specific management sites. Domingos and Laca-Buendia (2010) studied weeds in the preharvest of the sorghum crop. Calado et al. (2013) studied weed control in winter wheat influenced by different farming systems. Bressan et al. (2006) used geostatistics techniques to classify the risk of weed infestation, and made the decision on the best management for each field area.
 
Shiratsuchi et al. (2005) also reported that most studies that focused on weeds mapping had as a primary concern mapping the emerging flora during the critical cycle of interference, being the only few studies on spatial variability of weeds in the course of the crop cycle. Allied to this, studies focusing on weed parameters analysis of species diversities of the communities try to determine the degree of infestation, being one of the first steps in studying the weeds dynamics and the choice of strategies control (Lacerda et al., 2005).
 
Thus, this study aimed to determine the spatial variability of weeds in an Oxisol managed under the no-tillage system in Urutaí (Goiás, Brazil).


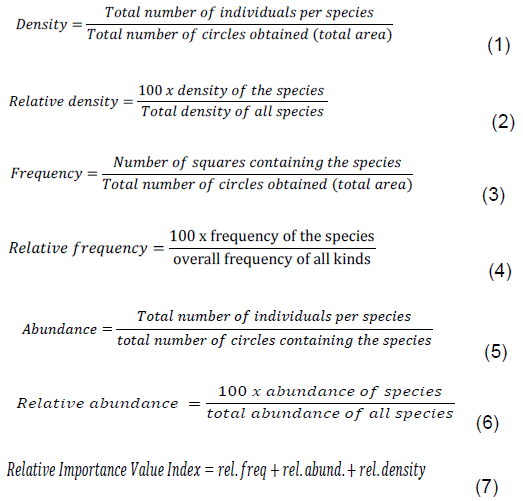
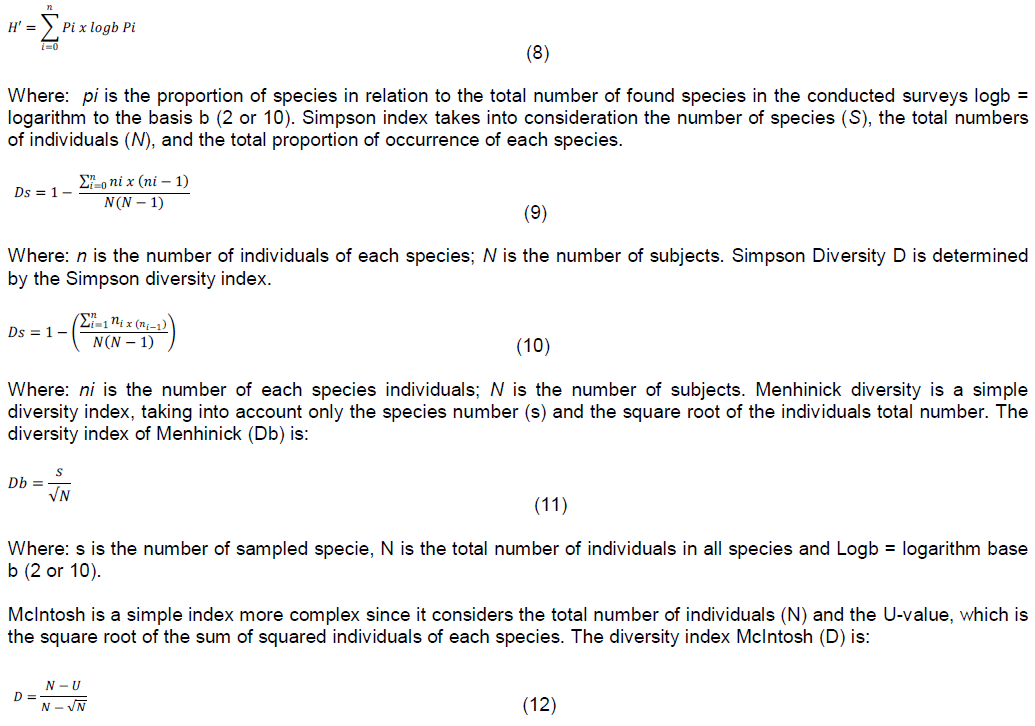
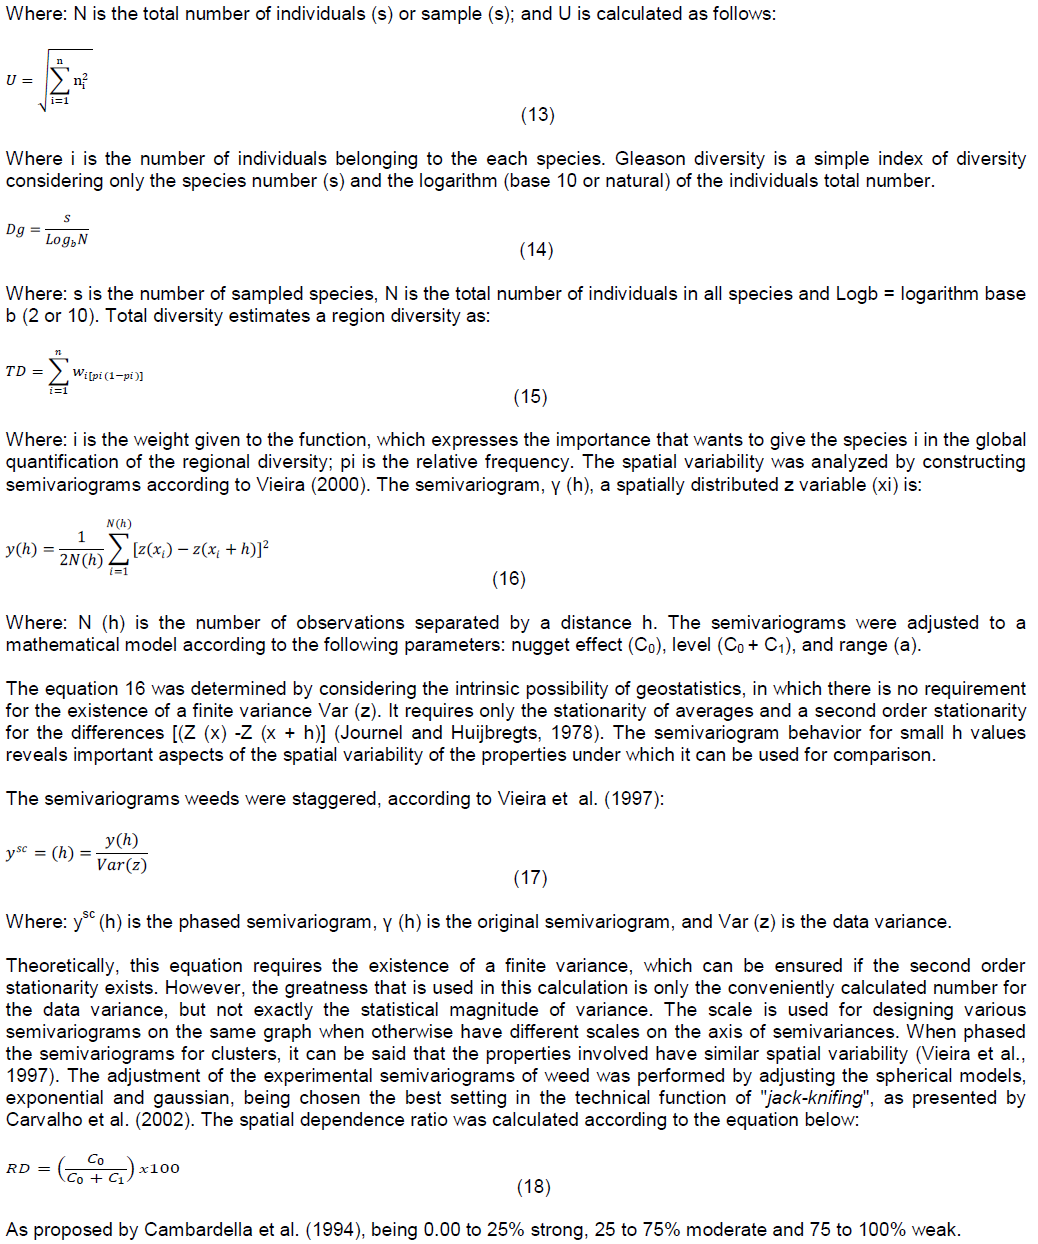
 MATERIALS AND METHODS

The study area has 0.5 ha (50 m x 100 m), and is located at the Goiano Federal Institute - Campus Urutaí (17°27’50’’ South and 48°12’10’’ West). The soil of the area is Rhodic Hapludox (USDA, 1999), managed under no-tillage since 2001, and the sampling time was cultivated with sunflower (Helianthus annuus L.) cultivate M-734. The climate, according to Köppen is Aw, with two well-defined seasons, dry in winter and humid in the summer, with average temperatures higher than 18°C during all months of the year.
 
The study area was divided into a sampling grid with 50 points with spacing of 5 m x 10 m. At each sampling point was randomly placed a circle of 0.5 m diameter (0.196 m2) for identifying the number of individuals per point, the number of species per point and the incidence of each type in each sampling point, by manual identification technique (Lutman and Perry, 1999).
 
The identification of the presented weeds in the area of study was performed using the Identification Manual and Weed Control (Lorenzi, 2000). The following weed species were identified: Cenchrus echinatus L.; Chamaesyce sp. (L.) Mill; Heliotropium indicum L.; Ipomoea triloba L.; Eleusine indica (L.) Gaertn and Bidens pilosa L. They were evaluated for their quantitative values for density, relative density, frequency, relative frequency, abundance,   relative   abundance   and relative  importance  index values, according to Mueller-Dombois and Ellenberg (1974).
 
 
Where: rel. freq= relative frequency, rel. abund=relative abundance and rel. density=relative density. Biodiversity indexes were obtained by Species Diversity program (DivEs 3.0.7) (Rodrigues, 2015). The Shannon-Wiener Index is suitable for random samples of species of an interested community or sub-community.


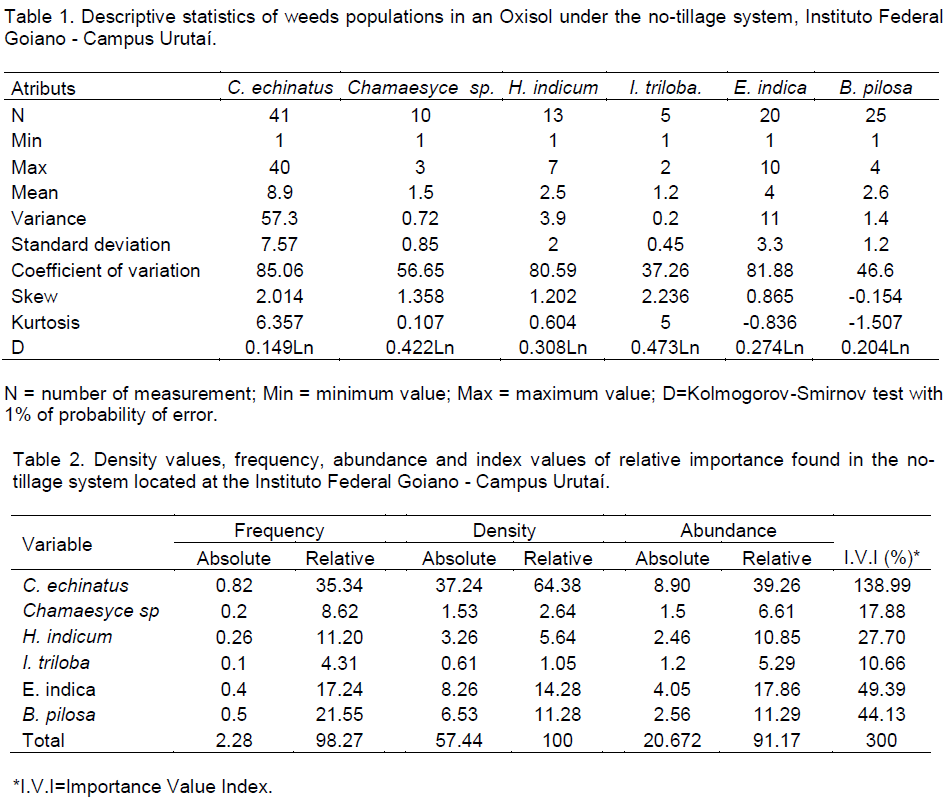
 RESULTS AND DISCUSSION

All the studied weeds species presented frequency distribution of lognormal type (Table 1). According to Carvalho et al. (2002), skewness and kurtosis values near to 0 and 3 are indicative of a normal frequency distribution. In this case, the elevated values of skewness and kurtosis confirm the presence of log-normal distribution. However, B. pilosa and E. indica obtained skewness and kurtosis respectively below zero, in which case these two species probably have no log-normal distribution. According to Johnson et al. (1996) and Wiles et al. (1992), negative distributions as well as the aggregate behavior variables are typical weeds. 
 
 
According to Warrick and Nielsen (1980), the number of rating individuals, C. echinatus, H. indicum and E. indica indicates a high coefficient of variation values (CV ≥ 60%), the other variables had moderate CV values. The species, C. echinatus was the most common weed in the area of study, occurring in 41 of the 50 sampling points, and I. triloba was the lower frequency species found only in 5 sampling points (Table 1).
 
It was found that three species of plants presented greater frequency, density, abundance and relative importance value. C. echinatus presented relative frequency (35.34), specific gravity (64.38), relative abundance (39.26) and relative importance index (138.99). B. pilosa was obtained for relative frequency (21.55), relative density (11.28), relative abundance (11:29) and relative importance index (44.13). Also, the grass E. indica indicated relative frequency (17.24), relative density (14.28), relative abundance (17.86) and relative importance index (49.39) (Table 2).
 
The coefficients of variation (CV%) for the diversity indexes are considered low, ranging from 0.293 to Menhinick index to 0.670 for McIntosh. The asymmetry parameter for the contents of D. Simpson, Simpson, Shannon, Menhinick, McIntosh and Margalef showed values lower than 0.5 which, according to Webster and Olivier (1990) who indicates normal distribution.
 
In this case, only the total diversity and Gleason index had values that did not follow a normal distribution (-0.851 and 1.592 respectively) (Table 3).
 
The linear correlation matrix (Table 4) demonstrate that among H. indicum x E. indica  (r  =  0.816),  H.  indicum x Shannon index (r = 0.797), Simpson index x Shannon index (r= 0.873), Simpson index x Menhinick index (r = 0.765), Simpson index x McIntosh index (r= 0.985), Simpson index x Margalef index (r = 0.827), Simpson index x Gleason index (r= 0.684), Shannon index x McIntosh index (r = 0.793), Shannon index x Margalef index (r= 0.824), index Menhinick x McIntosh index (r = 0.814), Menhinick index x Margalef index (r= 0.838), Menhinick index x Gleason index (r = 0.941), McIntosh index x Margalef index (r= 0.809 ), McIntosh index x Gleason index (r = 0.764) and index Margalef x Gleason index (r= 0.758) there is a high linear correlation according to Santos (2007) classification. The other correlations are considered low (| r | = 0.1-0.5) or zero (| r | = <0.1).
 
The presence of negative linear correlation for the vast majority of species with C. echinatus (C. echinatus x Chamaesyce sp = -0.162; C. echinatus x I. triloba = -0.783; C. echinatus x E. indica = -0.170; C. echinatus x B. pilosa = -0,371) indicating the superiority of the grass, C. echinatus in the colonization process of the area of study in relation to another weed species, this is confirmed when we analyze the occurrence of each weed species in 50 sampling points (Table 1).
 
The geostatistical analysis presented that the species, H. indicum and I. triloba showed pure nugget effect, as well as the Shannon diversity indexes, Menhinick, Margalef and Gleason (Table 5). According to Vieira (2000), the presence of nugget effect is mainly because of the spacing used, which was not enough to detect the spatial variability between the samples.
 
However, the presence of pure nugget effect for H. indicum and I. triloba is mainly because these two weed species are not common in the area of study, as evidenced by the number of sampled individuals (Table 1).
 
The spherical model was the most adjusted one to the weed plants data, corroborating to other studies that describe this model as the most adjusted one with soil and plant data (Cambardella et al., 1994; Vieira, 2000; Chiba  et  al.,  2010;  Siqueira  et al., 2015), excepting the grass, C.echinatus that echinatus that set  the  gaussian  model. In  biodiversity,   indexes   were   the   exponential model (D Simpson,  Simpson  Diversity,  McIntosh diversity), with the exception of the total diversity that adjusted to the spherical model (Table 5).
 
 
Several studies have reported that some weed species are aggregated or occur in reboilers, so the infestation mapping of the agricultural area enables located management application. That's because when the areas are mapped with the occurrences, they also know other aspects of weeds, such as the degree of infestation, contagiousness, species present and edaphoclimatic relations (Wiles et al., 1992; Jonhnson et al., 1996; Schaffrath et al., 2007). C. echinatus had high values of nugget effect (C0, Table 5). Siqueira et al. (2008) pointed out that the nugget effect values represent the spatial variation not detected in the sampling process, indicating that if the spacing was shorter it would be possible to detect other patterns of variability thanks to this attribute. The grass, C. echinatus had the higher range value (a = 38.00 m) and B. pilosa had the lowest range value (a = 20.00 m).
 
For the biodiversity reach indexes, the highest value was the total diversity (30.70 m). Siqueira et al. (2015) studying the variability of weed found a range between 40 and 210 m. The spatial dependence reason was calculated according to Cambardella et al. (1994), was high for Chamaesyce sp., E. indica, B. pilosa, Simpson (D), Simpson diversity and McIntosh Diversity (RD = 0.0 to 25%), medium for C. echinatus and Total diversity (RD = 25-75%).
 
Figure depicted the phased semivariogram. In Figure 1A, the total diversity, as well as the Margalef index exhibit greater dispersion when compared to the other indexes. Similarly, Chamaesyce sp, H. indicum and I. triloba presents great dispersion in the semivariance pairs in a short distance and upon the increasing of the distance (Figure 1B). The other variables that presented spatial variability had the same spatial behavior.
 
The spatial variability map for the diversity of Simpson and Shannon full diversity which weeds species are present throughout the study area occurred with greater intensity on the left side of the sampled area (Figure 1C). In general, all kinds of weeds present in the area showed spatial variability, with the exception of I. triloba and H. indicum.
 
The weed species presented distribution in “reboilers”. The range of values (a) showed that the space between the samples can be extended to all weed species. It was not possible to determine specific areas of management in the studied area since different species of weed infested plots of the area.


 CONFLICT OF INTERESTS

The author has not declared any conflict of interest. 


 ACKNOWLEDGMENTS

The authors would like to thank SECTI (Secretariat of Science, Technology and Innovation of Maranhão) and FAPEMA (Maranhão Foundation for the Protection of Research and Scientific and Technological Development, Brazil) financial support for publication (APCINTER-02587/14, BATI-02985/14, UNIVERSAL-00735/15, BEPP-01301/15, APEC 01697/15, BM-01267/15 and BD-01343/15).


 REFERENCES

Bressan GM, Koenigkan LV, Oliveira VA, Cruvinel PE, Karam D (2006). Sistema de classificação fuzzy para o risco de infestação por plantas daninhas considerando a sua variabilidade espacial. Planta Daninha 24(2):229-238.
Crossref


Calado JMG, Baschi G, Barros JFC, Carvalho M (2013). Weed management in winter wheat (Triticum aestivum L.) influenced by different soil tillage systems. 8(21):2551-2558.


Cambardella CA, Mooman TB, Novak JM, Parkin TB, Karlem DL, Turvo RF, Konopa AE (1994). Field scale variability of soil properties in central Iowa soil. Soil Sci. Am. J. 47:1501-1511.
Crossref


Carvalho JRP, Silveira PM, Vieira SR (2002). Geoestatística na determinação da variabilidade espacial de características químicas do solo sob diferentes preparos. Pesqui. Agropecu. Bras. 37(8):1151-1159.
Crossref


Chiba MK, Filho OG, Vieira SR (2010). Variabilidade espacial e temporal de plantas daninhas em Latossolo Vermelho argiloso sob semeadura direta. Acta Sci. Agron. 32(4):735-742.
Crossref


Domingos MKR, Laca-Buendia JP (2010). Levantamento fitossociológico das plantas daninhas na pré-colheta da cultura do sorgo granífero em Uberaba/MG. FAZU Rev. 7:68-72.


Goel PK, Prasher SO, Landry JA, Patel RM, Bonnell RB, Viau AA, Miller JR (2003). Potential of airborne hyperspectral remote sensing to detect nitrogen deficiency and weed infestation in corn. Comput. Electronics Agric. 38:99-124.
Crossref


Johnson GA, Mortensen DA, Young LJ, Martin AR (1996). Parametric sequential sampling on multistage estimation of the negative binomial parameter k. Weed Sci. 44(4):555-559.


Journel AG, Huijbregts CJ (1978). Mining geostatistics. London, Academic Press, 600 p.


Lacerda ALS, Victoria Filho R, Mendonça CG (2005). Levantamento do Banco de Sementes em dois Sistemas de Manejo de Solo Irrigados por Pivô Central. Planta Daninha 23(1):1-7.
Crossref


Lorenzi H (2000). Manual de identificação e controle de plantas daninhas: Plantio direto e convencional. 5.ed, Nova Odessa: Plantarum. 384 p.


Lutman PJW, Perry NH (1999). Methods of weed patch detection in cereal crops, In: The 1999 Brighton Conference – Weeds, Brighton 1999, Proceedings, Brighton: BCPC. pp. 627-634.


Monquero PA, Amaral LR, Binha DP, Silva PV, Silva AC, Martins FRA (2008). Mapas de infestação de plantas daninhas em diferentes sistemas de colheita da cana-de-açúcar. Planta Daninha 26(1):47-55.
Crossref


Mortensen DA, Dielemann JA, Johnson GA (1998). Weed spatial variation and weed management. In: Hatfield JL, Buhlerard DD, Stewart BA (Eds.). Integrated Weed and Soil Management. Ann Arbor Press, Chelsea, MI, pp. 293-309.


Mueller-Dombois D, Ellenberg HA (1974). Aims and methods of vegetation ecology. New York: John Wiley. 547 p.


Rodrigues ACP, Costa NV, Cardoso LA, Campos CF, Martins D (2010). Períodos de interferência de plantas daninhas na cultura do sorgo. Planta Daninha 28(1):23-31.
Crossref


Rodrigues WC (2015). DivEs - Diversidade de Espécies v3.0 - Guia do Usuário. Entomologistas do Brasil. 33 p. 2015. Disponível em: http://dives.ebras.bio.br


Santos CMA (2007). Estatística Descritiva – Manual de auto-aprendizagem; Edições Sílabo.


Schaffrath VR, Tormena CA, Gonçalves ACA, Junior RSO (2007). Variabilidade espacial de plantas daninhas em dois sistemas de manejo de solo. Rev. Bras. Engenharia Agrícola Ambient. 11(1):53-60.


Shiratsuchi LS, Molin JP, Christoffoleti PJ (2004). Mapeamento da distribuição espacial da infestação de Panicum maximum durante a colheita da cultura de milho. Planta Daninha 22(2):269-274.
Crossref


Shiratsuchi LS, Fontes JRA, Resende AV (2005). Correlação da distribuição espacial do banco de sementes de plantas daninhas com a fertilidade dos solos. Planta Daninha 23(3):429-436.
Crossref


Siqueira GM, Dafonte DJ, Valcárcel AM (2015). Correlación espacial entre malas hierbas en una pradera y su relación con la conductividad eléctrica aparente del suelo (CEA). Planta Daninha 33(4):631-641.
Crossref


Siqueira GM, Vieira SR, Ceddia MB (2008). Variabilidade espacial de atributos físicos do solo determinados por métodos diversos. Bragantia .67(1):203-211.
Crossref


USDA (1999). United States Department of Agriculture –Soil taxonomy: a basic system of soil classification for making and interpreting soil surveys. Washington. 871 p.


Vieira SR (2000). Geoestatística em estudos de variabilidade espacial do solo. In: Novais RF, Alvarez VH, Schaefer GR (Eds.). Tópicos em Ciência do solo. Viçosa: Soc. Bras. Ciênc. Solo 1:1-54.


Vieira SR, Tillotson PM, Biggar JW, Nielsen DR (1997). Scaling of semivariograms and the kriging estimation of field-measured properties. Rev. Bras. Ciênc. Solo .21:525-533.
Crossref


Warrick AW, Nielsen DR (1980). Spatial variability of soil physical properties in the field. In: Hillel D (Ed.). Applications of soil physics, New York: Academic Press.
Crossref


Webster R, Olivier MA (1990). Statistical methods in soil and land resource survey. Oxford, Oxford University Press. 316 p.


Wiles LJ, Oliver GW, York AC, Gold HJ, Wilkerson GG (1992). Spatial distribution of broadleaf weeds in North Carolina soybean (Glycine max) fields. Weed Sci. 40(5):554-557.


          */?>