Full Length Research Paper

ABSTRACT
The African maize stem borer (Busseola fusca) is one of the important biotic constraints for maize production in sub-Saharan African. This study determined the spatial distribution and sampling sizes for African maize stem borer in Southern Ethiopia. Twenty four maize farms were visited in 12 localities at three growth stage of maize. Data were collected on the number of infested and not-infested plants, and the number of larvae and pupae. There were variations in the levels of infestations and population density of B. fusca in the study areas and years. Percent infestation at mid-whorl stage of maize ranged from 13.6 to 25.9% and 19.5 to 41.4% in 2015 and 2016, respectively. Infestation increased through time and at harvesting stage reached ranges of 36.8 to 68.8% in 2015 and 65.5 to 80.7% in 2016. The optimal sample size for four fixed precision levels of 0.10, 0.15, 0.20 and 0.25 were estimated with Iwao’s regression coefficients. The distribution pattern of B. fusca varied between maize growth stages, locations and years. At mid-whorl stage of maize, B. fusca infested plants were aggregated but in both at silking and harvesting stage uniformly distributed. At mid-whorl as well as silking stage of maize B. fusca larvae were aggregated. But, larvae at harvesting stage and pupae in both silking and harvesting stages of maize were randomly distributed. For 10% infestation, which is considered as action threshold level for stem borers management on maize, 22 sampling units (660 plants) at the precision of 20% are required.
Key words: Busseola fusca, maize, spatial distribution, sample size, precision level.
INTRODUCTION
Maize (Zea mays L.) is one of the main food and feed crops in Ethiopia and worldwide (FAO, 2018). In Africa, maize is among the most important field crop providing food, feed and fuel (Smale et al., 2011). Ethiopia is the fourth largest maize producing country in Africa, and first in the East African region (FAO, 2018). Maize is mainly grown in Oromia, Amhara, Southern Nations, Nationalities, and Peoples' Region (SNNPR), and Tigray (CSA, 2017/2018). In SNNPR, the average productivity of maize is 3.8 t/ha (CSA, 2017/18) which is slightly less than the national average yield of 3.9 t/ha (CSA, 2017/2018) but much lower than the world average of 5.8 t/ha (USDA, 2018). The low productivity of maize could be attributed to many abiotic and biotic factors (Getu et al., 2001; Desalegn et al., 2012; Tilahun et al., 2012).
Among the biotic factors, insect pests, particularly stem borers are responsible for the low yield of maize crop (Getu et al., 2001; Wale et al., 2006). Yield losses in Ethiopia due to stem borers vary with agroecology, but generally range from 15 to 100% depending on infestation by the pest species, crop and crop growth stage attacked (Wale et al., 2006). In East Africa, the noctuid Busseola fusca (Fuller) and the crambid Chilo partellus (Swinhoe) are the most important insect pests associated with maize (Mwalusepo et al., 2015). The two lepidopterous stem borers are economic pests of maize in Ethiopia (Wale and Ayalew, 1993; Wale al et., 2006). Gebre-Amlak (1985) reported that C. partellus was a predominant species at low elevation (less than 1700 m) and B. fusca was dominant at elevations between 1160-2600 m.a.s.l. and cooler areas of Ethiopia.
Spatial distribution is one of the characteristic properties of insect populations; in most cases, it allows us to define them, and is a typical trait in insect populations and is an important characteristic of ecological communities (Debouzie and Thioulouse, 1986). Understanding the distribution and phenology of insects in a different environment is important to plan management practices (Searle et al., 2013). No field sampling can be efficient without understanding the underlying spatial distribution (Taylor, 1984). Spatial distribution allows for the estimation of densities and in turn forms the basis for deciding on pest management programs (Khaing et al., 2002). The appropriate sampling pattern depends on the spatial distribution of the insect or disease (Lin et al., 1979). Insect populations may follow a random, uniform or aggregate distribution, but the degree of aggregation often varies among the population and species (Root and Cappuccino, 1992). The spatial distribution of stem borers varies among and within-host plants possibly due to their suitability for oviposition and larval development (Addo - Bediako and Thanguane, 2012).
Management method cannot be implemented effectively without accurate estimates of insect population and its effects on yield (Nabil, 2010). To estimate insect density, sampling time, sampling unit and sampling size are crucial (Southwood and Henderson, 2000). The number of samples size and units could be varied with insects being sampled, their distribution patterns (Southwood and Henderson, 2000); purpose of sampling, infestation pattern, severity and economic considerations (Frisbie and Whorter, 1986). Too few sample sizes will reduce the value of the estimate (Vlug and Paul, 1986) and too many will increase the cost of the program (Blackshaw and Hicks, 2013). Therefore, the present study was designed to determine the spatial distribution patterns and the sampling size for monitoring of B. fusca on maize.
MATERIALS AND METHODS
Study areas
The study was conducted in Wolaita, Sidama and Gurage zone (Table 1) which are found in southern Ethiopia during 2015 and 2016 main cropping seasons (May- October). The number of districts, localities, sampling farms, sampling plots and plants in each zone are described in Table 2. Districts and localities were selected based on road accessibility and intensity of maize production.


Sampling procedures
In this study, twenty four maize farms in 12 localities having similar inputs and management practices were covered. The farms did not receive any insecticide treatment and grew the popular maize varieties BH540 and Shone. In each maize farm five sampling spots with a size of 9m2 each were measured in ‘X’ pattern at mid-whorl, silking and harvesting stages of maize. In each spot, the total number of plants (30 plants on the average) and those infested by stem borers (characterized by dead heart, scarified leaves, and larval entry and exit holes in stems, the presence of frass) were recorded and percent of infestation (%) calculated using the formula  Where, IP = infested plants, TP = total plants. When infestations were observed, ten plants were randomly selected from each spot and dissected to record the number of larvae and pupae. The same fields were used for samplings at different stages of maize.
Spatial distribution pattern determination
The spatial distribution pattern of B. fusca was determined by using four indices, namely Taylor’s power law, Iwao’s mean crowding regression, Lloyd's mean crowding, and index of dispersion. Percent of infested plants and numbers of insects per spot were used.
Taylor’s power law (1984)
Log (S2) = a +blog ( ), where S2 is the variance, is sample mean, a is intercept and b is the slope. When b=1, b < 1 and b> 1 the distribution is random, uniform and aggregated, respectively.
Iwao’s regression (1968)
Iwao’s regression method was used to quantify the relationship between mean crowding index (X*) and mean density (m) using by solving the following equation: X* =α+β Where α indicates the tendency to crowding (positive) or repulsion (negative) and β =1, β < 1 and β > 1 the distribution is random, uniform and aggregated, respectively.
Index of dispersion (S2/and Z)
S2/variance (S2) to mean () ratio was calculated and values 1 random, < 1 uniform and > aggregated distribution. The index of dispersion (ID); ID = (n-1) S2/, where n denotes the number of samples. The index was tested by Z value as follows:  where v = n -1 if 1.96 >= Z > - 1.96 and the distribution is random but if Z < - 1.96 or Z > 1.96, it would be uniform and aggregated, respectively (Patil and Stiteler, 1978).
Lloyd’s means crowding (1967)
X* = +S2/-1, where S2 is variance and is the sample mean. To remove the effect of changing in density, the ratio of mean crowding to the mean was used and X*/ =1 random, <1 uniform and >1 aggregated
Sample size determination
At mid-whorl stage of maize, the number of required sampling units per field were determined using proportion of infested plants and Kuno (1969) formula n = (a+1/+β-1)/D2, Where n = number of sampling units; means of infestation; a and β are coefficients obtained from Iwao’s regression, D = precision level. The allowable precision levels (10, 15, 20 and 25 %) in ecological research (Southwood and Henderson 2000) were used.
Data analysis
B. fusca distribution indices were generated by using SPSS 21.0 software. Mean of B. fusca infestation, larvae and pupae in each zone, maize growth stage and year ware analysis using SPSS software. The count and percent data were transformed using square root and arcsine, respectively.
RESULTS
Levels of infestations and population density of B. fusca larvae and pupae
There were variations in the levels of infestations and population density of larvae and pupae in the different study locations and years (Table 3). Percent infestation by B. fusca at mid-whorl stage of maize ranged from 13.7 to 25.9% and 19.4 to 41.4% in 2015 and 2016, respectively. The level of infestation increased through time and at harvesting stage reached to ranges of 36.8 to 68.8% in 2015 and 65.5 to 80.7% in 2016. The numbers of larvae were higher at mid-whorl stage (4.14 to 5.8 / plant in 2015 and 4.05 to 7.7 /plant in 2016) than the subsequent stages of maize. Pupae were recovered starting the silking stage of maize and there were 0.5 to 1.14 and 0.7 to 1.55 pupae per plant in 2015 and 2016, respectively.

Distribution of infested maize plants with B. fusca
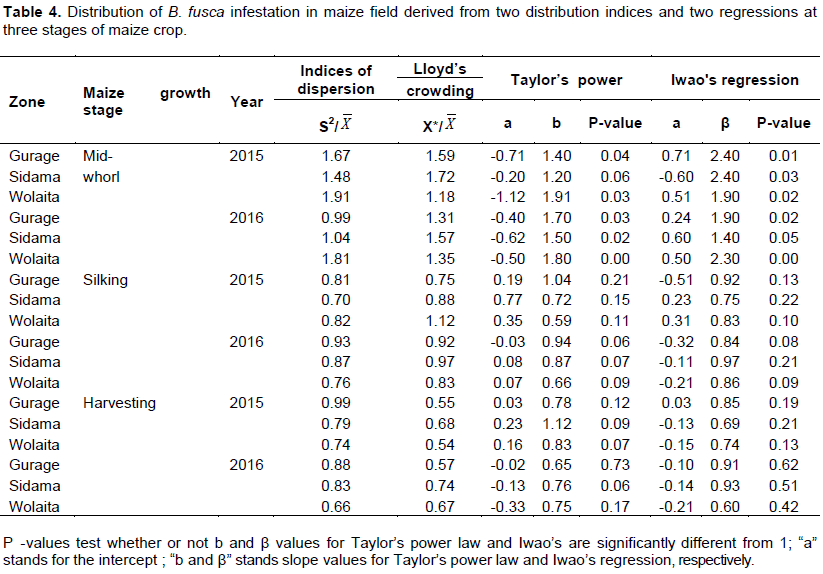
In both years, at mid-whorl stage the index of dispersion and Lloyd's mean crowing (S2/and X*/) for percent number of infested plants were greater than one and the coefficients of Taylor’s power law (b) and Iwao’s patchiness regression (β) were significantly greater than one (Table 4). Index of dispersion (S2/) ranged from 0.99 to 1.81; Lloyd's mean crowing (X*/) from 1.18 to 1.72; coefficients of Taylor’s power law (b) from 1.10 to 1.91 and Iwao’s regression (β) from 1.40 to 2.40; whereas at silking as well as maturity stage of maize, all the distribution indices were less than one. The study showed that at the mid-whorl stage of maize, the distribution pattern of B. fusca infestation was aggregated and uniform at both silking and harvesting stages of maize.
Distribution of B. fusca larvae at mid-whorl stage of maize
During the study periods, B. fusca was the only stem borer species recorded in the three zones of the study areas. In both years, at the mid-whorl stage of maize, the index of dispersion (S2/) for B. fusca larvae was greater than one (1.46 to 2.64); Z value was greater than 1.96 and Lloyd’s mean crowding (X*/) ranged from 1.10 to 1.51 (Table 5). The coefficients of Taylor’s power law (b) and Iwao’s (β) were significantly greater than one and ranged from 1.82 to 3.88 and 1.14 to 1.7, respectively. All the dispersion values indicated that at the mid-whorl stage of maize B. fusca larvae had an aggregated distribution.

Distribution of B. fusca larvae and pupae at silking stage of maize
Similar to mid-whorl stage, at silking stage of maize, B. fusca larvae distribution indices (S2/and X*/) were greater than one; Z values greater than 1.96; Taylor power and Iwao coefficients were significantly greater than one (Table 5). In both years, the index of dispersion (S2/) ranged from 1.24 to 2.30; (Z) from 1.87 to 3.20; Lloyd's mean crowing (X*/) ranged 1.08 to 1.52 and the Taylor power coefficients (b) ranged from 1.21 to 3.54. The slopes of the regression lines for Iwao’s mean crowding regression were also numerically greater than one, ranged from 1.2 to 1.4. The dispersion values indicated that B. fusca larvae were aggregated at silking stage of maize. Index of dispersion (S2/) of pupae ranged from 0.84 to 1.26; with (Z) values from 0.90 to 1.31; Lloyd's mean crowing (X*/) ranged from 0.82 to 1.30 and coefficients of Taylor’s power law (b) ranged from 0.94 to 1.34 (Table 6). The slopes of the regression of Iwao’s were near to one and ranged from 0.89 to 1.24. All the indices indicated that at silking stage of maize B. fusca pupae had a random distribution.

Distribution of B. fusca larvae and pupae at harvesting stage of maize
Unlike mid-whorl and silking stages, at harvesting stage of maize B. fusca larvae distribution indices (S2/and X*/) were near to one; Z values less than 1.96; Coefficients Taylor power (b) and Iwao values (β) were not significantly different from one (Table 5 and 6). The larvae index of dispersion (S2/) ranged from 0.97 to 1.26; Z values from 1.08 to 1.43; Lloyd's mean crowding (X*/) from 0.99 to 1.38 and Taylor power coefficients (b) ranged from 1.0 to 1.36 (Table 5). Similarly, the slopes of the regression lines of Iwao’s regression (β) were not significantly greater than one and ranged from 1.01 to 1.20. The index of dispersion (S2/) for pupae ranged from 0.93 to 1.21 with (Z) values from 0.90 to1.53; Lloyd’s mean crowding (X*/) ranged from 0.86 to 1.15 and the coefficients of Taylor’s power law (b) ranged from 0.68 to 1.32; Iwao’s coefficients (β) from 0.82 to 1.09 (Table 6). These results indicate that in both years, the distribution of B. fusca larvae and pupae at harvesting stage of maize was random.
Sampling size based on percent infestation of maize at mid-whorl stage
Sample size estimates were similar for the two years. The required sample units to estimate 5 to 30% mean infestation of maize by B. fusca ranged from,101 - 73, 45 - 32, 25-18 and 16 to 12 in 2015 and 104-76, 42-30, 26-19 and 17 to 12 in2016, for 10, 15, 20 and 25% precision, respectively (Figure 1). For 10% infestation, which is considered as action threshold level for stem bores management on maize, 85, 38, 22 and 14 sampling units were required for 10, 15, 20 and 25% precision, respectively.

DISCUSSION
Infestation of maize with B. fusca was aggregated at mid-whorl stage but uniform at silking and maturity stage of maize. B. fusca larvae were aggregated at both mid-whorl and silking stage of maize. The aggregated distribution pattern of distribution pattern during season could be caused by changes in population density or movement of larvae. Busseola fusca females oviposit a highly variable number (from 100 up to 800) of round and flattened eggs in batches (Kruger et al., 2012); larvae migrate to neighboring plants throughout the larval stages (Van Rensburg et al., 1987; Calatayud et al., 2014). Sun and Du (1991) reported that rice stem borer (Chilo suppressalis) larvae have an aggregated distribution pattern the active seasons but the dispersal rate of larvae in changes with developmental stages. The numbers of the required sampling units are dependent upon the insects being sampled, their distribution patterns, and other factors (Pedigo and Van Schaik, 1984). The required sampling size typically increased with higher precisions and for lower levels of infestations. An action threshold for B. fusca 10% infested plants has been recommended (Ong’amo et al., 2016; Van Rensburg et al., 1988). For 10% infestation 14 to 85 sampling units were required for precision ranges of 10 to 25%. A 25% level of precision is acceptable for scouting programs (Southwood, 1978). Taking a higher precision of 20%, for the 10% infestation 22 sampling units (660 plants) are required. In this study the required sample units were estimated with Kuno (1969)’s method which is based on Iwao’s patchiness regression. Many studies used Taylor’s power to estimate sample sizes. The Taylor’s method reduces the necessary sample size when compared with Iwao’s method (Darbemamieh et al., 2011; Ifoulis and Savopoulou-Soultani, 2006). Hence, the sample size recommended in this study could be considers as optimum.
Techniques of scouting which are easy to follow, save time and effort, and avoid needless insecticide applications are required. Although various studies have established the relationship between density of larvae of stem borers and yield loss in maize, count of larvae which employs destructive sampling is time consuming and not feasible to scout and decide on the management of stem borers. Van Rensburg and Pringle (1989) developed a sequential sampling method for egg surveys (based on the negative binomial distribution) and the method saved on time and effort required for sampling while allowing for more timely application of insecticides. We used presence and absence of infestation on maize by the stem borer which is easy to execute in the field.
This study concludes that, stem borer, B. fusca is a major constraint for the production of maize in southern Ethiopia. B. fusca has not one type of distribution pattern for all of its life stages. Infestation of maize with B. fusca is aggregated at mid-whorl stage but uniform at silking and maturity stage of maize. B. fusca larvae had an aggregated pattern at both mid-whorl and silking stage of maize and random at harvesting stage. At silking and harvesting stage of maize the distribution pattern of B. fusca pupa is random. The required sampling size typically increased with higher precisions and for lower levels of infestations. For 10% infestation, which is considered as action threshold level for stem borers management on maize, 22 sampling units (660 plants) at the precision of 20% are required.
CONFLICT OF INTERESTS
The authors have not declared any conflict of interests.
ACKNOWLEDGEMENT
Funding for this project was provided by the Ethiopian Ministry of Education for which the authors express their appreciation.
REFERENCES
|
Addo-Bediako A, Thanguane N (2012). Stem borer distribution in different sorghum cultivars as influenced by soil fertility. Agricultural Science Research Journal 2:189-194. |
|
|
Blackshaw RP, Hicks H (2013). Distribution of adult stage of soil insect pests across an Agricultural landscape. Journal of Pest Science 86:53-62. |
|
|
Calatayud PA, Le Ru BP, Van Den Berg J, Schulthess F (2014). Ecology of the African maize stalk borer, B. fusca with special reference to insect-plant interactions. Insects 5:539-563. |
|
|
CSA (Central Statistical Agency) (2017/18). Agricultural Sample Survey. Report on Area and Production of Major Crops for Private Peasant Holdings, Meher Season. April 2017, Addis Ababa. |
|
|
Darbemamieh M, Fathipour Y, Kamali K (2011). Population abundance and seasonal activity of Zetzellia pourmirzai (Acari: Stigmaeidae) and its preys Cenopalpus irani and Bryobia rubrioculus (Acari: Tetranychidae) in sprayed apple orchards of Kermanshah, Iran. Journal of Agricultural Science and Technology 13:143-154 |
|
|
Debouzie D, Thioulouse J (1986). Statistics to find spatial and temporal structures in populations. In: Mangel M (ed) Pest control: operations and system analysis in fruit fly management 11 NATO ASI Series pp. 263-282. |
|
|
Desalegn T, Fekadu W, Zewudie K, Worku W (2012). Weed management research on maize in Ethiopia. In: Worku M, Twumasi-Afriyie S, Wolde L, Tadesse B, Bogale G. & B.M. (Eds.). Meeting the Challenges of Global Climate Change and Food Security through Innovative Maize Research.Proceedings of the 3rd National Maize Workshop of Ethiopia. 18-20 April 2011, Addis Ababa, Ethiopia pp. 128-133. |
|
|
FAO (2018). Food loss analysis: causes and solutions - Case study on the maize value chain in the Federal Democratic Republic of Ethiopia. Rome 46 p. |
|
|
Frisbie RE, Whorter GM (1986). Implementing a state-wise pest management program for Texas, U.S.A.In: Advisory Work in Crop Pest and Disease Management. Eds.Pai and R.Ausher Spring-Verlog.Pub.New York. pp. 234-262 |
|
|
Gebre-Amlak A (1985). Survey of lepidopterous stem borers attacking maize and sorghum in Ethiopia. Ethiopia Journal of Agricultural Science 7:55-59. |
|
|
Getu E, Overholt WA, Kairu E (2001). Distribution and species composition of stem borers and their natural enemies in maize and sorghum in Ethiopia. Insect Science and its Application 21:353-359. |
|
|
Ifoulis AA, Savopoulou-soultani M (2006). Developing Optimum Sample Size and Multistage Sampling Plans for Lobesia botrana (Lepidoptera: Tortricidae) Larval Infestation and Injury in Northern Greece. Journal of Economic Entomology 99(5):1890-1898. |
|
|
Khaing O, Hormchan P, Jamornmarn S, Wongpiyasatid A (2002). Spatial dispersion and optimum sample size for cotton bollworm, Helicoverpa armigera (Hubner) (Lepidoptera: Noctuidae) larvae on cotton. Kasetsart. Journal of Natural Science 36:235-241. |
|
|
Kruger M, van Rensburg JBJ, van den Berg J (2012). Reproductive biology of Bt-resistant and susceptible field-collected larvae of the maize stem borer, Busseola fusca (Lepidoptera: Noctuidae) African Entomology 20:35-43. |
|
|
Kuno E (1969). A new method of sequential sampling to obtain the population estimates with a fixed level of precision. Researches on Population Ecology 11(2):127-136 |
|
|
Lin CS, Poushinsky G, Mauer M (1979). An examination of five sampling methods under random and clustered disease distribution using simulation. Canadian Journal of Plant Science 59:121 - 130. |
|
|
Lloyd M (1967). Mean Crowding. Journal of Animal Ecology 36:1-30. |
|
|
Mwalusepo S, Tonnang HE, Massawe ES, Okuku GO, Khadioli N, Johansson T, Calatayud PA, Le Ru BP (2015). Predicting the impact of temperature change on the future distribution of maize stem borers and their natural enemies along East African mountain gradients using phenology models. |
|
|
Nabil EE (2010). Insect economic levels in relation to crop production. Archives of Phytopathology and Plant Protection 43(17):1710-1744 |
|
|
Ong'amo G, Khadioli N, Mujica N, Carhuapoma P (2016). Maize stalk borer, Busseola fusca (Fuller). In: Pest distribution and risk atlas for Africa. Potential global and regional distribution and abundance of agricultural and horticultural pests and associated bio control agents under current and future climates. International Potato Center (CIP). |
|
|
Patil GP, Stiteler WM (1978). Concepts of aggregation and their quantification: Criteria review with some new results and applications. Research on Population Ecology 15:238-254. |
|
|
Pedigo LP, van Schaik JW (1984). Time-sequential sampling: a new use of the sequential probability ratio test for pest management decisions. Bulletin of Entomology Society of America 30:32-36. |
|
|
Root RB, Cappuccino N (1992). Patterns in population change and the organization of the insect community associated with goldenrod. Ecosystem Monitoring 62:393-420. |
|
|
Searle KR, Blackwell A, Falconer D, Sullivan M, Butler A, Purse BV (2013). Identifying environmental drivers of insect phenology across space and time: Culicoides in Scotland as a case study. Bulletin of Entomological Research 103(02):155-170. |
|
|
Smale M, Byerlee D, Jayne T (2011). Maize revolutions in Sub- Saharan Africa. The World Bank |
|
|
Southwood TR (1978). Ecological methods, with particular reference to the study of insect populations. 2nd edn. London, Chapman & Hall. 524 pp. |
|
|
Southwood TR, Henderson PA (2000). Ecological Methods, 3rd edition. Blackwell Sciences, Oxford. 592 p. |
|
|
Sun JZ, Du ZW (1991). Studies on the spatial pattern of striped stem borer, Chilo suppressalis, and larvae in paddy fields. Acta Entomologica Sinica 34:303-310. |
|
|
Taylor LR (1984). Assessing and interpreting the spatial distribution of insect populations. Annual Review of Entomology 29:321-357. |
|
|
Tilahun T, Wegary D, Demissie G, Negash M (2012). Maize pathology research in Ethiopia in the 2000s: A review. In: Worku, M., Twumasi-Afriyie, S., Wolde, L., Demissie, G., Bogale, and Prasanna, B.M. (Eds.). Meeting the Challenges of Global Climate Change and Food Security through Innovative Maize 23. Research. Proceedings of 3rd National Maize Workshop of Ethiopia. 18-20 April 2011, Addis Ababa, Ethiopia, pp. 193-202. |
|
|
USDA (United State Department of Agriculture) (2018). World agricultural production. December 2018 |
|
|
Van Rensburg JBJ, Giliomee JH, Walters MC (1988). Aspects of the injuriousness of the maize stalk borer, Busseola fusca (Fuller) (Lepidoptera: Noctuidae). Bulletin of Entomological Research 78:101-110 |
|
|
Van Rensburg JBJ, Walters MC, Gillome JH (1987). Ecology of the maize stalk borer, Busseola fusca (Fuller). Bulletin of Entomological Research 77:255-269. |
|
|
Van Rensburg JBJ, Pringle KL (1989). A sequential sampling technique for surveys of eggs laid by the maize stalk borer, Busseola fusca (Fuller) (Lepidoptera: Noctuidae). Journal of entomological Society of South Africa 52:223-228. |
|
|
Vlug HJ, Paul H (1986). Sampling leatherjacket. Announcements from the faculty of agricultural sciences. National University Ghent 51:939-942. |
|
|
Wale M, Ayalew G (1993). Determination of the relative abundance and dynamics of stem borer's species on sorghum. In: Proceedings of the joint conference EPC/CEE, 5-6 March 1992. Addis Ababa, Ethiopia. 26 p. |
|
|
Wale M, Schulthess F, Kairu EW, Omwega CO (2006). Distribution and relative importance of cereal stem borers and their natural enemies in the semi-arid and cool-wet ecozones of Amhara State of Ethiopia. International Journal of Entomology 42:389-402. |
|
Copyright © 2024 Author(s) retain the copyright of this article.
This article is published under the terms of the Creative Commons Attribution License 4.0


