Review

ABSTRACT
The increasing rate of disease incidence resulting from devastating effects of plant pathogens, limits crop productivity globally, thus affecting food security. The current global population growth with many mouths to feed is dependent on vibrant agricultural productivity. The effects of globalization, climate change, evolution of pathogens and vectors to mention a few, have combined to increase spread of invasive plant pathogens. Consequently, early detection of pathogens, accurate diagnosis and assessment and surveillance are imperative to predicting disease outbreaks and ample time to develop and apply appropriate mitigation measures for crop protection and enhanced productivity. Diagnosis is the process to determine cause of disease, while detection deals with knowing pathogen. Both disease diagnosis and pathogen detection are central to protecting crops and natural plant systems, as well as crucial prelude to undertaking prevention and management measures. Visual assessments of disease in plants populations are unreliable and subjective, arising from human limitations. Failure in pathogen detection and disease diagnosis lead directly to inadequate disease control and reductions in crop production and quality. Geographic Information Systems (GIS) and Digital Imaging (DI) have been applied in plant pathology to improve speed and accuracy of disease assessment, diagnostics and pathogen detection. These new technologies have assisted in collection and analysis of field data in ways that were not possible before advent of computer and thus, minimize human errors. This paper presents a brief review on application of both emerging technologies in plant disease diagnosis and detection.
Key words: Geographic information systems, imaging, plant disease, detection, diagnosis.
INTRODUCTION
Plant disease remains a major threat to global agriculture, accounting for about 10% reduction in crop yield (Strange and Scott, 2005). Broadly speaking, disease is defined as anything that adversely affects plant health. A conservative definition usually includes a persistent irritation, resulting in plant damage. In present context, it includes only those (living) things that replicate themselves and spread to adjacent plants to cause abnormalities. This includes such biological organisms as nematodes, fungi, bacteria, and viruses, which are sometimes referred to as pathogenic microorganisms. Their presence remains a challenge to plant health across the globe, especially resource-poor farmers in developing countries, whose limited resources are unable to deal with disease outbreaks (Mutka and Bart, 2015). Successful control of most plant diseases depends on early detection and accurate diagnosis. The terms diagnosis and detection were often used interchangeably. Diagnosis is the process of determining cause of a problem (disease) through careful examination; whereas detection is to find out pathogen responsible for disease (Kumar and Sreenivasulu, 2009). Diagnosis is as much an art as it is a science. The science deals with technology applied to detect pathogens; while art involves synthesis of information obtained from history case, symptoms and results of laboratory tests to determine pathogen that causes disease (Kumar et al., 2009). Diagnosis can be a long or short process, depending on diagnostician’s expertise and nature of problem. Once cause, is known an appropriate control strategy can be developed. Thus, inaccurate identification of disease and disease-causing agent, affect disease control measures and can lead to a waste of time and money and further plant losses. Therefore, proper disease diagnosis and early detection are vital in disease management to prevent the establishment and dispersal of pests and pathogens after introduction and to minimize subsequent impact (Cook and Madden, 2002; Myerson and Reaser, 2002).
PLANT DISEASE DIAGNOSIS METHODS
Visual assessment
Traditionally, plant disease diagnosis normally relies on symptoms recognition through visual observation and rating based on these symptoms and signs. Symptoms are physical characteristics of disease expressed by plant and include wilt, galls, cankers, rots, necrosis, chlorosis, and general decline; while signs are physical evidence of pathogen causing disease. Signs can include fungal fruiting bodies such as mushrooms or pycnidia, mycelia, bacterial slime, presence of nematodes or insects, or insect holes presence. Literature is replete with different assessment methods in plant disease diagnosis, including Large (1966), James (1971) Cobb (1892), Horsfall and Barratt (1945), Chester (1950). In addition, Stover (1983), Gauhl et al. (1993) and Nwauzoma et al (2008) have given further insight on diagnosis of Sigatoka leaf spot diseases of banana and other leaf spot diseases using visual assessment. Disease diagnosis based on symptoms is unreliable because different pathogens may cause similar symptoms as was Banana streak virus (BSV) case and Cucumber mosaic virus (CMV), resulting in considerable confusion (Wardlaw, 1961; Stover, 1972) and this is common with most foliar pathogens. Moreover, visual assessment depends on subjectivity of raters and often lack accuracy, reproducibility and traceability. Barbedo (2013), citing Bock et al. (2010) listed some shortcomings associated with visual assessment of disease symptoms:
1. Raters may get tired and lose concentration, thus decreasing their accuracy.
2. There can be substantial inter- and intra-rater variability (subjectivity).
3. There is a need to develop standard area diagrams to aide assessment.
4. Training may need to repeat to maintain quality. Raters are expensive.
5. Visual rating can be destructive if samples collected in field for assessment was later taken to laboratory.
6. Raters are prone to various illusions (for example, lesion number/size and area infected).
Microscopy
Usually, a plant pathology diagnostician relies on a combination of gross symptomatology and microscopic images to make a disease diagnosis. Yield losses from foliar diseases can reach as high as 58% when infections in field occur early and environmental conditions favor disease spread and development (Berry et al., 2000). Early detection and diagnosis of disease with timely applications of foliar fungicides are necessary to avoid devastating losses. Rapid diagnosis of plant pathogens is also critical because some fungicides cannot be applied after a certain stage in plant's maturity. In addition, some genetic leaf abnormalities like lesion mimics, leaf speckling, heat stripe, genetic stripe, among others, can be similar to symptoms produced by plant pathogens. Other reasons why it is important to assess disease early and accurately are to predict yield loss, monitor and forecast epidemics, to assess crop germplasm for disease resistance, and for understanding fundamental biological processes including coevolution (Bock et al., 2010). An improper diagnosis of a genetic abnormality or a plant pathogen can be very costly (Berry et al., 2000). Microscopy involves isolation and growing a pure culture of the pathogen in a suitable medium and observing for diagnostic features under the microscope.
Serology
As alternatives and over years, serological and immunological methods like Enzyme-linked Immunosorbent Assay (EIA), Immunoelectron microscopy (IEM) and Polymerase Chain Reaction (PCR) have been in use at one time or other. In the last three decades, specifically PCR, enhance technique process is widely applied in plant disease diagnosis and phenotyping (Nutter et al., 2006; Jackson et al., 2007; Hilber and Scheupp, 1992). PCR offers several advantages compared to traditional methods of diagnosis: Organisms need not be cultured prior to their detection by PCR; the technique possesses exquisite sensitivity, with theoretical potential to detect a single target molecule in a complex mixture without using radioactive probes; and it is rapid and versatile. Hence, the use of PCR to diagnose plant diseases and other applications in plant pathology has remained unsurpassed.
Modern technologies
As impressive as these methods may be, there is a direct contact between diagnostician and plant or plant parts and this may introduce assessment errors. The use of Geographic Information Systems (GIS) and Digital Imaging (DI) in plant diseases diagnosis falls under broad definition of “remote sensing” (Bock et al., 2010), which implies obtaining information about an object without having direct physical contact with it (de Jong et al., 2006). Remote sensing of disease is a passive process, rather than an active method that would generate imaging radiation. Both GIS and DI provide systems and methods that allow diagnostic technician to diagnose diseases and other plant anomalies without physically handling plant tissue, which limits errors.
The technologically advanced application using remote sensing techniques to detect and measure plant diseases started with aerial photography (Neblette, 1927; Taubenhaus et al., 1929) and has been applied to various pathos systems (Colwell, 1956; Brenchley, 1964; Wallen and Jackson, 1971; Jackson et al., 1978; Lillesand et al., 1981; Gerten and Weise, 1984; Edwards et al., 1985; Lee, 1989). It had been applied as an accurate and reliable method to detect plant diseases, facilitated by highly sophisticated and innovative methods of data analysis that lead to new insights derived from sensor data for complex plant–pathogen systems (Mahlein, 2016). Indeed, automated image analysis-based phenotyping provides a powerful alternative to visual assessments. Indeed, automation eventually provides a calibrated image analysis, thereby eliminating any subjectivity of raters and ensuring reproducibility (Rousseau et al., 2013).
Geographical information systems
GIS is a computer system that assembles and stores, manipulates, and displays geographically referenced information. In addition, it analysis and provides an electronic representation of information called spatial data from different sources including natural earth and other manufactured features. GIS references these real-world spatial data elements to a coordinate system, which later can be separated into different layers. GIS system stores each category of information in a separate "layer" for ease of maintenance, analysis, and visualization. For example, layers can represent terrain characteristics, census data, demographics information, environmental and ecological data, roads, land use, river drainage and flood plains, and rare wildlife habitats. The power of GIS lies in its ability to analyze relationship between features and their associated data (Samson, 1995). Different applications create and use different layers. GIS can also store attribute data, which is descriptive information of map features.
This attribute information placed in a database separate from graphics data, but linked to them. GIS allows examination of both spatial and attribute data at same time. In addition, GIS allows users to search attribute data and relate it to spatial data. Thus, it combines geographic and other types of data to generate maps and reports, enabling users to collect, manage, and interpret location-based information in a planned and systematic way. The sources of such data include satellite imagery, aerial photos, maps, ground surveys, and global positioning systems (GPS).
Application in plant pathology
GIS can be applied in different disciplines including veterinary activities, where it is used to understand dynamics and spreading pattern of a disease and quick response in the case of disease emergency (Jebara, 2007). In area of plant disease and pest management, Thomas et al. (2002) applied GPS technology to study outbreak of six insect pests and 12 diseases and risk map in various crops from six different states in United States of America and make management decisions. GIS is also important in spatial analysis of plant disease epidemics (Nutter et al., 1995; Orum et al., 1997); mapping distribution of diseases or specific genotypes of plant pathogens, plant disease epidemiology and management (Nelson et al., 1999). Jaime-Garcia et al. (2001) analyzed genetic structure of Phytophthora infestans that causes late blight disease in a mixed potato and tomato production area in Mexico.
Jaime-Garcia and Cotty (2006), studied spatial relationship texture, crop rotation and Aspergillus sp. community structure in soil. Sanyong and Amarakul (2001), applied GIS to study distribution of three tree species in different parts of Thailand and lastly, Azahar et al. (2011) and Taliei et al. (2013) compared effect of plant density on distribution pattern of diseases in Malaysia. Therefore, importance of GIS in plant disease detection and diagnosis has wide application in precision agriculture.
Digital imaging (DI)
Digital imaging is an art as well as science. It is the art of making images (pictures) like photographs and printed text or artwork using digital camera or image machine. Digital cameras are easy to handle and are a simple source of RGB (red, green, and blue) digital images for disease detection, identification and quantification. RGB colour images with red, green and blue channels are used to detect biotic stress in plants (Bock et al., 2010). Each image comprises of a certain amount of pixels, which are then mapped unto a grid and stored in a sequence by a computer. In all classes of digital imaging, information are converted by image sensors into digital signals processed by computer and outputted as a visible light image.
The steps in digital imaging are: Image acquisition, image pre-processing, features extraction and neural network based classification (Priya, 2015). A flow diagram for identification of plant diseases using image processing techniques is as follows (Figure 1).
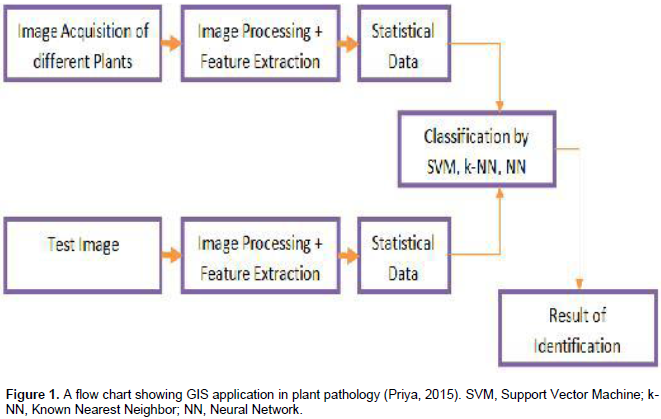
Techniques of digital imaging
Digital imaging processing techniques include detection, quantification, and classifying plant diseases. Quantification estimates severity of a particular disease, either estimating leaves area affected by disease or how deep infection rooted is on the affected plant or part, which can be estimated by means of colour and texture features.
Most quantification algorithms include a segmentation step to isolate symptoms, from which features can be extracted and properly processed in order to provide an estimate of disease severity. It is worth noting that problem of determining disease severity by analysing and measuring its symptoms is difficult even if performed manually by one or more specialists, which have to pair diagnosis guidelines with symptoms as accurately as possible.
As a result, manual measurements will always contain some degree of subjectivity, which in turn means that references used to validate automatic methods are always correct (Barbedo, 2013). It is important to take this to consideration when assessing the performance of those methods. Classification is an extension of detection methods, but instead of detecting only one specific disease amidst different conditions and symptoms, it identifies and labels whichever pathogen is affecting plant. Classification method includes a segmentation step, which is normally followed by extraction of a number of features that will feed some kind of classifier (Barbedo, 2013).
Types of digital imaging sensors
Multi and hyperspectral reflectance sensors: These sensors are grouped on the basis of spectral resolution of their spatial scale and type of detector (whether the sensors are imaging or non-imaging systems). This notwithstanding, they assess spectral information of objects at broadband wavelengths. Multispectral imaging sensors provide data in the R, G and B wavebands, including infrared band. Modern hyperspectral sensors increase the complexity of data measured up to 350 to 2,500 nm (Steiner et al., 2008). While non-imaging sensors average the spectral information over a certain area, hyperspectral data can detect huge matrices along spatial x- and y- axes. The strong, spatial resolution influence pathogen interactions (Mahlein et al., 2012b, West et al., 2003). Sensors with approximately 1 m spatial resolutions are usually unsuitable to detect single symptoms on diseased plant parts.
Thermal sensors: Infrared thermography (IRT) correlates plant temperature with plant water status, micro climate in crop stands and changes in transpiration due to early infections by plant pathogens (Jones et al., 2002; Lenthe et al., 2007; Oerke et al., 2006). Emitted infrared radiation in the thermal infrared region from 8 to 12 um can be detected by thermographic and infrared cameras and is illustrated in false colour images, where each image pixel contains the temperature value of the measured object. In pathosystem for apple and Venturia ineaqualis, thermography visualized the spatial colonization of apple tissues by the pathogen above visible symptoms, where hyphae and conidia were only seen through microscopy (Oerke et al., 2011). Gomez (2014) monitored the infection and spread of Peronospora sparsa on different Rosa cultivars using IRT. IRT effectively analysis the heterogeneity between and within leaves, mean temperature difference within single leaves, plants and crop stands which are important indicators for appearance of disease symptoms.
Fluorescence imaging sensors: Chlorophyll fluorescence imaging assesses photosynthetic electron transfer and differences in plants photosynthetic activities (Bauriegel et al., 2014). It has been used to study differences in the photosynthetic activity due to biotic and abiotic stresses leaves (Bürling et al., 2011, Scholes and Rolfe, 2009).
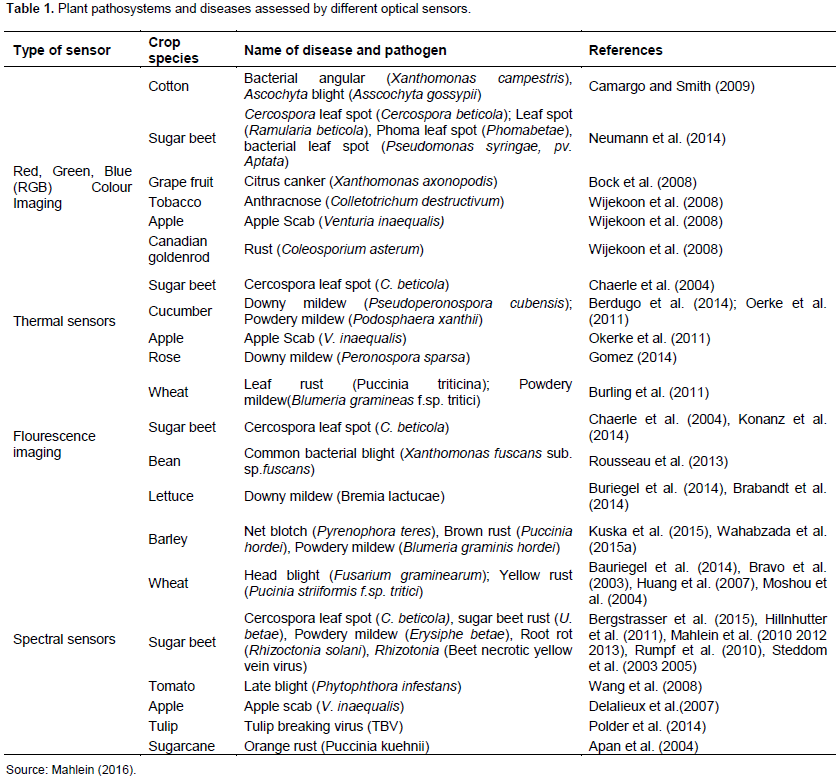
A combination of fluorescence imaging with image analysis techniques is useful for discrimination and quantification of fungal infections (Konanz et al., 2014). Research has been directed at extracting fluorescence parameters from sun-induced reflectance in the field, which would have potential for plant disease assessment at canopy or field level (Rossini et al., 2014). A variety of sensors methods have been used for different plant pathogen systems (Table 1) (Mahlein, 2016).
Digital imaging in plant pathology application
A pioneering study to demonstrate capacity of remote sensing and image analysis in plant pathology was Nilsson (1980, 1995). Previous reviews on use of images from digital cameras in agriculture and other plant sciences include Nutter (1990), Price and Osborne (1990) and Nilsson (1995). Specifically, Bock (2010) gave a comprehensive review on use of image analysis to assess disease severity. As an important tool in plant pathology, Digital Imaging is used to assess disease severity (Bock 2010), diagnose plant diseases and other disorders, to quantify host resistance and plant disease classiffication (Newton, 1989; Holmes et al., 2000; Mahlein, 2016). Detection can be partial or real time; in partial classification, a disease was identified amongst other several possible maladies. In partial classification, putative regions are classified as being disease result of interest or not, instead of applying a complete classification into any possible disease. Abdullah et al. (2007) applied this method, using neural networks to discriminate between Corynespora pathogen from other pathogens that affect rubber tree (Hevea brasiliensis) leaves. Real time monitoring continuously monitors crops and raises an alarm as soon as disease of interest was detected in any plants. For instance, Sena et al. (2003) discriminated between maize plants affected by fall armyworm from healthy ones.
Mahlein (2016) reported that image-based diagnosis of plant diseases has been refined for many crop systems over many years. The studies further showed that image-based phenotyping produced more accurate and precise results than visual assessments of disease in different pathogens. The use of automated, high-throughput digital imaging in plant disease phenotyping allows for collection of data at numerous time points, produce images from which quantitative phenotype data can be derived and improve reproducibility of experiments. Many different phenotype measurements can be obtained from image data.
For studies on plant growth and development, these measurements may be plant height or biomass. For studies of plant disease or other stresses, percent leaf area covered with symptoms or changes in photosynthetic responses can be derived from images. Tucker and Chakraborty (1997) used image analysis to count lesion number and measure severity of leaf blight (Alternaria helianthi) of sunflower (Helianthus annuus) and oat leaf rust (Puccinia coronate f.sp. avenae) on oats (Avena sativa). Newton (1989), used image analysis to measure sporulation area of powdery mildew (Erisyphe graminis) on barley leaves of various cultivars. Although this parameter showed significant positive correlation with most components of partial resistance, but image analysis was unable to discern colony size component reduced which could be performed through visual rating. However, Todd and Kommendahl (1994) found image analysis more discerning than raters at differentiating germplasm reaction of corn to Fusarium spp. causing stalk rot, and for differentiating among Fusarium spp., although no actual values were used in the study. Image analysis was as good as, and complimentary to visual assessment comparing resistance of potatoes to late blight based on internal images of symptoms in tuber (Niemira et al., 1999).
Studies with a variety of pathogens show that image-based diagnosis produces a more accurate and precise results than can be obtained with visual assessments of disease and allows for exploration of more dimensions of disease phenotypes. Stewart and McDonald (2014) used automated image analysis of infected wheat leaves to analyse disease symptoms of septoria wheat blotch caused by Zymoseptoria tritici. This fungus is characterised by chlorosis, necrotic lesions and fruiting bodies (pycnidia). Typical visual disease assessment relied on estimates of percentage leaf area covered by pycnidia lesions. Pycnidia are small and accurate estimates of pycnidia cover are difficult to make especially when they are numerous. Image analysis made it possible to quantify pycnidial size and density along with other traits, which would not have been possible with visual assessment alone. Olmstead et al. (2001) found that image analysis of powdery mildew (Podosphaera clandestine) on sweet cherry was inferior to rater estimates when compared to actual values. Despite these studies, most recent works suggest that image analysis most often provides a more accurate and precise, but generally more time-consuming way of rating disease. Image analysis has now been widely tested and explored as a tool in plant pathology, and for applicability in sectors within discipline having various research goals. Thus, image-based phenotyping can greatly enhance data available for characterizing plant disease (Mukta and Bart, 2015). Again, Bock et al. (2008) examined citrus canker disease symptoms on grape fruit leaves caused by bacterium Xanthomonas axonopodis Pv. citri using digital imaging. Studies on bacterial blight caused by Xanthononas spp. on two different genotypes of bean found that image analysis enhanced ability to distinguish between genotypes with different levels of disease severity (Xie et al., 2012). Furthermore, all measurements of disease were reproducible between different disease susceptibility levels on different genotypes. Hence, image-based phenotyping offers potential to improve reproducibility and sensitivity of disease quantification.
Some advanced system with potential applications in field are imaging platform for detection of tulip breaking virus (TBV) infected tulip bulbs (Polder et al., 2014) or a prototype of a hyperspectral imaging platform for yellow rust detection (Puccinia striiformis) in wheat (Bravo et al., 2003). Polder et al. (2014) developed a robot with multispectral cameras and online machine vision analysis pipeline. This work was the result of limited technical experts for rating tulip bulbs. They were able to adjust and optimize this system to attain a level of accuracy equivalent to that obtained by experienced rating experts. Bravo et al. (2003) detected and classified yellow rust diseased patches in wheat fields with a success rate of 96% under ambient light conditions using hyperspectral imaging. The result was very encouraging, leading to development of cost effective optical sensor platform for early and accurate detection of plant diseases in different crops. Considering plant disease occurrence depends on specific environmental factors and often exhibit a heterogeneous distribution in fields, optical techniques such as RGB (Red, Green, Blue) imaging, multi and hyperspectral sensors, thermography or chlorophyll fluorescence that use digital imaging are useful in identifying primary diseases foci and areas differing in disease severity in the fields (Franke and Menz, 2007).
CONCLUSION
This article has reviewed useful additions on GIS and DI applications in plant disease diagnosis, detection and measurement of disease severity. Although previously known methods such as PCR, ELISA, and visual assessment are already available and widely used for plant disease detection, but not without obvious setbacks. On other hand, GIS and digital imaging are particularly useful in diagnosing and identifying recurring patterns of plant disease as well as other problems such as insect and weed infestations without direct contact with plant or plant parts. A highly interdisciplinary approach with a close link to practical agriculture could lead to powerful solutions for diagnosis and disease detection with high accuracy and sensitivity that will improve plant health management. For best results successful applications of GIS and digital imaging in plant disease diagnosis requires teamwork, involving an experienced field diagnostician and an experienced computer user with some background in statistics. Incorporating traditional epidemiological statistical techniques into a GIS interface allows researchers to gain a greater insight into the spatial aspect of disease spread. In addition, availability of software capable of producing attractive maps provides an opportunity to communicate in visually form, plant disease situation to a wider audience.
CONFLICT OF INTERESTS
The authors have not declared any conflict of interests.
REFERENCES
|
Abdullah NE, Rahim AA, Hashim H, Kamal MM (2007). Classification of rubber tree leaf diseases using multilayer perceptron neural network. In: 5th student conference on research and development. IEEE, Selangor pp. 1-6. |
|
|
Apan A, Held A, Phinn S, Markley J (2004). Detecting sugarcane 'orange rust' disease using EO-1 Hyperion hyperspectral imagery. Int. J. Remote Sens. 25:489-498. |
|
|
Azahar TM, Mustapha JC, Mazliham S, Boursier P (2011). Temporal analysis of basal stem rot disease in oil palm plantations. An analysis on peat soil. Int. J. Eng. Technol. 11(3):96-101. |
|
|
Barbedo JGA (2013) Digital image processing techniques for detecting, quantifying and classifying plant diseases. SpringerPlus 2:660. |
|
|
Bauriegel E, Braband H, Garber U, Herppoach WB (2014). Chlorophyll fluorescence imaging to facilitate breeding of Bremia lactucae-resistant lettuce cultivars. Comput Electron Agric. 105:74-82. |
|
|
Berdugo C, Zito R, Paulus S, Mahlein AK (2014). Fusion of sensor data for the detection and differentiation of plant diseases in cucumber. Plant Pathol. 63:1344-1356. |
|
|
Bergstrasser S, Fanourakis D, Schmittgen S., Cendrero-Mateo MP, Jansen M, Scharr H, Rascher U (2015). HyperART non-invasive quantification of leaf traits using hyperspectral absorption-reflectance-transmittance imaging. Plant Methods 11:1. |
|
|
Berry JA, Dolezal WE, Sayers AC (2000). Remote imaging system for plant diagnosis. United States of America, Patent Number: US 6014451A. |
|
|
Bock CH, Poole GH, Parker PE, Cook AZ, Gottwald TR (2008). Visual rating and the use of image analysis for assessing different symptoms of citrus canker on grapefruit leaves. Plant Dis. 92:530-541. |
|
|
Bock CH, Poole GH, Parket PE, Gottwald TR (2010). Plant disease severity estimated visually by digital photography and image analysis and by hyperspectral imaging. Crit. Rev. Plant Sci. 29(2):59-107. |
|
|
Brabandt H, Bauriegel E, G¨arber U, Herppich WB (2014). ФPSII and NPQ to evaluate Bremia lactucae-infection in susceptible and resistant lettuce cultivars. Sci. Hortic. (Amsterdam) 180:123-129. |
|
|
Bravo C, Moshou D, West J, McCartney A, Ramon H (2003). Early disease detection in wheat fields using spectral reflectance. Biosyst. Engine. 84:137-145. |
|
|
Brenchley GH (1964). Aerial photography for the study of potato late blight epidemics. World Rev. Pest Cont. 3:68-84. |
|
|
Bürling K, Hunsche M, Noga G (2011). Use of blue-green and chlorophyll fluorescence measurements for differentiation between nitrogen deficiency and pathogen infection in wheat. J. Plant Physiol, 168:1641-1648. |
|
|
Camargo A, Smith JS (2009). Image pattern classification for the identification of disease causing agents in plants. Comput. Electron Agric. 66:121-125. |
|
|
Chaerle L, Hagenbeek D, DeBruyne E, Valcke R, Van Der Straten D (2004). Thermal and chlorophyll fluorescence imaging distinguish plant pathogen interactions at an early stage. Plant Cell Physiol. 45:887-896. |
|
|
Chester KS (1950). Plant disease losses: their appraisal and interpretation. Plant Dis. Rep. Supplement 190-198 (S193):190-362. |
|
|
Cobb NA (1892). Contribution to an economic knowledge of the Australian rusts (Uredinae). Agric. Gazt. (NSW) 3:60. |
|
|
Colwell RN (1956). Determining the prevalence of certain cereal crop diseases by means of aerial photography. Hilgardia 26:223-286. |
|
|
Cook RJ, Madden LV (2002). Crop biosecurity and countering agricultural bioterrorism: Responses of the American phyopathological Society. APS White paper. Apsnet Feature Story. http://www.apsent.org/online. |
|
|
Cotty PJ, Probst C, Jaime-Garcia R (2006). Etiology and management of aflatoxin contamination. In Leslie, J.F., Bandyopadhyay, R., and Visconti, A. (eds) Mycotoxins: detection methods, management, public health and agricultural trade. Wallingford: CABI Publ. pp. 287–299. |
|
|
de Jong SM, Van de Meer FD (2006). Remote Sensing Image Analysis: Including the Spatial Domain. Book series on Remote Sensing Digital Image Processing Vol.5. Kluwer Academic Publishers, Dordrecht. ISBN: 1-4020-2559-9, 359 p. |
|
|
Delalieux S, van Aardt J, Keulemans W, Coppin P (2007). Detection ofbiotic stress (Venturia inaequalis) in apple trees using hyperspectral data: non-parametric statistical approaches and physiological implications. Eur. J. Agron. 27:130-143. |
|
|
Edwards GJ, Balzquez CH, Miller J (1985). Preliminary experiments with remote sensing to detect citrus canker. Proc. Fla. State. Hortic. Soc. 98:16-18. |
|
|
Franke J, Menz G (2007). Multi-temporal wheat disease detection by multispectral remote sensing. Précis Agric. 8:161-172. |
|
|
Gauhl F, Pasberg-Gauhl C, Vuylsteke D, Ortiz R (1993). Multolocational evaluation of Black Sigatoka resistance in banana and plantain. IITA research guide, 47. Int. Inst. Trop. Agric. (IITA), Ibadan, Nigeria. 59pp. |
|
|
Gerten DM, Weise MV (1984). Video image analysis of lodging and yield loss in winter wheat relative to foot rot. Phytopathology 74:872. |
|
|
Gomez S (2014). Infection and spread of Peronospora sparsa on Rosa sp (Berk). A microscopic and a thermographic approach. Dissertation, University of Bonn, Germany. |
|
|
Hilber UW, Scheupp H (1992). Accurate and rapid measurement of lengths of fungal germ tubes by image analysis. Can. J. Plant Pathol. 14:185–186. |
|
|
Hillnhutter C, Mahlein AK, Sikora RA, Oerke EC (2011). Remote sensing to detect plant stress induced by Heterodera schachtii and Rhizoctonia solani in sugar beet fields. Field Crops Res. 122:70-77. |
|
|
Holmes GJ, Brown EA, Ruhl G (2000). What's a picture worth? The use of modern communications in diagnosing plant diseases. Plant Dis. 84:1256-1265. |
|
|
Horsfall JG, Barrat RW (1945). An improved grading system for measuring plant disease. Phytopathology 35:655. |
|
|
Huang W, Lamb DW, Niu Z, Zhang Y, Liu L, Wang J (2007). Identification of yellow rust in wheat using in-situ spectral reflectance measurements and air borne hyperspectral imaging. Précis Agric. 8:187-197. |
|
|
Jackson EW, Obert DE, Menz M, Hu G, Avant JB, Chong J, Bonman JM (2007). Characterization and mapping oat crown rust resistance using three assessment methods. Phytopathology 97:1063-1070. |
|
|
Jackson HR, Wallen VR, Downer JF (1978). Analysis and electronic area measurement of complex aerial photographic images. J. App. Photo. Eng. 4:101-106. |
|
|
Jaime-Garcia R, Orum TV, Felix-Gastelum R, Trinidad-Correa R, Vanetten AD, Nelson MR (2001). Spartial analysis of Phytophthora infestans genotypes and late blight severity on tomato and potato in the Delfuerte valley, using geostatistics and geographic information systems. Phytopathology 91:1156-1165. |
|
|
Jaime-Garcia R, Cotty PJ (2006). Spatial relationships of soil texture and crop rotation to Aspergillus flavus community structure in South Texas. Phytopathology 96:599-607. |
|
|
James WC (1971). An illustrated series of assessment keys for plant diseases, their preparation and usage. Can. Plant Dis. Surv. 51:39-65. |
|
|
Jebara KB (2007). The role of Geographic Information System (GIS) in the control and prevention of animal diseases. OIE (World Organisation for Animal Health) Conf. Paris, France. pp. 175-183. |
|
|
Jones HG, Stoll M, Santoa T, De-Sousa C, Chaues MM, Grant OM (2002). Use of infrared thermography for monitoring stomatal closure in the field: Application to grapevine. J. Exp. Bot. 53:2249-2260. |
|
|
Kumar PL, Sreenivasulu P (2009). Diagnosis of virus diseases. In: Kumar PL (ed.) Methods for the Diagnosis of Plant Virus Diseases- Laboratory Manual International Institute of Tropical Agriculture (IITA), Ibadan, Nigeria pp. 7-11. |
|
|
Kumar PL, Sreenivasulu P, Waliyar F (2009). ELISA and RT-PCR methods for the detection of plant viruses. In: Kumar PL (ed.) Methods for the Diagnosis of Plant Virus Diseases- Laboratory Manual International Institute of Tropical Agriculture (IITA), Ibadan, Nigeria pp. 19-26. |
|
|
Kuska M, Wahabzada M, Leucker M, Dehne HW, Kersting K, Oerke EC, Steiner U, Mahlein AK (2015). Hyperspectral phenotyping on microscopic scale – towards automated characterization of plant-pathogen interactions. Plant Methods 11:28. |
|
|
Large EC (1966). Measuring plant disease. Ann. Rev. Phytopath. 4:9-26. |
|
|
Lee YJ (1989). Aerial photography for the detection of soil-borne disease. Can. J. Plant Pathol. 11:173-176. |
|
|
Lillesand TM, Meisner DM, French DW, Johnsson JL (1981). Evaluation of digital photographic enhancement for dutch elm disease detection. Photogramm. Eng. Remote Sens. 48:1581-1592. |
|
|
Mahlein AK (2016). Plant disease detection by imaging sensors-parallel and specific demands for precision agriculture and plant phenotyping. Plant Dis. 100(2):241-251. |
|
|
Mahlein AK, Rumpf T, Welke P, Dehne HW, Pl¨umer L, Steiner U, Oerke EC (2013). Development of spectral vegetation indices for detecting and identifying plant diseases. Remote Sens. Environ. 128:21-30. |
|
|
Mahlein AK, Steiner U, Dehne HW, Oerke EC (2010). Spectral signatures of sugar beet leaves for the detection and differentiation of diseases. Precis. Agric. 11:413-431. |
|
|
Mahlein AK, Steiner U, Hillnhütter C, Dehne HW, Oerke EC (2012b). Hyperspectral imaging for small scale analysis of symptoms caused by different sugar belt disease. Plant Methods 8(3):1746-4811. |
|
|
Moshou D, Bravo C,West J, Wahlen S, McCartney A, Ramon H (2004). Automatic detection of 'yellow rust' in wheat using reflectance measurements and neural networks. Comput. Electron. Agric. 44:173-188. |
|
|
Mutka AM, Bart RS (2015). Image-based phenotyping of plant disease symptoms. Front. Plant Sci. 5(1):734. |
|
|
Myerson LA, Reaser JK (2002). Biosecurity: Moving toward a comprehensive approach. Bioscience 52:593-600. |
|
|
Neblette CB (1927). Aerial photography for the study of plant disease. Photo-Era Magazine 58:346. |
|
|
Nelson MR, Orum TV, Jaime-Garcia R, Nadeem A (1999). Applications of Geographic information systems and geostatistics in plant disease epidemiology and management. Plant Dis. 83:308-319. |
|
|
Neumann M, Hallau L, Klat B, Kerstong K, Bauckhage C (2014). Erosion band features for cell phone image based plant disease classification. Proceeding of the 22nd international Conference on Pattern recognition (ICRR). Stockholm: Sweden. |
|
|
Newton AC (1989). Measuring the sterol content of barley leaves infected with powdery mildew as a means of assessing partial resistance to Erysiphe graminis f.sp. hordei. Plant Pathol. 38:534-540. |
|
Copyright © 2024 Author(s) retain the copyright of this article.
This article is published under the terms of the Creative Commons Attribution License 4.0


