ABSTRACT
In this study, the trend and variability of rainfall were analyzed for Setema and Gatira meteorological stations. Daily rainfall data for two stations was obtained from National Meteorological Agency of Ethiopia. Mann-Kendall’s test was employed for a rainfall trend analysis. Standardized rainfall anomaly index, rainfall concentration index and coefficient of variation were used as descriptors of rainfall variability. The trend analysis revealed decreasing rainfall trend in Setema and increasing trend in Gatira. However, rainfall trends were not statistically significant (p < 0.05). The coefficient variation of the study area for Setema was (CV = 23%), while for Gatira it was (CV = 8%) which showed lower inter-annual variability. The rainfall concentration index revealed that 35% of years with values of PCI >16 in setema indicate poor monthly distribution. Monthly rainfall concentration range from moderate to high and total rainfall of the study area concentrated in ½ of the period. The standardized anomalies of annual rainfall revealed negative anomalies 42% at Setema and 50% of years at Gatira. All most in all stations annual rainfall has shown negative anomalies for much of the 1983/4 and 1994. Present study only showed local level rainfall trend and variability analysis, so future study should include watershed or regional levels.
Key words: Climate, rainfall trend, standard anomaly index, precipitation concentration index.
Climate variability and change are among the major environmental challenges of the 21st century (
Parry et al., 2007). Today, there is strong evidence and under-standing that climate change is happening and it is recognized as being one of the greatest challenges of our century. Climate change affect with increased average annual temperatures, reduced and increased variability in rainfall reduces crop yield and threatens food security in low-income and agriculture-based economies (Meybeck et al., 2012). IPCC (2007) report confirmed a change to precipitation due to climate change. However, Change in rainfall and temperature are not globally uniform (Parry et al., 2007). Regional variations can be much larger, and considerable spatial and temporal variations may exist between climatically different stations.
Agriculture is the most dominant sector of Ethiopia economy contributing 42 to 45% of GDP and 80% of employments (Gebregziabher et al., 2011). Despite its significant contribution to national economy the sector is challenged mainly by climate related disaster. According to World Bank (2010) report, drought and flood are very common climate change-related hazards in Ethiopia, with significant drought events occurring every 3 to 5 years. The main source of water for the sector is natural rainfall, so any change in rainfall amount and distribution lead to serious production deficit (Hagos et al., 2009). In this regard, knowing the variations in the general rainfall pattern is vital to understand the climate change variations and its consequence on ecosystem (Krishan, 2013).
Precipitation trend analysis on different spatial and temporal scales, has been of great concern during the past century because of the attention given to global climate change by the scientific community. Assessing rainfall trends and variability is paramount to understanding the variations in space and time. The IPCC (2007) suggested that detail analysis is of local precipitation variability. In Ethiopia, several studies have been carried out on rainfall and temperature trend and variability analysis based on historical data of some selected weather stations (Baley, 2014, Ayelow et al., 2012, and Hadgu et al., 2013) and over whole the country (NMA, 2007; McSweeney et al., 2008; Koricha et al., 2012; wing et al., 2008). Among the studies NMA (2007) reported that annual rainfall remained more or less constant when averaged over the whole country (NMA, 2007). However, mean annual temperature in Ethiopia has increased by 1.3°C between 1960 and 2006, at an average rate of 0.28°C per decade increased (McSweeney et al., 2008). On other hand, Wing et al. (2008) report shows a significant decline in main season (June to September) rainfall was recorded in the southwestern and central parts of Ethiopia. Similarly, Baley (2014) findings revealed declined rainfall in central rift valley of Ethiopia. It is very difficult to detect long-term rainfall trends in Ethiopia, due to the high inter-annual and inter-decadal rainfall variability. Assessing trends and variability in rainfall based on past records helps with better understanding of problem associated with drought, floods and various water uses (Jain et al., 2012). Moreover, it also essential to develop adaptation strategies and for planning agricultural activity (Aghajani, 2007). The present study has provided an assessment of rainfall trends and variability in Setema-Ageyo districts of Jimma southwestern Ethiopia.
Study area descriptions
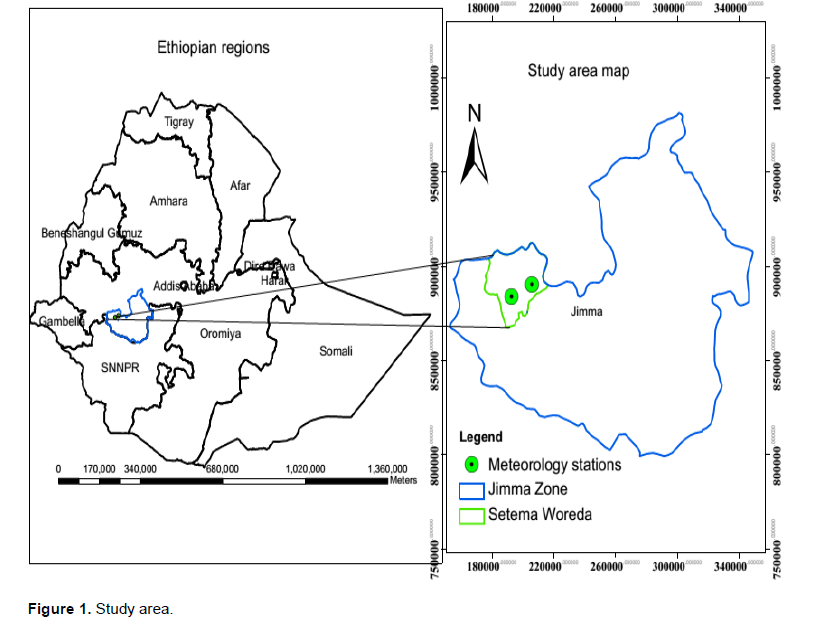
The research was conducted in two districts of Oromia region (Setema and Gumay) in the southwestern, Ethiopia. Geo-graphyically, the study area is located between 8° 4’ to 8° 2’ North latitude and 30° 20’ to 30° 28’ East longitude. The study area is located at about 450 kilometers away from Addis Ababa, capital city of Ethiopia and 100 km in North West of Jimma town (Figure 1). The altitudinal range of the study district is between 1450 and 2400 meters above sea level (m.a.s.l). These two districts were selected because the availability of long term meteorological data. The mean annual rainfall in the study area is 1665 mm/year. Western and southwestern parts of the country experience a unimodal rainfall pattern. October to January (Birra) denotes the time when the long rainfall season comes to an end to be followed by a medium to short dry season during the same period. February to May (Bona) is the start of the long rainy season. Over the western parts of the country in region also the rainy season starts during March/April. June to September (Main season) is a long and heavy summer rain, normally called the big rain or Gannaa, which falls from June to September (http://www.meteo-ethiopia.net/climate. htm October 2014). Study area annual average maximum temperature is 27.9°c and minimum temperature is 11.9°c. Change in time/quantity of seasonal and annual rainfall is an important factor in the agriculture activities of the study areas.
Agriculture is the main economic activities and is dominated by small-scale and mixed crop and livestock farmers. Crop production is mainly rain-fed. Coffee plays a major role in income generation in the areas. Maize, Teff (Eragrostis teff) and sorghum (Sorghum bicolor) are the major crops grown in the area. Pulses crops, such as, beans and pea are grown to a lesser extent in the area (JZAO, 2013).
Approach
In this study, annual and seasonal patterns of the rainfall are examined for two meteorological stations based on inter-seasonal spread of rainfall: June to September (Gannaa), October to January (Birraa) and March to April (Bona). Daily rainfall record for the selected stations (Table 1) where obtained from Ethiopia National Meteorology Agency for the period of 1983 to 2013 for Gatira and 1979 to 2011 for Setema. Monthly, seasonal and annual rainfalls were derived from the daily data of those stations. Data was used to analyze the trends and variability in rainfall for the stations.
Rainfall trend and variability analysis
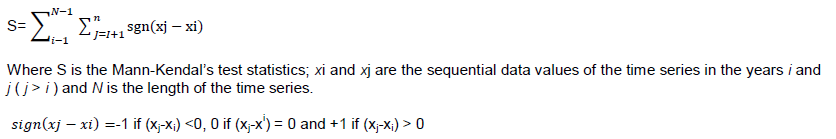
In this particular study, Mann-Kendall’s test was employed. Mann-Kendall’s test is a non-parametric method, which is less sensitive to outliers (Mann, 1945). Mann-Kendall’s test checks the hypothesis of no trend versus the alternative hypothesis of the existence of increasing or decreasing trend.

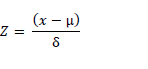
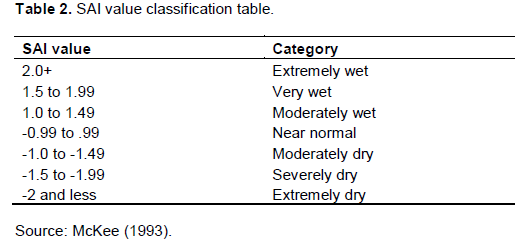
Standardized rainfall anomaly index, rainfall concentration index and coefficient of variation were used as descriptors of rainfall variability. The rainfall variability for representative meteorological stations was determined by calculating the coefficient of variation (CV) as the ratio of the standard deviation to the mean rainfall in a given period (CV%, when expressed as a percentage) as used by (Belay, 2014; Ayelow et al., 2012). Standardized Anomaly Index was calculated as the difference between the annual total of a particular year and the long term average rainfall records divided by the standard deviation of the long term data. This characteristic of the SAI have contributed to its popularity for application drought monitoring and also makes possible the determination of the dry and wet years in the record (WMO, 2012). Its formula is given as:

Where, Z is standardized rainfall anomaly; x is the annual rainfall total of a particular year; μ is mean annual rainfall over a period of observation and μ is the standard deviation of annual rainfall over the period of observation. Standardized anomaly index value was categorized according to McKee (1993) classification (Table 2). This study used also precipitation concentration index (PCI) to investigate heterogeneity of monthly rainfall (Oliver, 1980).

Annual and seasonal rainfall concentration index according to Oliver’s classification11: i. PCI < 10 indicates uniform rainfall distribution (low rainfall concentration), ii. PCI >11 and <15 indicates moderate rainfall concentration; iii. PCI >16 and < 20 indicates irregular distribution, iv. PCI > 20 indicates a strong irregularity (that is, high rainfall concentration) (Oliver, 1980).The main aims of analysis of annual and seasonal Precipitation Concentration Index (PCI) is to characterize spatial and temporal distribution of rainfall, l and PCI value of 16.7 will indicate that the total precipitation was concentrated in ½ of the period and a PCI value of 25 will indicate that the total precipitation occurred in 1/3 of the period (Luis et al., 2011).
Annual and seasonal rainfall trend analysis.
The results of statistical analysis at 95% confidence level for annual rainfall data using Mann-Keld test have both positive and negative trends. The results obtained for rainfall series indicated that Setema revealed negative trends while Gatira showed positive trends for annual rainfall series. Positive value of sen’s slops indicates an upward or increasing trend in Gatira, while Setema negative value of sen’s slop gives a downward or decreasing trend in the time serious (Table 3).

Annual rainfall trend analysis is not statistically significant. Findings from national and regional level rainfall trends analysis reported both increasing and decreasing trends (Wing et al., 2008; Belay, 2014; Kebede and Adane, 2011; and Rao and Solomon, 2013). Wind et al (2008) reported significant decline in rainfall in southwestern Ethiopia. Similarly, Rao and Solomon (2013) who reported that analysis of the historical rainfall records in North Central Ethiopia revealed that there has been trend of decreasing rainfall, However, the trend analysis of annual rainfall showed that rainfall remained more or less constant when averaged over the whole country for 1951 to 2006 (NMA, 2007). Parry et al. (2007) confirmed that regional variations can be much larger, and considerable spatial and temporal variations may exist between climatically different stations.
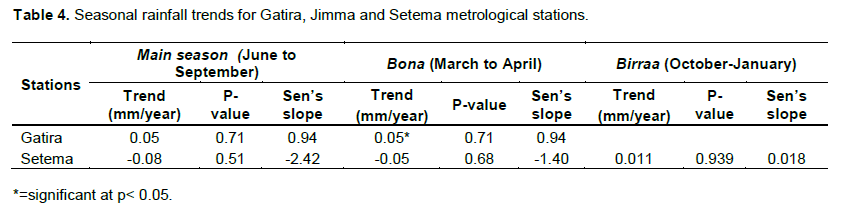
The deviation of annual mean temperature in Setema from 1979 to 2011 gives a strike indicator of change on climate on the study area (Figure 2). The main season (June to September) season revealed negative trends at Setema while positive at Gatira. This season contributes the largest amount of rainfall to annual series (Table 3). Similarly, seasonal rainfall trend analysis result from March to May season which showed negative trend in Setema (Table 4). However, analysis of seasonal rainfall trend analysis for the period of (1981 to 2011) shows rising trend for March to April at Gatira and the trend is statistically significant. Rising trends of March to April rainfall will provide moisture for main season land preparation.
Rainfall variability analysis
The annual weighted average rainfall for studied stations is 1796.5 mm. spatially, mean annual rainfall of study area is ranged from 1665 mm in Setema to 1928 mm in Gatira (Table 5). The main rainy season (June to September) contributes 52 to 60% to the annual rainfall totals while March to April season rainfall also contributes 25 to 30% to the annual rainfall (Table 5). The main (long) rainy season (June to September) total mean rainfall ranges between 1045 and 1010 mm.

Coefficient of variation
The coefficient of variation in stations revealed that rainfall in the region has low inter-annual variability (Table 5). The result indicated that rainfall variability at Setema (CV=23%) while Gatira (CV=8%). Main season (June to September) rainfall contributed the highest Percentages (52 to 60%) of rainfall to annual rainfall and March to April season rainfall also contributes 25%. This result agreed with the findings of (Koricha et al., 2012) who reported that main seasons contributed the highest contribution to the annual rainfall in the country.
Moreover, main season (Gannaa) rainfall coefficient variation range was 24 at Gatira while 38.5 at Setema (Table 5). In line with other studies in Ethiopia, Hadgu et al. (2013) reported that high coefficient annual variation in main season was (CV 30%) and March to April (CV 50%) in northern Ethiopia. Moreover, Baley (2014) who reported that inter-annual rainfall coefficient variation (18 to 40%), main season (CV 17 to 39%) and March to April (CV 27 to 57%) for rift valley of Ethiopia which is high annual variability as compare to this study. The analysis of coefficient of variation for March to April (Bona) season variability in this region is higher than main season rainfall which agreed with many other authors (Belay, 2014, and Hadgu et al., 2013). These suggest that inter-annual and annual variability in rainfall distribution influenced agriculture activities in the study area which was totally rainfall dependant. Small change in amount and distribution of main season (June to September) rainfall could negatively influence crop production which is already impacted by the current climate variability, which may likely cause further challenges in the future climate change.
Rainfall concentration index
The Rainfall Concentration Index values for the annual and seasonal rainfall were calculated based on the equations. The analysis result indicted that the rainfall concentration index (PCI) value ranged from 12 to 18 for most of the stations. The rainfall concentration index calculated at annual level showed values >16 in the Setema station which is moderate rainfall irregularity (Table 6). Rainfall concentration index (PCI) values of less than 10 indicated uniform monthly distribution of rainfall, values between 11 and 20 indicate high concentration, and values above 21 indicate very high concentration (Oliver, 1980).

On the contrary, Ayelew et al. (2012) reported that moderate to high inter-annual rainfall concentration in Amahara region and similarly Belay (2014) study revealed that there is moderate to high in Central Rift Valley in Ethiopia. Furthermore, Hagdu et al. (2013) reported that high and very high concentration in Northern Ethiopia (Tigray) indicates poor monthly distribution of the rainfall. The lowest value of PCI (<10) indicating the perfect uniformity in precipitation distribution or same amount of precipitation occurs in each month of the year. It can be concluded that study area ranges from moderate to high monthly rainfall concentration, which implies that total rainfall of the study area concentrated in ½ of the period (Table 6).
Standardized anomaly index (SAI)
Analysis of the standard anomaly index for the stations is presented in Table 7. This study used SAI to demonstrate the intensity and frequency of drought and inter-annual variation at various time scales and area. The negative anomalies of Gatira station was 48% during the period of 1983 to 2013. In Setema, 52% of years revealed negative anomalies over the period of 1979 to 2011. The differences between the frequencies of occurrence of the dry and wet years range for the studied area were small difference. Negative anomaly index (dry) was observed in 1983, 1984, 1994, 2002, and 2003 in all stations (Figures 3 and 4). In line with this, Quinn and Neal (1987) and Webb and Braun (1994) cited in NAM (2007) reported that Ethiopia experienced drought years in 1983 to 1984, 1987 to 1988, 1990 to 1992, 2000, and 2002 to 2003.


This study indicated that standard anomaly values of (-2 or less) categorized as extremely drought was occurred in 1983, 1984, 1994, 1998, and 2008 years in Setema. The result showed that 2009 and 2008 were the driest years in setema (Table 1). In agreement with this finding, Koricha et al. (2012) also found that nationally, 2009 was the second driest year, surpassed only by the historic year 1984. Moreover, severe drought period standard anomaly values (SAI value -1.5 to -1.99) were observed in 2003 in Setema. On the other hand, severe wet (SAI value of +1.5 to +1.99) period occurred 1987 and 1992 in Setema and extreme severe wet period occurred in 1980 (SAI value 3.21) and 1981 (SAI value 3.84). However, there were no observed extreme and severe drought characteristics in Gatira over the period of 1981 to 2013 (Table 7).
This is in harmony with the findings of (NMA, 2007) who reported that there was increase in the dry year frequency in Ethiopia. The rainfall pattern in the studied stations showed the characteristics that a dry year is followed by another two or three dry years and vis-à-vis for the wet years (Figures 3 and 4). In fact, the mean annual rainfall in studied station exceeds 1737.9 mm which is greater than result in other part of Ethiopia (Kebede and Habtamu, 2011). World Bank (2003) reported that Ethiopian mean annual rainfall range more than (2,700 millimeters) occurs in the southwestern highlands to less than 100 millimeters in northeast.
The present study revealed rainfall fluctuation was occurred both in annual variability (Table 5) and inter-annual variability. Such inter-annual variability problems in rainfall would negatively affect the ability of farmers to cope with climate change and variability (Ayalew et al., 2012). Similarly, IPCC (2014) reported that in next few decades and the second half of the 21st century and beyond, there will be risk of food insecurity and the breakdown of food systems linked to warming, drought, flooding, and precipitation variability and extremes, particularly for poorer populations in urban and rural settings. It is obvious that drought phenomenon will create more vulnerable environment for the subsistence farming sector.
This study was undertaken to understand rainfall variability in Jimma, southwestern Ethiopia. The study employed Mann-Kendall’s test to detect change in rainfall trends. Results for rainfall trend analysis for Setema indicated decreasing trends, while Gatira revealed increasing trends. Overall, the observed trends were not statistically significant. Coefficient of variation revealed that rainfall in the region has low inter-annual variability as compare to studies done over other part of Ethiopia. The standardized anomalies of annual rainfall revealed negative anomalies 42% at Setema, 52% over 1979 to 2011 at Jimma during 1990 to 2013 and 50% of years at Gatira during 1983 to 2013. All most in both stations annual rainfall has shown negative anomalies for much of the 1983/4 and 1994. Present study demonstrated rainfall trend and variability analysis for two meteorological stations in southwestern part of the Ethiopia, however, a comparison was done with result from nationwide and different data ranges. These will provide information on rainfall variability of the districts and could be used as input for the local adaptation planning and to develop adaptation strategies for the study areas.
The authors have not declared any conflict of interests.
The authors are grateful to CHIESA (Change Impacts on Ecosystem Services and Food Security in Eastern Africa) project coordinated by the International Center of Insect Physiology and Ecology (ICIPE) in Nairobi, Kenya and funded by the Ministry for Foreign Affairs of Finland to provide financial support to this thesis and my study. I am also grateful to Ethiopian National Meteorology Agency for providing rainfall data for this study.
REFERENCES
|
Aghajani GR (2007). Agronomic analysis of chartertics of the rainfall case study of Iran pakistan. J. Biol. Sci. 10(8):1354-1359.
|
|
|
|
Ayalew D, Tesfaye K, Mamo G, Yitaferu B, Bayu W (2012). Variability of rainfall and its current trend in Amhara region, Ethiopia. Afr. J. Agric. Res. 7(10):1475-1486.
|
|
|
|
Belay T (2014). Climate variability and change in Ethiopia:Exploring impacts and adaptation options for cereal production. Production Ecology and Resource Conservation, Wageningen University. Doctoral 16. Wageningen University.
|
|
|
|
Gebregziabher Z, Stage J, Mekonnen A, Alemu A (2011). Climate Change and the Ethiopian Economy A Computable General Equilibrium Analysis Environment for Development.
|
|
|
|
Hadgu G, Tesfaye K, Mamo G, Kassa B (2013). Trend and variability of rainfall in Tigray, Northern Ethiopia: Analysis of meteorological data and farmers' perception. Acad. J. Environ. Sci. 1(8):159-171.
|
|
|
|
Hagos F, Awulachew SB, Makombe G, Namara RE (2009). Importance of irrigated agriculture to the Ethiopian economy: Capturing the direct net benefits of irrigation. Int. Water Manage. Inst. P 37. (IWMI Research Report)
|
|
|
|
Inter-governmental Panel on Climate Change (IPCC) (2014a). Adaptation Needs and Options; A. Patt and K. Takeuchi WGII AR5 Chapter 14
|
|
|
|
Inter-governmental Panel on Climate Change (IPCC) (2007). Climate Change Synthesis Report Summary for Policymakers, Fourth Assessment Report, Valencia, Spain, 12-17 November 2007.
|
|
|
|
Jain SK, Kumar V, Saharia M (2012). Analysis of rainfall and temperature trends in northeast India International Journal of Climatology Int. J. Climatol. (2012) Published online in Wiley Online Library. Available at: wileyonlinelibrary.com.
|
|
|
|
Jimma Zone Agricultural Office (JZAO) (2013). Annual report of Jimma one agricultural office Oromia, Ethiopia.
|
|
|
|
Kebede D, Adane H (2011). Climate change adaptations and induced farming livelihoods." Dry lands Coordination Group Report No. pp. 64:10.
|
|
|
|
Koricha D, Viste E, Sorteberg A (2012). Recent drought and precipitation tendencies in Ethiopia. Theory Appl. Climatol. 112:535-551.
|
|
|
|
Krishan G, Pankaj G, Rao MS, Kumar CP, Rajesh A (2014). Aggarwal rainfall trend analysis in Saharanpur District of Uttar Pradesh-Agricultural Context
|
|
|
|
Luis M, Gonz’alez-Hidalgo JC, Brunetti M, Longares LA (2011). Precipitation concentration changes in Spain. Nat. Hazards Earth Syst. Sci. 11:1259-1265, 2011.
|
|
|
|
Mann HB (1945). Non parametric tests again trend. Econometrica 13:245-259.
Crossref
|
|
|
|
McKee TB, Doesken NJ, Kleist D (1993). The relationship of drought frequency and duration to time scale. In: Proceedings of the Eighth Conference on Applied Climatology, Anaheim, California,17–22 January 1993. Boston, Am. Meteorol. Society. pp. 179-184.
|
|
|
|
McSweeney, C., New, M., and Lizcano, G (2008). United Nation Development Programme (UNDP) Climate Change Country Profiles – Ethiopia.
|
|
|
|
Meybeck A, Lankoski J, Redfern S, Azzu N, Gitz V (2012). Building resilience for adaptation to climate change in the agriculture sector. Proceedings of a Joint FAO/OECD workshop, food and agriculture organiztion.
|
|
|
|
National Meteorological Agency of Ethiopia (NMA) (2006). National Adaptation Programme of Action of Ethiopia (NAPA). National Meteorological Agency, Addis Ababa. Ethiopia National Meteorological Agency of Ethiopia (NMA) (2007). Climate Change National Adaptation Programme of Action (Napa) Of Ethiopia. The Federal Democratic Republic Of Ethiopia Ministry Of Water Resources National Meteorological Agency. Abebe T, National Meteorological Agency. Addis Ababa.
|
|
|
|
Oliver JE (1980). Monthly rainfall distribution: a comparative index. Prof. Geogr. 32:300-309.
Crossref
|
|
|
|
Parry ML, Canziani OF, Palutiko JP, VLinden V, Hanson CE (2007). Technical Summary. Climate Change 2007: Impacts, Adaptation and Vulnerability. Contribution of Working Group II to the Fourth Assessment Report of the Intergovernmental Panel on Climate Change,. IPCC Technical report. UK, Cambridge University Press. pp. 23-77.
|
|
|
|
Rao P, Solomon A (2013). Trend Analysis And Adaptation Strategies Of Climate Change In North Central Ethiopia. Int. J. Agric. Sci. Res. (IJASR) 3(1):253-262.
|
|
|
|
Wing H, Gabriel B, Ashbindu S (2008). Trends and Spatial distribution of annual and seasonal rainfall in Ethiopia. Int. J. Climatol. 28(13):1723-1734.
Crossref
|
|
|
|
World Bank (2003). Ethiopia: Managing water resources to maximize sustainable growth.
|
|
|
|
World Bank (2008). Ethiopia: A Country Study on the Economic Impacts of Climate Change. Environment and Natural Resource Management Report, no. 46946-ET. Washington, DC: World Bank, Sustainable Development Department, Africa Region.
|
|
|
|
World Metrology Organization (WMO) (2012). Standardized Precipitation Index User Guide WMO-No. 1090 7 ISBN 978-92-63-11091-6.
View
|